About Editorial team of BIPNs

Main team of content of bipns.com. Any type of content should be approved by us.
9 02, 2025

Is XRP About to Explode? Analysts Predict a Whopping 3,900% Surge!

By |2025-02-09T08:05:35+02:00February 9, 2025|Crypto News, News|0 Comments

  • Analyst Javon Marks predicts XRP could see a price increase of 3,900%, aiming for $99.
  • Current price of XRP is around $2.41, with a potential market valuation of $5.7 trillion.
  • Historical trends suggest that XRP might repeat its 2017 rally, but caution is advised.
  • Some analysts challenge the comparison between today’s market conditions and those of 2017.
  • The XRP community is optimistic about its role in digital asset reserves and faster payment solutions.
  • Investors are encouraged to conduct thorough research due to the market’s unpredictability.

In a captivating forecast, analyst Javon Marks has set the crypto world abuzz with a bold prediction for XRP—an astronomical price surge of 3,900% this cycle! Drawing intriguing parallels to its explosive rise in 2017, Marks believes XRP is poised for a remarkable rally ahead.

Currently hovering around $2.41, the analyst envisions XRP soaring to an eye-popping $99. This target not only implies a jaw-dropping 40X increase but also a staggering market valuation potentially reaching $5.7 trillion. Reflecting on historical patterns, Marks warns that if the past repeats itself, XRP could break through its current resistance zone just as it did back in 2017.

However, not everyone is on board with this optimistic outlook. Some skeptics caution against relying on past performance, arguing that the market has undergone significant shifts. One analyst expresses doubt, claiming that trying to connect today’s trends with the dynamics of 2017 is futile.

Despite mixed opinions, the excitement surrounding XRP remains palpable, fueled by its potential inclusion in a U.S. digital asset reserve and ongoing global partnerships. Advocates are hopeful for a future where XRP serves as a faster, cheaper alternative to traditional banking systems.

Key takeaway? While the prospect of XRP reaching $99 is tantalizing, investors should tread carefully and conduct thorough research before diving in, as the market can be unpredictable. Whether you view it as a golden opportunity or a risky bet, the buzz around XRP is sure to continue!

Is XRP Set to Soar? Explore the 3,900% Price Surge Prediction!

Analyst Predictions and Market Dynamics

In exciting news for the crypto community, analyst Javon Marks has made a staggering prediction about XRP, forecasting an incredible price increase of 3,900%. Currently priced around $2.41, this projection suggests a potential surge to $99. This would not only mark a massive 40X increase but also position XRP’s total market valuation at an eye-watering $5.7 trillion.

Marks draws parallels between XRP’s current situation and its explosive rise in 2017, offering a historical lens to what might unfold in the near future. However, not everyone shares this optimistic view. Critics highlight the significant shifts in the cryptocurrency landscape since 2017, urging caution against placing too much faith in past performance as a reliable indicator.

Additional Insights on XRP

1. Use Cases: XRP has been innovatively positioned as a cryptocurrency designed for quick and cost-effective cross-border transactions, appealing greatly to financial institutions and remittance services.

2. Sustainability: XRP boasts a more energy-efficient consensus mechanism called the Ripple Protocol, which minimizes the environmental impact compared to traditional proof-of-work cryptocurrencies like Bitcoin.

3. Controversies: Like many cryptocurrencies, XRP is not without its controversies, primarily stemming from its legal battles with the SEC regarding its classification as a security. These legal matters may affect investor confidence and market performance.

The Importance of Research

Investors are encouraged to conduct comprehensive research before making decisions in this volatile market. Understanding the dynamics of cryptocurrency investments, alongside following expert analyses, can help shed light on potential opportunities and risks.

Frequently Asked Questions

Q1: What are the potential risks associated with investing in XRP?
A1: The primary risks include market volatility, regulatory uncertainties, and technological challenges. Given XRP’s ongoing legal situation with the SEC, the outcomes could greatly influence market sentiment and price.

Q2: How does XRP compare to other cryptocurrencies?
A2: Compared to Bitcoin and Ethereum, XRP offers faster transaction times and lower fees, making it competitive in the realm of digital payments. However, its centralized nature and legal issues raise concerns among some crypto purists.

Q3: What factors could influence XRP’s price in the coming years?
A3: Key influences include regulatory developments, adoption by financial institutions, partnerships, market trends, and broader economic conditions. Additionally, public sentiment and investor confidence will play significant roles.

For further reading and updates on XRP and the cryptocurrency universe, check out this link: Ripple.

Source link

9 02, 2025

The EURUSD price attempts positively – Forecast today

By |2025-02-09T06:08:07+02:00February 9, 2025|Forex News, News|0 Comments

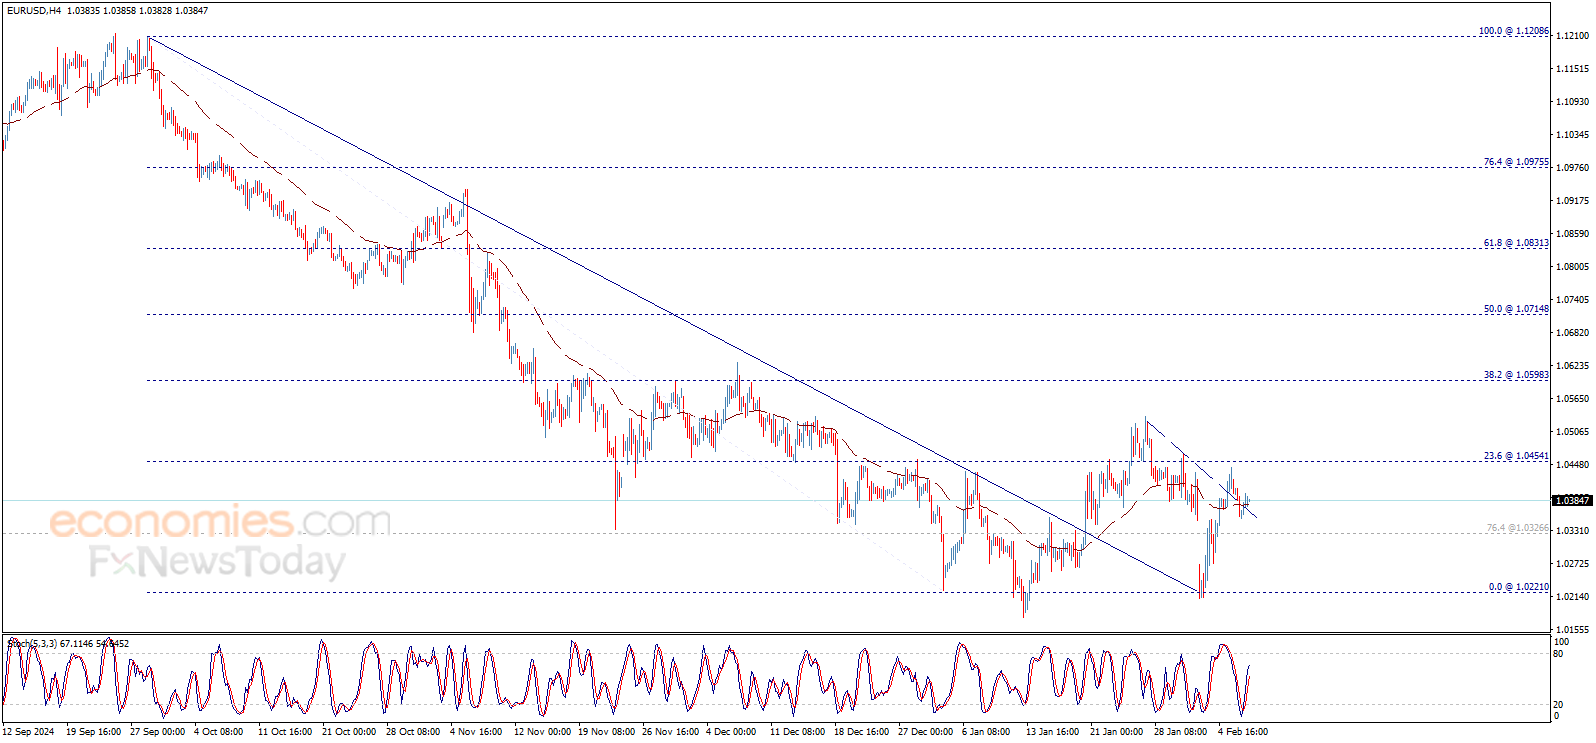
The GBPCAD price lost the positive momentum recently after reaching 1.8160 level, to activate the correctional bearish track and achieve some gains by declining towards 1.7850, approaching the additional support at 1.7800.


Note that holding within the bullish channel and the consolidation of the MA55 near the mentioned additional support line will reinforce the chances of renewing the bullish attempts, to expect rallying towards 1.7980 soon, followed by attempting to renew the pressure on 1.8070 obstacle.


The expected trading range for today is between 1.7865 and 1.7980


Trend forecast: Bullish


Source link

9 02, 2025

Could Solana Skyrocket to $520? Here’s What Experts Predict!

By |2025-02-09T06:04:55+02:00February 9, 2025|Crypto News, News|0 Comments

  • VanEck forecasts Solana’s price could reach $520 by late 2025, indicating a potential 165% increase from its current price.
  • The prediction is based on a broader market valuation projected to hit $250 billion.
  • Solana currently ranks as the fifth-largest cryptocurrency with a market cap of $94.1 billion.
  • Over the past year, Solana has seen a remarkable 102% increase in value, showcasing its resilience.
  • The rise of meme coins may positively impact Solana’s growth, presenting potential opportunities for investors.

In the wild world of cryptocurrency, price swings can feel like a rollercoaster ride, and right now, Solana has investors buzzing with excitement. US investment firm VanEck has thrown down the gauntlet, projecting that Solana’s price could skyrocket to an astonishing $520 by late 2025. With its current price hovering around $193.73, that could represent a jaw-dropping 165% increase!

Using an innovative autoregressive forecast model, VanEck believes this surge is tied to the broader market reaching a whopping $250 billion. This prediction relies on the existing 486 million tokens, implying an exciting opportunity for savvy investors looking for the next big win.

As the fifth-largest cryptocurrency by market cap, Solana has already demonstrated striking resilience—boasting a 102% rise in value over the past year and hitting a market cap of $94.1 billion. This momentum shows no sign of slowing, especially given the growing interest in meme coins. While many of these fun, hype-driven tokens capture attention, some have real utility that could benefit the entire crypto ecosystem—eventually lifting Solana on their coattails.

For investors, the takeaway is clear: as meme coins rise, so too does the potential for Solana. If the forecast holds true, climbing aboard now could lead to substantial profits in the future. Don’t miss the chance to tap into what could be a thrilling chapter in the crypto saga!

Soaring Predictions: Will Solana Really Reach $520 by 2025?

In the volatile cryptocurrency market, predictions often stir excitement among investors, and Solana (SOL) is no exception. With recent forecasts suggesting that its price may skyrocket to $520 by late 2025, the allure of this cryptocurrency has never been stronger. Here’s a closer look at what’s driving this optimism, alongside essential insights and a deeper analysis of Solana’s potential in the crypto ecosystem.

Current Insights and Trends

1. Market Dynamics: The projection from the US investment firm VanEck suggests not only a substantial increase in Solana’s value but also anticipates the broader cryptocurrency market to escalate to a total valuation of $250 billion.

2. Growing Use Case: Solana is recognized for its unique features such as high-speed transactions and lower fees compared to competitors like Ethereum. This has made it increasingly popular among developers for building decentralized applications (dApps) and non-fungible tokens (NFTs).

3. Investment Opportunities: With a current price of approximately $193.73, an anticipated rise of 165% to hit $520 positions Solana as a lucrative investment for those willing to partake in a long-term hold strategy.

Critical Questions & Answers

Q1: What are the key features that make Solana a viable investment?
A1: Solana offers remarkable transaction speeds (up to 65,000 transactions per second), very low transaction costs (around $0.00025), and a growing ecosystem of dApps. Its capability to scale effectively and support various projects (DeFi, NFTs) gives it a competitive edge.

Q2: What risks should investors consider?
A2: Cryptocurrency investing comes with inherent risks including market volatility, regulatory changes, and technological flaws. Investors should be aware of Solana’s historical outages and network congestion issues, which could affect its long-term stability and growth.

Q3: How does Solana compare to other cryptocurrencies?
A3: While Ethereum remains the market leader for smart contracts and dApps, Solana stands out due to its speed and cost-effectiveness. Other blockchains like Cardano and Binance Smart Chain also compete in the same space, but Solana’s unique technical infrastructure gives it a unique position.

Conclusion

As interest in cryptocurrencies continues to surge, particularly among speculative meme coins, Solana’s potential for significant growth is both thrilling and plausible. With strong fundamentals and growing adoption, it’s a prime candidate for investors eyeing future opportunities.

For those looking to delve deeper into the world of cryptocurrency investment and to keep abreast of the latest market shocks and innovations, consider exploring more resources at CoinDesk.

Stay informed and ready for what could be an electrifying journey in the crypto universe!

Source link

9 02, 2025

Perrysburg-based business offers natural supplements amid synthetic alternatives

By |2025-02-09T02:04:40+02:00February 9, 2025|Dietary Supplements News, News|0 Comments


Source link

9 02, 2025

ETH could hit $1,200 as Trump announces plans for reciprocal tariffs next week

By |2025-02-09T02:03:09+02:00February 9, 2025|Crypto News, News|0 Comments

Ethereum price today: $2,590

  • Ethereum bears lead the market as President Trump announces plans for reciprocal tariffs on several countries next week.
  • ETH’s decline mirrors that of the S&P 500, underscoring crypto’s rising correlation with the US stock market.
  • Ethereum could decline to $1,200 if it breaks a descending channel’s lower boundary line and the $2,150 support level fails.

Ethereum (ETH) declined 4% on Friday following United States (US) President Donald Trump’s plan to announce reciprocal tariffs on several countries next week. The move increased global trade war tensions, which has heavily weighed on the crypto market in the past week.

Ethereum faces potential sell pressure if Trump goes ahead with reciprocal tariffs

In a meeting with Japanese Prime Minister Shigeru Ishiba, President Trump highlighted that the US would impose similar tariffs that other countries place on US goods, according to Reuters.

“I’ll be announcing that next week, reciprocal trade, so that we’re treated evenly with other countries,” said Trump.

The crypto market reacted negatively to the news, with the total market capitalization dropping over 3%. Ethereum led the losses among top cryptos, shedding over 4% of its value.

A similar decline was visible in the traditional stock market, with the S&P 500 dropping by 75 points after the announcement. This underscores the growing positive correlation between cryptocurrencies and the US stock market.

The tensions of a global trade war date back to President Trump’s announcement of tariffs on Mexico, Canada and China last Friday.

Both crypto and stocks plunged sharply when the market opened on Monday. Ethereum dropped nearly 30% before seeing a quick recovery after Trump reached a resolution with Mexico and Canada to pause the intended tariffs.

If Trump moves ahead with the reciprocal tariff plan next week, it could increase bearish sentiment in the crypto market, with Ethereum potentially being heavily affected, as it had shown in the past few days.

Meanwhile, Ethereum ETFs have outperformed Bitcoin ETFs in the past week following increased buying pressure from BlackRock. BTC ETFs have seen just $32.5 million in net inflows since the beginning of the week, whereas ETH ETFs recorded net inflows of over $420 million in the same period, per Coinglass data.

Ethereum Price Forecast: ETH could decline to $1,200 if it breaks a descending channel support

Ethereum saw $65.43 million in futures liquidations in the past 24 hours, per Coinglass data. The total amount of long and short liquidations accounted for $48.28 million and $17.15 million, respectively.

On the daily chart, Ethereum is testing the lower boundary line of a descending channel after seeing a rejection near the $2,817 level. A high volume close below this channel could send ETH toward the $1,200 level if the support level near $2,150 fails.

ETH/USDT daily chart

On the upside, ETH could rally to test the descending channel’s upper boundary resistance line if it bounces off the lower boundary support line. A breakout above the channel could spark an ETH rally to $4,500.

Meanwhile, the rectangular channel between $2,817 and $2,150 could prove crucial as ETH moved range-bound in this zone between early August and early November. If ETH continues seeing a rejection near $2,817, it could likely pull off a similar consolidation move.

The Relative Strength Index (RSI) and Stochastic Oscillator (Stoch) momentum indicators are below their neutral levels, indicating dominant bearish momentum.

Ethereum FAQs

Ethereum is a decentralized open-source blockchain with smart contracts functionality. Its native currency Ether (ETH), is the second-largest cryptocurrency and number one altcoin by market capitalization. The Ethereum network is tailored for building crypto solutions like decentralized finance (DeFi), GameFi, non-fungible tokens (NFTs), decentralized autonomous organizations (DAOs), etc.

Ethereum is a public decentralized blockchain technology, where developers can build and deploy applications that function without the need for a central authority. To make this easier, the network leverages the Solidity programming language and Ethereum virtual machine which helps developers create and launch applications with smart contract functionality.

Smart contracts are publicly verifiable codes that automates agreements between two or more parties. Basically, these codes self-execute encoded actions when predetermined conditions are met.

Staking is a process of earning yield on your idle crypto assets by locking them in a crypto protocol for a specified duration as a means of contributing to its security. Ethereum transitioned from a Proof-of-Work (PoW) to a Proof-of-Stake (PoS) consensus mechanism on September 15, 2022, in an event christened “The Merge.” The Merge was a key part of Ethereum’s roadmap to achieve high-level scalability, decentralization and security while remaining sustainable. Unlike PoW, which requires the use of expensive hardware, PoS reduces the barrier of entry for validators by leveraging the use of crypto tokens as the core foundation of its consensus process.

Gas is the unit for measuring transaction fees that users pay for conducting transactions on Ethereum. During periods of network congestion, gas can be extremely high, causing validators to prioritize transactions based on their fees.


Source link

9 02, 2025

GBP/USD Weekly Forecast: Pound Finds Breather on Tariff Relief

By |2025-02-09T00:04:37+02:00February 9, 2025|Forex News, News|0 Comments

  • The dollar collapsed when a 25% tariff meant for Canada and Mexico failed to take off.
  • The Bank of England lowered borrowing costs.
  • Data on Friday showed a mixed picture of the US labor sector.

The GBP/USD weekly forecast indicates a brief respite for the pound as Trump’s policies weaken the dollar.

Ups and downs of GBP/USD 

The GBP/USD pair had a bullish week despite a rate cut by the Bank of England. The rally came from a decline in the dollar after Trump paused tariffs on Canadian and Mexican goods. 

–Are you interested in learning more about STP brokers? Check our detailed guide-

On Tuesday, the dollar collapsed when a 25% tariff meant for Canada and Mexico failed to take off. The two countries negotiated better trade deals, giving them more time. Meanwhile, the Bank of England lowered borrowing costs but emphasized the need for caution due to high inflation. Finally, data on Friday showed a mixed picture of the US labor sector, with both jobs and the unemployment rate easing.

Next week’s key events for GBP/USD

GBP/USD Weekly Forecast: Pound Finds Breather on Tariff Relief

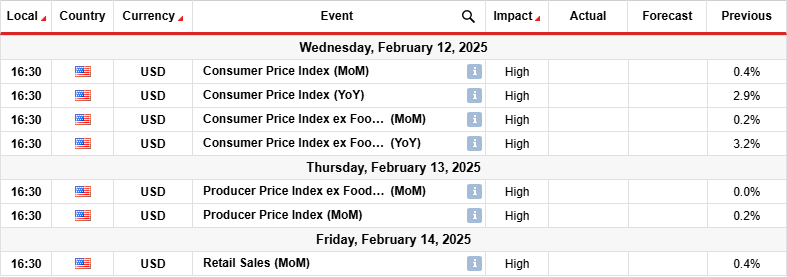
Next week, market participants will focus on inflation and retail sales data from the US. Meanwhile, the UK will release figures on manufacturing production and GDP. The US consumer inflation report will shape the outlook for Fed rate cuts. 

In the previous month, the core CPI figure missed forecasts, indicating soft underlying price pressures. As a result, the dollar fell as rate cut expectations rose. Another month of cooler-than-expected inflation might further weigh on the dollar. 

Meanwhile, the UK GDP report will show the state of the UK economy, which has been slowing down. 

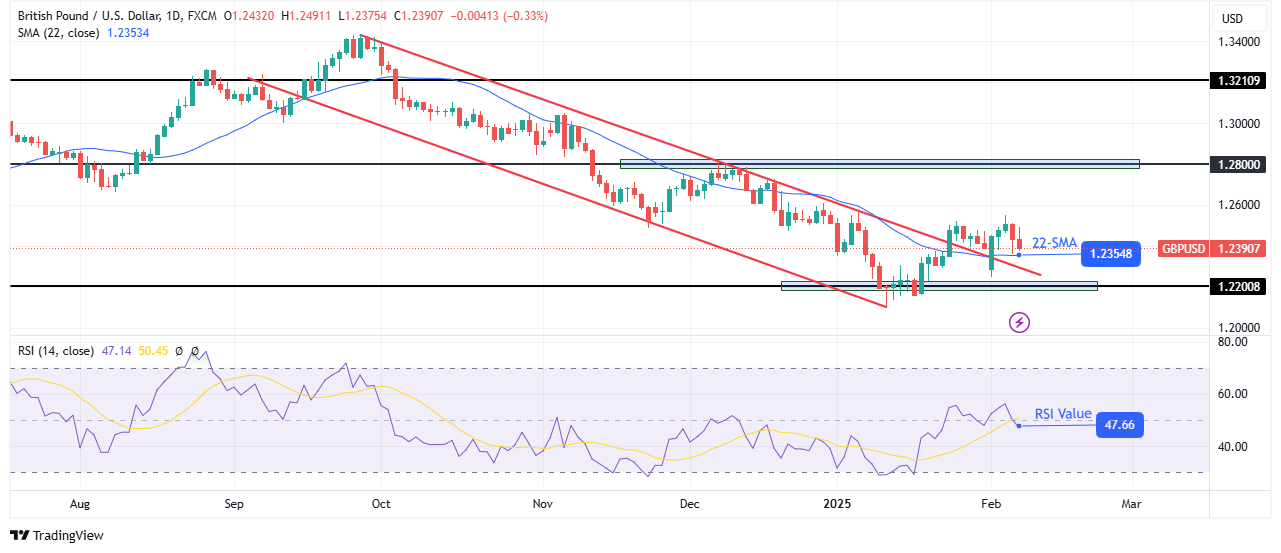
GBP/USD weekly technical forecast: Price briefly retreats after channel breakout

GBP/USD weekly technical forecastGBP/USD weekly technical forecast
GBP/USD daily chart

On the technical side, the GBP/USD price has broken out of its bearish channel, indicating a bullish shift in sentiment. The price now trades slightly above the 22-SMA, showing bulls are in the lead. However, the RSI remains slightly below 50, a sign that bearish momentum is still strong. 

–Are you interested in learning more about making money with forex? Check our detailed guide-

GBP/USD has maintained a strong downtrend, making lower highs and lows and breaking past key support levels. However, bears paused when the price hit the 1.2200 support level. Here, price action showed small-bodied candles with large wicks, indicating indecision. 

After that, bulls took charge by breaking above the channel resistance and the 22-SMA resistance. The price is currently retesting the SMA as support. If bulls remain in the lead, the price will climb to the 1.2800 resistance. A break above this resistance would confirm a new bullish trend.

Looking to trade forex now? Invest at eToro!

68% of retail investor accounts lose money when trading CFDs with this provider. You should consider whether you can afford to take the high risk of losing your money.

Source link

9 02, 2025

XRP Price Prediction: Break Resistance At $2.81 Trigger a Bullish Surge?

By |2025-02-09T00:02:27+02:00February 9, 2025|Crypto News, News|0 Comments

XRP price holds a crucial level needed to form bullish patterns. The 21-period Exponential Moving Average functions as a significant obstacle at $2.67.

A breakout crossing above this resistance mark would serve as a heavyweight indicator in establishing bullish short-term market sentiment.

A breach of this price point by buyers creates an opportunity to transform market dynamics in an upward direction.

Over time, the XRP price has reached stability through its trend direction using the essential 21 EMA dynamic support and resistance indicator.

A price unable to sustain positions above the indicator suggests increased probabilities for additional price declines or prolonged horizontal movements.

Future market movements will demonstrate whether the XRP price maintains a level of buyer support above this critical resistance.

– Advertisement –

Resistance at $2.81 Remains a Key Barrier for Further Gains

Market Analyst Egrag Crypto notes that the significant resistance level for the XRP price exists at $2.81 where it intersects the 0.702 Fibonacci retracement level.

Current trading sessions have repeatedly tested this resistance level and it remains unbroken.

A sustained rally above the current resistance would demonstrate rising bullish momentum to attract new buyer participation.

Source: X

More so, a successful break above $2.81 will enable XRP price to progress toward higher price points with $2.96 establishing the following main resistance level.

Price action can be influenced by this technical barrier located at the 0.786 Fibonacci retracement level.

The cryptocurrency will continue its upward trend and retest previous high levels when it surpasses these resistance points.

Potential Scenarios If XRP Price Fails to Hold Above $2.67

However, the failure of the XRP price to stay above the $2.67 mark at the 21 EMA will significantly boost the chances of market consolidation or additional price decline.

The cryptocurrency likely will challenge lower support zones starting from the 0.5 Fibonacci retracement level at $2.45 under current circumstances.

A price decline beyond $2.45 would expose the 0.382 Fibonacci retracement at $2.27.

XRP price movement depends strongly on both market sentiment and trading volume activity.

A shortage of buyers pushing the price at critical support zones may continue to sustain a consolidation pattern between $2.00 and $2.67.

Developed buying momentum from these price levels might build a foundation to challenge existing resistance levels.

Meanwhile, supporting a bullish breakout, recent analysis highlights XRP consolidation below $3 as a precursor to price movement, potentially reaching $5.85 in the next wave per Elliott Wave theory.

Key support levels at $2.36–$2.55 and favorable developments in the SEC lawsuit could propel XRP toward its $8 target.

Source link

8 02, 2025

USD/JPY Weekly Forecast: BoJ Rate Hike Bets Boost Yen

By |2025-02-08T21:24:23+02:00February 8, 2025|Forex News, News|0 Comments

  • Japan released data showing solid wage growth.
  • A pause in US tariffs weakened the greenback.
  • US employment figures revealed a drop in job growth and lower unemployment.

The USD/JPY weekly forecast is bearish amid increasing bets for a Bank of Japan rate hike, boosting the yen.

Ups and downs of USD/JPY

The USD/JPY pair ended the week lower as the yen rallied against the dollar due to a surge in BoJ rate hike expectations. At the same time, a pause in US tariffs weakened the greenback. 

–Are you interested in learning more about STP brokers? Check our detailed guide-

BoJ rate hike bets rose after Japan released data showing solid wage growth. 

Meanwhile, the dollar eased as market participants became more convinced that Trump’s tariffs were just a negotiation tactic. He paused tariffs on Canada and Mexico, plunging the dollar. Additionally, employment figures revealed a drop in job growth and lower unemployment, painting a mixed picture of the labor sector.

Next week’s key events for USD/JPY

USD/JPY Weekly Forecast: BoJ Rate Hike Bets Boost Yen

Next week, traders will focus on data from the US, including consumer inflation, producer inflation and retail sales. The inflation figures will show the state of price pressures, shaping the outlook for Fed rate cuts. 

Last month, inflation came in at 2.9%, nearing the Fed’s 2% target. However, policymakers have remained cautious because it has paused near this level. As a result, the central bank has been waiting for more progress before signaling further rate cuts. Meanwhile, the retail sales report will show the state of consumer spending in the US.

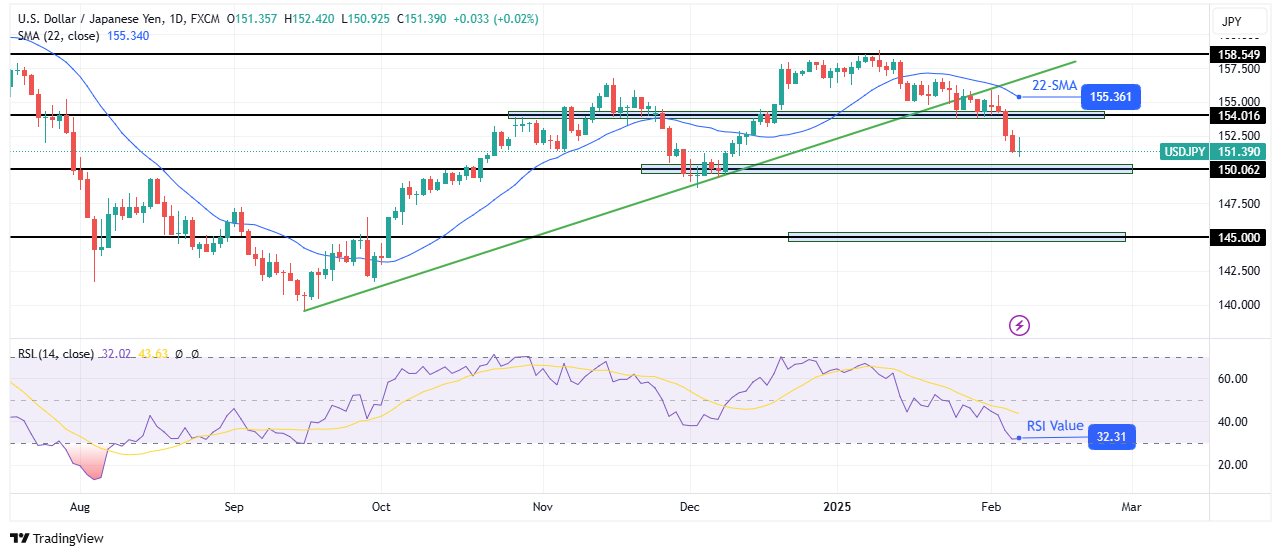
USD/JPY weekly technical forecast: Price targets the 150.06 support

USD/JPY weekly technical forecastUSD/JPY weekly technical forecast
USD/JPY daily chart

On the technical side, the USD/JPY price is approaching the 150.06 support level after breaking below its bullish trendline. The price trades far below the 22-SMA, showing a strong lead for bears. At the same time, the RSI trades near the oversold region, indicating solid bearish momentum. 

–Are you interested in learning more about making money with forex? Check our detailed guide-

Bulls paused the previous move when the price got to the 158.54 resistance level. Moreover, although the price made higher highs and lows, it broke below the 22-SMA, indicating a corrective move. At the same time, the RSI failed to enter the overbought region, a sign that either bulls were holding back, or bears were strong too. 

After the corrective move, USD/JPY might make an impulsive leg. Therefore, the price might break below the 150.06 support to reach the 145.00 support. However, the price might retest the 22-SMA as resistance before continuing lower.

Looking to trade forex now? Invest at eToro!

68% of retail investor accounts lose money when trading CFDs with this provider. You should consider whether you can afford to take the high risk of losing your money.

Source link

8 02, 2025

Dogecoin Open Interest Jumps 9.2 Billion in 24 Hours, What Next for DOGE Price?

By |2025-02-08T21:20:51+02:00February 8, 2025|Crypto News, News|0 Comments

With the signs of recovery in the broader digital currency ecosystem, Dogecoin (DOGE) is seeing a gradual surge in its open interest data. Per data from CoinGlass, the Dogecoin open interest is paring off its losses in the past 24 hours. Now pegged at 9.16 billion DOGE in committed assets by futures traders, this metric is up 1.06% in the past four hours.

Dogecoin open interest and exchange impact

That more than $2.2 billion was committed to futures trading remains complementary to the renewed interest in Dogecoin after the epic market slowdown. The interest in top exchanges like Gate.io, Binance, Bybit, Bitget and OKX aligns with the sentiment that the DOGE breakout might be close.

Related

Gate.io harbors DOGE whales with the largest exposure in the futures market; $754.73 million worth of DOGE was committed, 32.9% of the market share. On Binance, more than 2.24 billion DOGE were registered in open interest, a figure worth $559.28 billion.

Bybit, Bitget and OKX are 1.57 billion, 914.15 million and 347.57 million DOGE, respectively. With the level of exposure amid a bearish market outlook, there is evidence that investors are optimistic about the future of the top meme coin.

What next for DOGE price?

At the time of writing, the price of Dogecoin was changing hands for $0.2498, down 3.07% in 24 hours. The coin is battling to stay afloat after sharp volatility pulled it down from its 30-day high of $0.4335. Should the open interest figures gain momentum, DOGE might be forced to decouple from Bitcoin (BTC).

Related

Dogecoin Creator Reveals Plans for Near Future — Is He Writing DOGE Book?

Against the claims that the uptrend for Dogecoin might be over, the anticipated DOGE ETF product will likely reboot price rallies in the coming months, depending on how events shape up around the product between issuers and the U.S. SEC.

Source link

8 02, 2025

Analysis of NFT Market Trends by Kekalf, The Green | Flash News Detail

By |2025-02-08T20:40:48+02:00February 8, 2025|News, NFT News|0 Comments


On February 8, 2025, at 14:35 UTC, a tweet by Kekalf, The Green (@NFT5lut) highlighted concerns regarding the mental stability of an individual known as ‘hb’ (source: X post, February 8, 2025, 14:35 UTC). This event, although seemingly unrelated to cryptocurrency, triggered significant market movements due to the involvement of ‘hb’ in various cryptocurrency projects. At 14:45 UTC, Bitcoin (BTC) saw a sudden drop of 2.5% to $45,678 from $46,850, as reported by CoinMarketCap (source: CoinMarketCap, February 8, 2025, 14:45 UTC). Ethereum (ETH) followed suit, declining by 3% to $3,200 from $3,299 (source: CoinMarketCap, February 8, 2025, 14:45 UTC). The trading volume for BTC surged to $30 billion within 15 minutes, indicating heightened market sensitivity to the news (source: CoinMarketCap, February 8, 2025, 14:45 UTC – 15:00 UTC). Similarly, ETH’s trading volume increased to $15 billion during the same period (source: CoinMarketCap, February 8, 2025, 14:45 UTC – 15:00 UTC). These movements were not isolated to major cryptocurrencies; smaller tokens like Chainlink (LINK) and Cardano (ADA) also experienced volatility, with LINK dropping by 4% to $22.50 and ADA falling by 3.5% to $0.60 (source: CoinMarketCap, February 8, 2025, 14:45 UTC).

The trading implications of this event were profound. The sudden drop in BTC and ETH prices led to a surge in short selling, with the short interest on BTC reaching 12% of the total market cap within an hour of the tweet (source: Skew Analytics, February 8, 2025, 15:45 UTC). This increase in short interest was accompanied by a spike in options trading, with the put/call ratio for BTC options rising to 1.5, indicating a bearish market sentiment (source: Deribit, February 8, 2025, 15:30 UTC). The fear and uncertainty also led to a significant withdrawal of funds from decentralized exchanges (DEXs), with Uniswap V3 seeing a 10% decrease in total value locked (TVL) from $5.5 billion to $4.95 billion (source: DeFi Pulse, February 8, 2025, 16:00 UTC). This event underscores the interconnectedness of social media narratives and cryptocurrency market dynamics, where even seemingly unrelated events can cause substantial price movements and trading volume changes.

Technical indicators following the tweet revealed a bearish trend across various assets. The Relative Strength Index (RSI) for BTC dropped from 60 to 45 within 30 minutes, signaling an oversold condition (source: TradingView, February 8, 2025, 15:15 UTC). Similarly, ETH’s RSI fell from 55 to 40, further confirming the bearish sentiment (source: TradingView, February 8, 2025, 15:15 UTC). The Moving Average Convergence Divergence (MACD) for both BTC and ETH showed a bearish crossover, with the MACD line crossing below the signal line at 15:00 UTC (source: TradingView, February 8, 2025, 15:00 UTC). The trading volume for BTC remained elevated at $25 billion for the next hour, suggesting continued market interest and potential for further volatility (source: CoinMarketCap, February 8, 2025, 15:00 UTC – 16:00 UTC). The on-chain metrics also reflected the market’s reaction, with the number of active addresses for BTC increasing by 15% to 1.2 million, indicating heightened market participation (source: Glassnode, February 8, 2025, 15:30 UTC).

In the context of AI-related news, this event did not directly involve AI developments. However, the market’s reaction to the tweet can be compared to how AI-driven trading algorithms might respond to similar events. AI algorithms, which often rely on sentiment analysis and real-time data processing, would likely have detected the increased negative sentiment and adjusted trading strategies accordingly. For instance, AI-driven trading bots might have increased short positions on BTC and ETH, contributing to the observed price drops. The correlation between AI-driven trading volumes and this event could be analyzed by examining the trading patterns of known AI trading platforms like QuantConnect and TradeRiser. On February 8, 2025, from 14:45 UTC to 16:00 UTC, QuantConnect reported a 20% increase in trading volume, primarily in BTC and ETH short positions (source: QuantConnect, February 8, 2025, 16:00 UTC). Similarly, TradeRiser’s trading volume surged by 18% during the same period, with a noticeable shift towards bearish positions (source: TradeRiser, February 8, 2025, 16:00 UTC). This suggests that AI-driven trading algorithms played a significant role in amplifying the market’s reaction to the tweet. Furthermore, the sentiment analysis conducted by AI platforms like Sentifi showed a 30% increase in negative sentiment towards cryptocurrencies within 30 minutes of the tweet (source: Sentifi, February 8, 2025, 15:15 UTC), further illustrating the potential influence of AI on market dynamics.


Source link

Go to Top