About Editorial team of BIPNs

Main team of content of bipns.com. Any type of content should be approved by us.
9 03, 2026

Platinum price rebounds from the barrier– Forecast today – 9-3-2026

By |2026-03-09T12:00:17+02:00March 9, 2026|Forex News, News|0 Comments


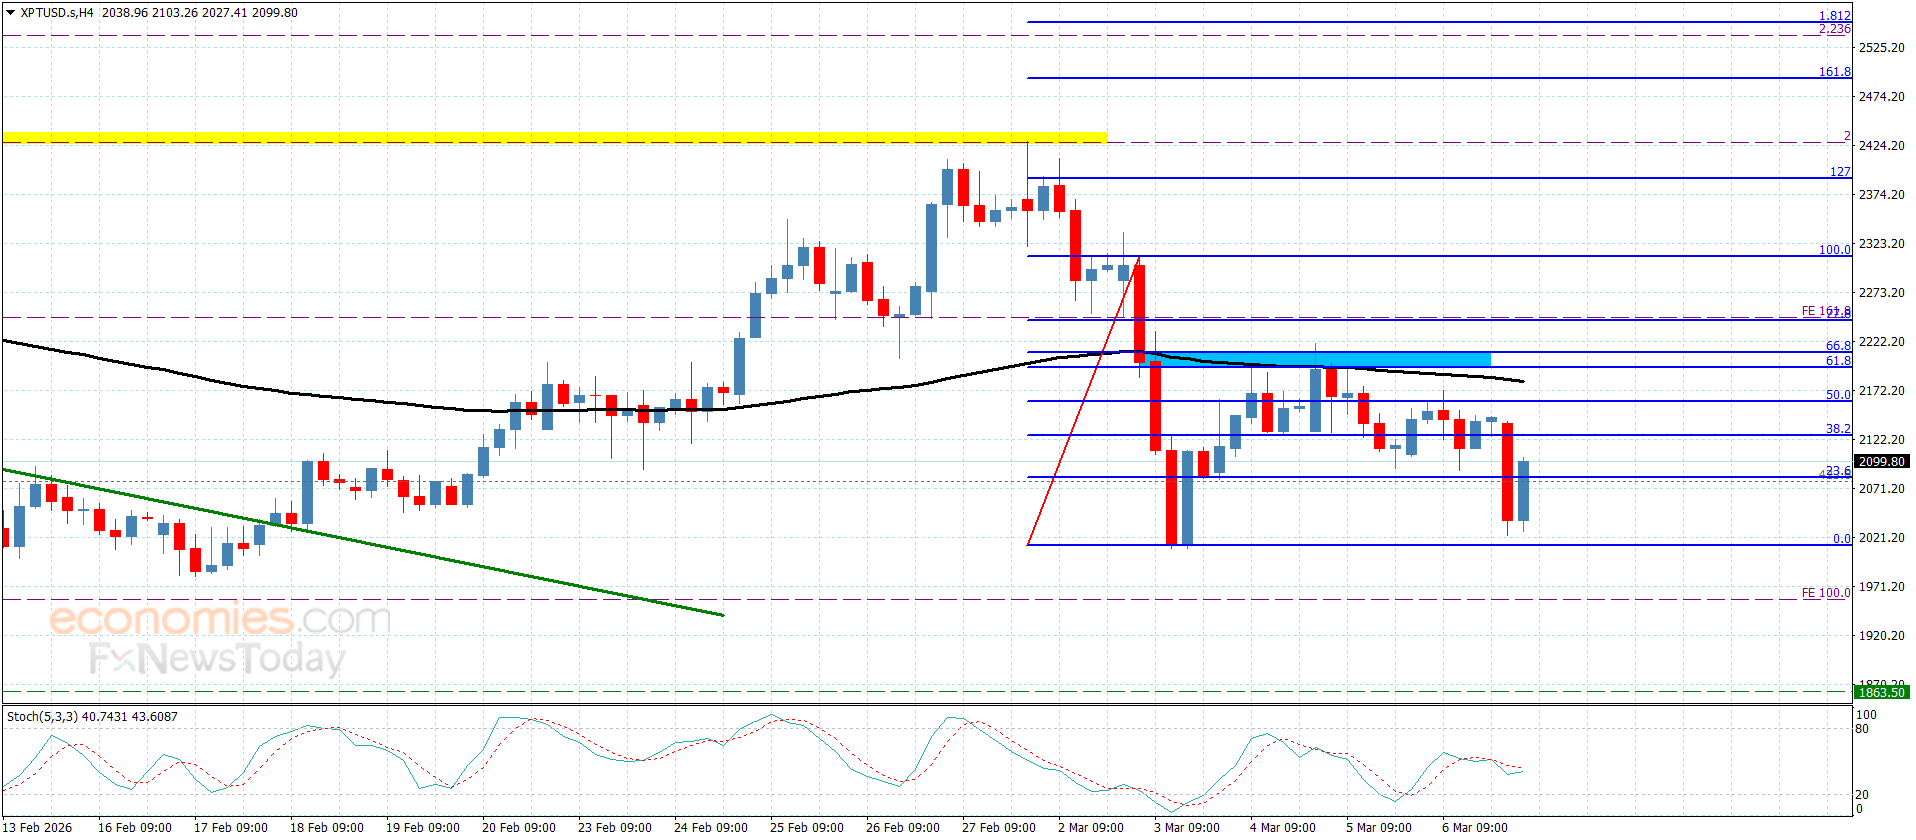
Platinum price formed a new bearish attack with the beginning of today’s trading, to approach from the targeted obstacle near $2010.00, which forced it to form bullish corrective rebound, to settle near $2100.00.


The bullish corrective rebound will not threaten the main bearish trend, depending on the main stability below $2210.00, besides the continuation of providing negative momentum by the main indicators, therefore, we will keep the bearish attempts in the current period, which might target 2040.00 and 2010.00 level.


The expected trading range for today is between $2010.00 and $2150.00


Trend forecast: Bearish


Source link

9 03, 2026

Trading range breakout favors bulls amid Iran war

By |2026-03-09T11:53:21+02:00March 9, 2026|Forex News, News|0 Comments

The USD/JPY pair scales higher for the third consecutive day and climbs to the 159.00 neighborhood, or its highest level since January 23 at the start of a new week. The Japanese Yen (JPY) continues with its underperformance as the recent surge in Crude Oil prices threatens to weaken economic growth. This, along with a broadly firmer US Dollar (USD), turns out to be another factor pushing the currency pair higher.

The joint US-Israeli campaign against Iran enters its tenth day on Monday, with no signs of an end to hostilities. Meanwhile, Iran named Ayatollah Ali Khamenei’s son, Mojtaba Khamenei, as the new Supreme Leader, signaling hardliners remain firmly in charge. US President Donald Trump said the appointment would be unacceptable and suggested the US should have a role in choosing Iran’s next supreme leader. This raises the risk of a prolonged war, which triggered a massive intraday rally of over 25% in Crude Oil prices on Monday.

Meanwhile, surging energy prices could drive up inflation and would create a classic stagflationary environment, complicating the Bank of Japan’s (BoJ) normalization efforts and weighing heavily on the JPY. The USD, on the other hand, benefits from its unmatched status as the global reserve currency. Moreover, inflation concerns dim the prospects for near‑term rate reductions by the US Federal Reserve (Fed) and remain supportive of a further rise in US Treasury bond yields. This provides an additional boost to the USD and the USD/JPY pair.

Meanwhile, spot prices have now moved closer to the levels when authorities conducted a series of rate checks earlier this year, keeping the risk of actual market intervention. This, in turn, holds back the JPY bears from placing aggressive bets and caps the upside for the USD/JPY pair. Nevertheless, the aforementioned fundamental backdrop suggests that the path of least resistance for the currency pair remains to the upside. Hence, any meaningful corrective pullback might still be seen as a buying opportunity and is more likely to remain cushioned.

Traders now look forward to Japan’s revised Q4 Gross Domestic Product (GDP) report, which will be released on Tuesday and is expected to show that the economy expanded at a faster pace of 0.3% against the preliminary reading of 0.1%. Apart from this, the latest US consumer inflation figures on Wednesday will influence the USD demand and provide a fresh impetus to the USD/JPY pair. The focus, however, will remain glued to geopolitical developments, which might continue to infuse volatility in the financial markets and drive the currency pair.

USD/JPY 4-hour chart

Technical Analysis:

The USD/JPY pair retains a mildly bullish near-term bias following a sustained breakout above a one-week-old trading range resistance near the 158.00 mark. Moreover, the Moving Average Convergence Divergence (MACD) histogram has turned marginally positive while the MACD line hovers close to the signal line just above the zero mark, hinting at improving but still moderate upside momentum. Adding to this, the Relative Strength Index around 64 stays below overbought territory, indicating buyers keep control without yet showing signs of exhaustion.

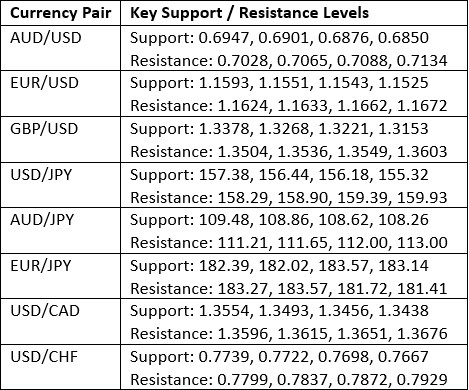
Immediate support emerges at the 158.00 trading range resistance breakpoint, with a deeper floor at 157.30 that guards the recent higher low area. A break below 157.30 would weaken the bullish bias and expose the 156.80 region as the next downside focus. On the topside, initial resistance appears at 158.90, the latest swing high, followed by 159.50, where an extension of the current move would encounter a more significant barrier. A sustained move above 158.90 would open the path toward 159.50, reinforcing the upside scenario in the 4-hour picture.

(The technical analysis of this story was written with the help of an AI tool.)

Source link

9 03, 2026

XAG/USD Faces Critical Test As Bears Target Pivotal $80.00 Support Level

By |2026-03-09T07:59:46+02:00March 9, 2026|Forex News, News|0 Comments


Silver Price Forecast: XAG/USD Faces Critical Test As Bears Target Pivotal $80.00 Support Level


Source link

9 03, 2026

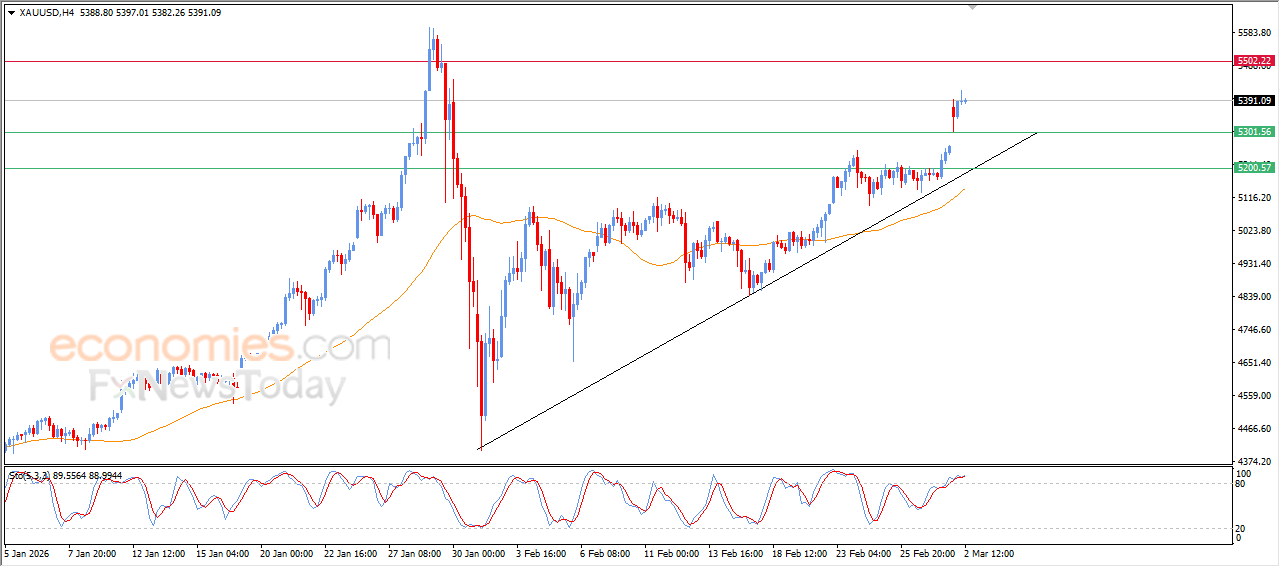
Forecast update for gold -02-03-2026.

By |2026-03-09T03:58:05+02:00March 9, 2026|Forex News, News|0 Comments


Coffee price kept its stability above 275.80 support until this moment, attempting to find a chance to reduce the losses, farming sideways waves by its fluctuation near 280.00 level.


The price needs new bullish momentum, reinforcing the chances of beginning recovering the losses, to expect its rally towards 293.50 directly, to press on the barrier at 301.00, while the decline below the current support will confirm the continuation of the negativity in the upcoming trading, expecting the next negative target at 264.80 level.


The expected trading range for today is between 275.00 and 293.50


Trend forecast: Bullish


Source link

8 03, 2026

Oil Price Forecast: Crude Above $90 as Middle East Conflict Escalates — Is $150 Oil Next?

By |2026-03-08T19:56:21+02:00March 8, 2026|Forex News, News|0 Comments


Forced Production Cuts Across the Gulf

According to Wall Street Journal, the United Arab Emirates and Kuwait had begun to curb oil production as the closure of the Strait of Hormuz affects the flow of supplies and fills storage facilities. Abu Dhabi National Oil Co. said it is managing offshore production levels to deal with storage requirements. Kuwait Petroleum Corp. also cut output at oil fields and refineries after Iranian threats against safe passage through Hormuz.

Kuwait started to reduce output by some 100,000 barrels per day early Saturday. The reduction is nearly triple on Sunday. This implies that cuts may be up to around 300,000 barrels per day or higher depending on storage levels and the situation around Hormuz.

Kuwait produced about 2.57 million barrels per day in January and relies completely on the Strait of Hormuz for exports. This is a heavy dependence that makes the country vulnerable as there are not many alternative routes from where shipments can come.

The UAE is in a better position but is still facing pressure. The country produced more than 3.5 million barrels per day in January as OPEC’s third largest producer. It is able to bypass Hormuz via a 1.5 million barrel per day pipeline to Fujairah on the western coast and also take advantage of international storage facilities.

Disruptions are spreading in the region. Iraq has begun to withhold production for storage tank saturation. Saudi Arabia shut its largest refinery and Qatar closed the world’s largest liquefied natural gas export plant after drone attacks. Saudi Arabia has diversified some of its crude exports to Yanbu on the Red Sea but this route is not capable of completely replacing exports that usually pass through the Strait of Hormuz.

Inflation Risks Rise as Oil Shock Hits the Global Economy

The current supply shock is already having an impact on consumers all over the world. Asian refiners are beginning to report shortages as shipments from the Gulf slow down. When there are fewer cargoes available to the market, refiners must scale down operations or seek out other supplies. This situation makes energy more expensive not only for businesses but also for households.

Strong Economic Growth Increases Inflation Pressure

At the same time, the global economy is still showing signs of growth. This causes inflationary effect of higher oil prices to be stronger as energy demand is still firm. The ISM Manufacturing PMI is 52.4% which signifies mild expansion of industrial sector.


Source link

8 03, 2026

Oil Prices Surge 3.7% as U.S.-Iran Standoff Triggers Higher 2026 Forecasts

By |2026-03-08T15:55:13+02:00March 8, 2026|Forex News, News|0 Comments


Economists and oil market analysts have hiked their oil price forecasts for 2026 amid rising geopolitical tensions and heightened war premium due to the U.S.-Iran standoff. 

Both crude oil benchmarks are now expected to average above $60 per barrel this year, with price forecasts higher by about $1.50 per barrel compared to a month ago, the monthly Reuters poll showed on Friday. 

Despite ongoing concerns about an oversupplied market, the 34 analysts and economists surveyed by Reuters in February raised their projections in view of uncertainties in how the Iran crisis would unfold in the coming weeks and months. 

In the February poll, Brent Crude prices are expected to average $63.85 per barrel in 2026. This month’s estimate is higher compared to the January forecast of $62.02.

The analysts in the poll expect the U.S. benchmark, WTI Crude, to average above $60 per barrel this year, too—at $60.38 a barrel, up from $58.72 expected in January.    

Year to date, Brent price have averaged $70.48 per barrel and WTI – $65.01 a barrel. 

Early on Friday, both benchmarks were trading 3% higher, with Brent near $73 and WTI at $67, after the United States and Iran adjourned the Thursday talks with plans for another round of negotiations next week.  

Oman’s Foreign Minister, Badr Albusaidi, who was mediating the indirect talks in Geneva, said the parties had made “significant progress” in the nuclear talks. Next week, negotiations are set to be held in Vienna, Austria.   

It is the ongoing U.S.-Iran standoff that has been the main driver of oil analysts in the Reuters poll to raise their oil price forecasts for this year. 

Currently, the geopolitical risk premium already baked in the price of oil is about $4-$10 per barrel, analysts say.  

The war premium, the OPEC+ supply policy, and the fundamentals in supply-demand balances will steer the direction of oil prices this year, they note.  

By Michael Kern for Oilprice.com    

More Top Reads From Oilprice.com


Source link

8 03, 2026

Weekly Forex Forecast – 9th to 13th March 2026 (Charts)

By |2026-03-08T15:47:35+02:00March 8, 2026|Forex News, News|0 Comments

Full-scale war over Iran in the Middle East has pushed energies to multi-year highs and helped strengthen safe havens such as the US Dollar and Gold.

I wrote on the 1st March that the best trades for the week would be:

  1. Long of Gold following a daily (New York) close above $5,418.55. This did not set up.

  2. Short of Bitcoin following a daily (New York) close below $61,000 targeting $50,000. This did not set up either.

A summary of last week’s most important data in the market:

  1. US Average Hourly Earnings – this was a fraction higher than expected, showing a month-on-month increase of 0.4% compared to a widely anticipated 0.3%, weakening the case for rate cuts.

  2. US Non-Farm Employment Change – this was considerably worse than expected, by approximately 150k jobs, strengthening the case for rate cuts.

  3. US Retail Sales – this was just a tick higher than expected, but it was still a negative rate.

  4. US ISM Services PMI – this was much better than expected.

  5. Australian GDP – the Australian economy grew by 0.8% last quarter, while growth of only 0.7% was expected, giving a slight boost to the prospect of rate hikes.

  6. UK Annual Budget – no surprises.

  7. US Unemployment Rate – unexpectedly ticked higher from 4.3% to 4.4%.

  8. US Unemployment Claims – this was approximately as expected.

The only significant effects last week’s economic data had was a hawkish tilt on the USD, with the CME FedWatch tool now showing the market is pricing in only one further rate cut in 2026, a cut of 0.25% in September.

The week was really dominated by the ongoing war between Israel/USA and Iran, with several US-friendly countries near Iran being attached by Iran, although the attacks are mostly aimed at US bases. Some of Iran’s neighbours have retaliated or claimed to have done so, notably Qatar and the UAE.

It seems clear that the US and Israel basically have achieved air superiority in the skies of Iran and intend to systematically demolish the Islamic Republic and its military capabilities, with a focus on its ballistic missiles and nuclear program. From the point of view of Israel and the USA, the war can be said to be proceeding very successfully.

It seems clear that this war is going to last for a few weeks, maybe even as long as six weeks, and that a surrender by the regime remains unlikely, at least for time being.

Hezbollah, Iran’s proxy in Lebanon, joined the war on day 3 by firing on Israel. It is pretty clear Hezbollah also fired drones at a sovereign British base in Cyprus, which is an attack on NATO and the EU, although very little is being done about it.

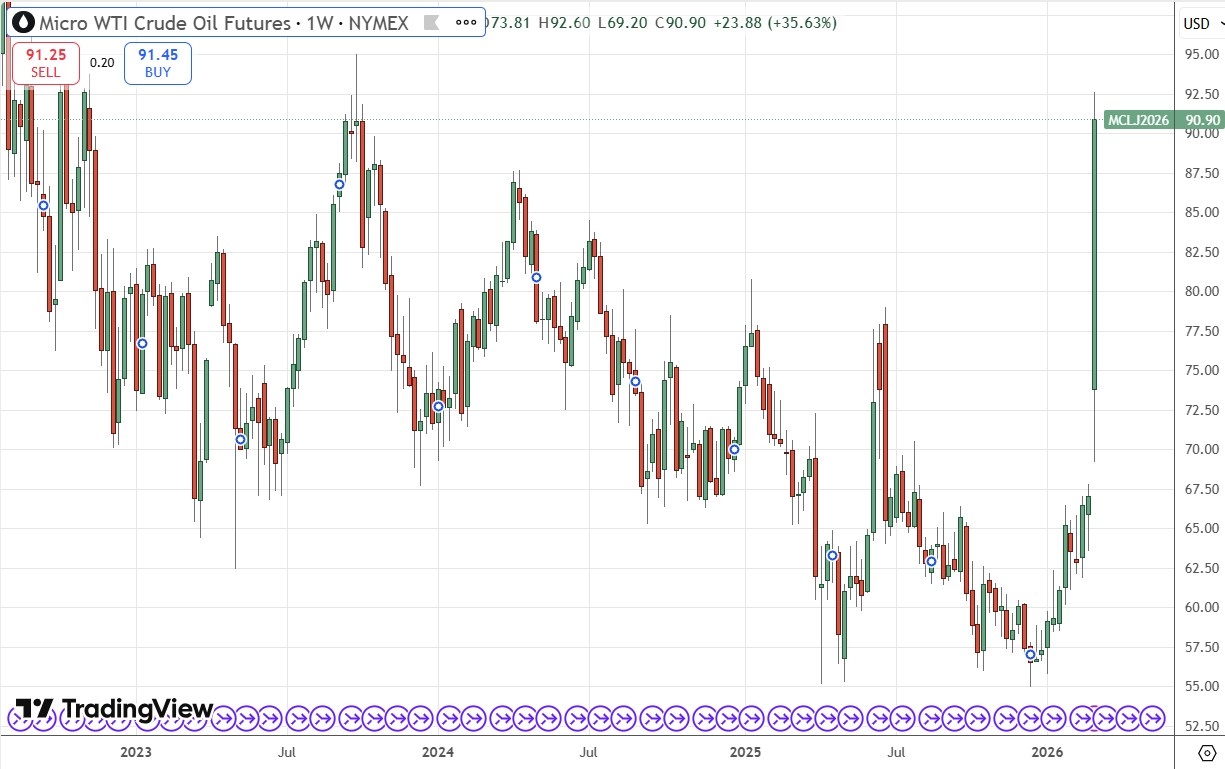
Most notably for the markets, traffic has almost completely stopped passing through the trait of Hormuz, and although there are sufficient stockpiles to last a few weeks, we are seeing the price of crude oil and crude oil related products jump to long-term highs, with WTI surpassing $90 per barrel on Friday. It may be that the US administration had hoped the price would not rise so far so quickly, but these high crude oil prices could feed into other aspects of the economy and start to bring stock markets lower.

The coming week’s most important data points, in order of likely importance, are:

  1. USA CPI (inflation)

  2. US Core PCE Price Index

  3. US Preliminary GDP

  4. US JOLTS Job Openings

  5. US Unemployment Claims

  6. UK GDP

  7. Canada Unemployment Rate

Currency Price Changes and Interest Rates

For the month of March, I make no monthly Forex forecast as the US Dollar is not in a clear trend right now.

Last week saw no currency crosses with excessive volatility, so I am making no forecast for the coming week.

The US Dollar was the strongest major currency last week, while the Euro was the weakest. Directional volatility increased last week, with 41% of all major pairs and crosses changing in value by more than 1%.

Next week’s volatility is likely to remain high due to the few but highly significant data releases scheduled and the ongoing war in the Middle East, which might generate volatility in the US Dollar, the Japanese Yen, and the Canadian Dollar. There could also be unforeseen side effects which might affect other currencies.

You can trade these forecasts in a real or demo Forex brokerage account.

Weekly Forex Forecast – 9th to 13th March 2026 (Charts)

Key Support and Resistance Levels

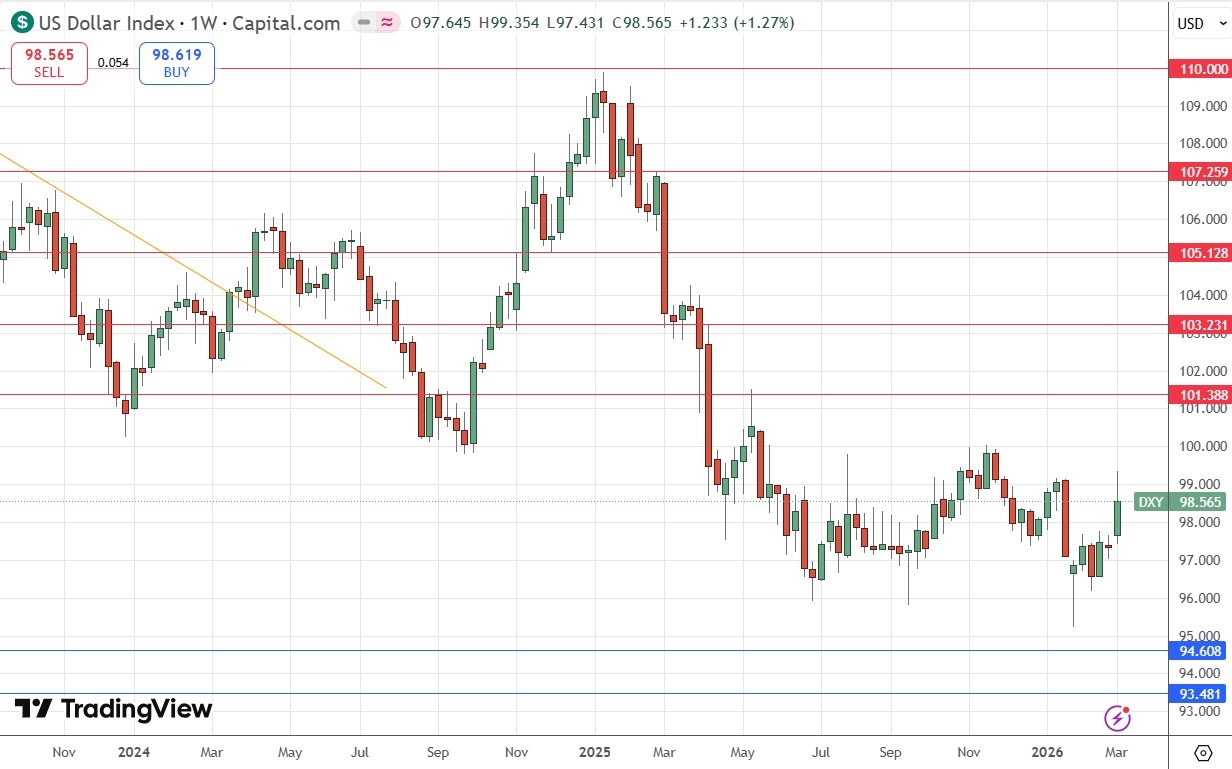
Last week, the US Dollar printed a large bullish candlestick which opened with a gap higher. Although there is a significant upper wick and a rejection of a recent inflective high, which is often a bearish sign, the price is now showing a technical long-term bullish trend because the price is higher than it was both three and six months ago.

We can see that the picture is muddied even more because the price is within a zone where it has been comfortable consolidating.

The flow into the US Dollar has been caused by two things: the hawkish tilt on rate cuts we saw last week, and the outbreak of war in the middle east which has seen the greenback function as more of a safe haven.

It might be wise to take a long bias on the USD this week, but I don’t see much in it either way, so I would remain focused on other assets over this week and treat the greenback as something relatively neutral.

Weekly Forex Forecast – 9th to 13th March 2026 (Charts)

US Dollar Index Weekly Price Chart

WTI Crude Oil made its strongest rise in years last week, gapping higher at the weekly open following the surprise joint attack on Iran by the USA and Israel early Saturday, and closing Friday at a new 2 year and 5-month high price. Markets had been expecting some type of strike, but it quickly became clear that the USA and Israel are all-in for regime change, killing the Supreme Leader Khamenei with the first strike of the war.

Many analysts were persuaded that the USA would be careful to have a plan to prevent the price of crude oil from rising excessively. However, apart from the sides not making all-out attacks against oil facilities, the war has been broad enough and dangerous enough to push the price of oil notably higher, with the price now almost double what it was just a few weeks ago.

The Iranian regime and other forces which want to thwart a US/Israeli victory (such as Qatar and Turkey) will now be doing everything they can to push the price of crude oil higher. Another factor behind this is that the USA is, for the time being, basically standing off the Strait of Hormuz which Iran has practically closed – traffic through the Strait is down by about 70%. The USA has calculated that it can stand a few weeks of the Strait being blocked, although it has offered to escort tankers through.

I had thought that the outbreak of war would cause only a limited, restrained rise in the price of crude oil, as this is what happened last June during the previous Israel-Iran was. I was wrong and I sold my long too early.

It is likely to be dangerous to enter now as we could easily see a fast and huge drop in the price. However, maybe the price of oil really will rise to trade well above $100 before it goes down. It is hard to see this war ending for a few more weeks at least.

If you will go long, do it with a very small position size that reflects the enormously high volatility which we see in the price these days.

Weekly Forex Forecast – 9th to 13th March 2026 (Charts)

WTI Crude Oil Weekly Price Chart

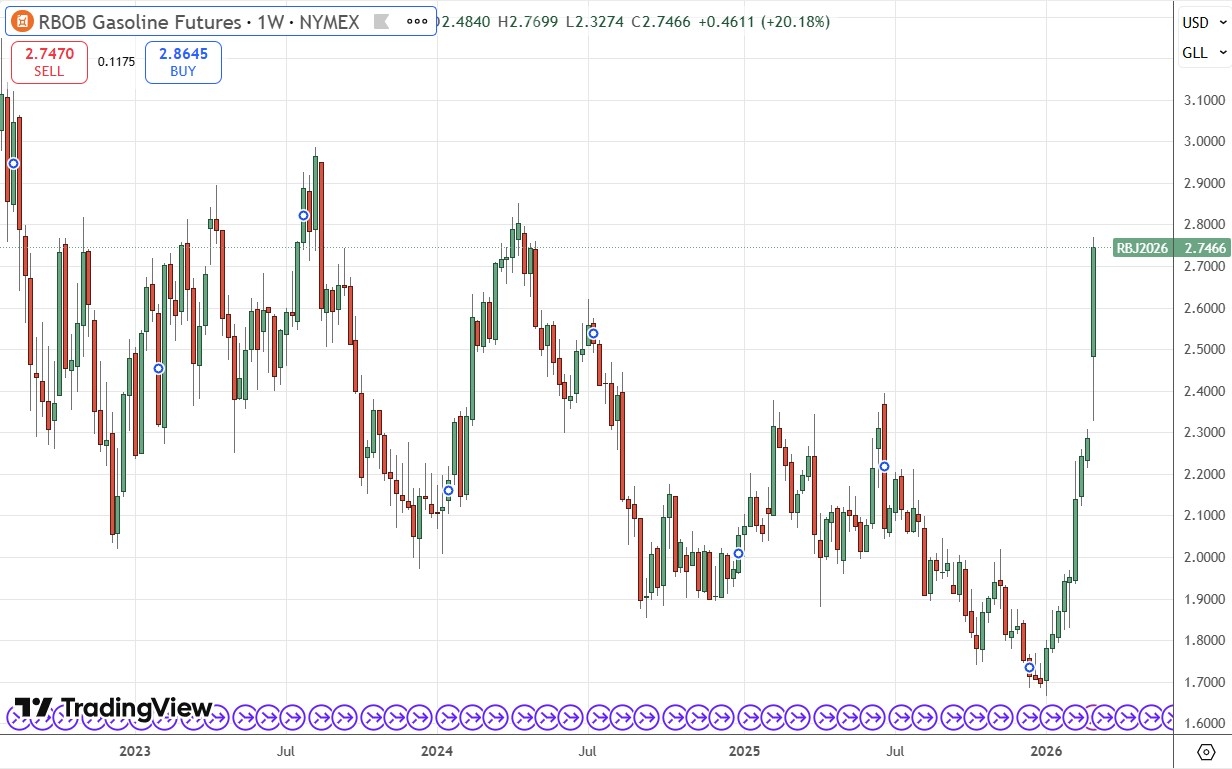
RBOB Gasoline futures shot higher last week, reaching their highest price in almost two years.

This is all about what I wrote just above concerning WTI Crude Oil. As the price of crude oil rises, so the price of Gasoline is almost certain to rise with high positive correlation between the two assets, as gasoline is derived by refining crude oil.

As I wrote above, it might be too late for a long trade, and if you do feel you have to go long here, use a very small position size (respect the very high volatility) and a trailing stop to avoid a catastrophic loss. Remember that what goes up very hard and very fast can come down in exactly the same way.

Weekly Forex Forecast – 9th to 13th March 2026 (Charts)

RBOB Gasoline Futures Weekly Price Chart

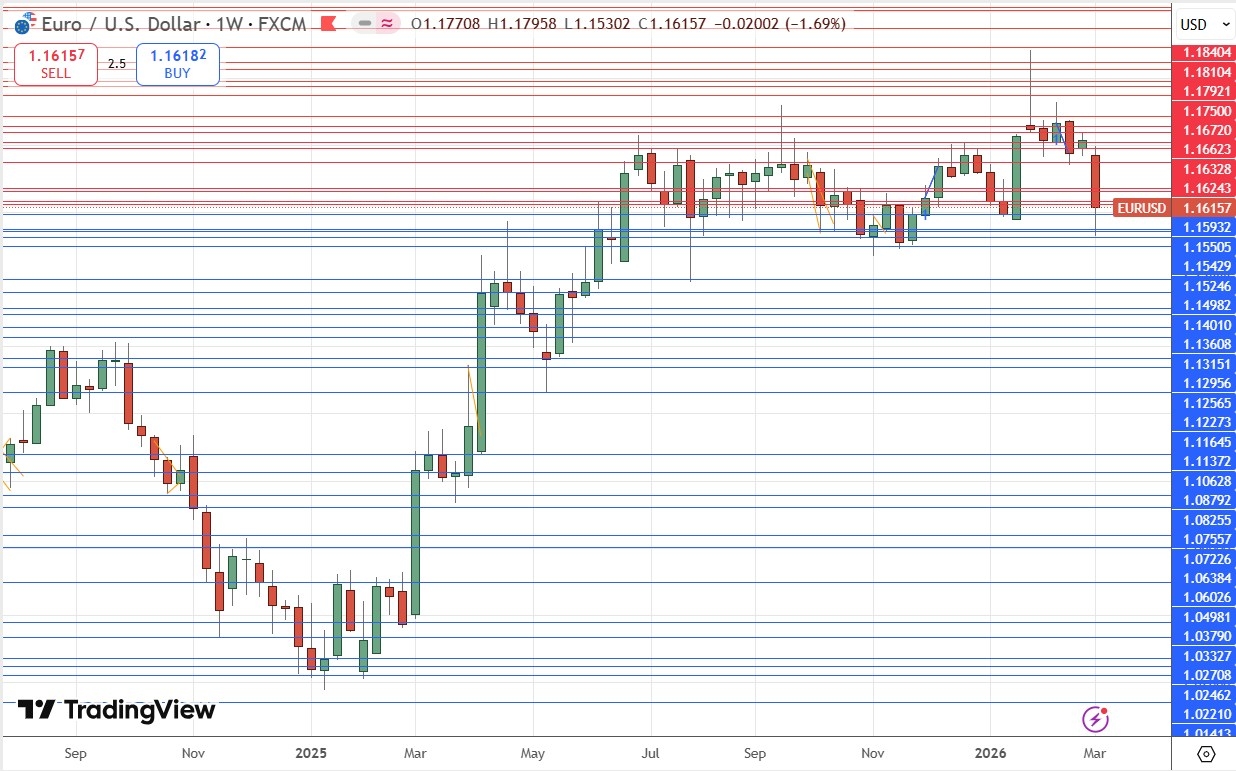
EUR/USD ended up in focus last week because the USD and the EUR were respectively the strongest and weakest currencies over the week. This was partly driven by the war in the Middle East, with safe haven funds flowing into the USD, and the Euro affected by the halt in Qatari LNG (liquid natural gas) production which has sent European energy prices flying, and this has hit the Euro.

Technically, we see the low of the week not far from the big round number at $1.1500 where there is clearly strong support for the best part of a year. This may be important as the USD is not in a strongly bullish trend, so there is a good chance that the price here might bounce back from this area, which has acted as long-term support.

On the other hand, a solid breakdown below the $1.1500 area could see the price fall through blue sky quickly and strongly to arrive soon at the $1.1300 handle.

Weekly Forex Forecast – 9th to 13th March 2026 (Charts)

EUR/USD Weekly Price Chart

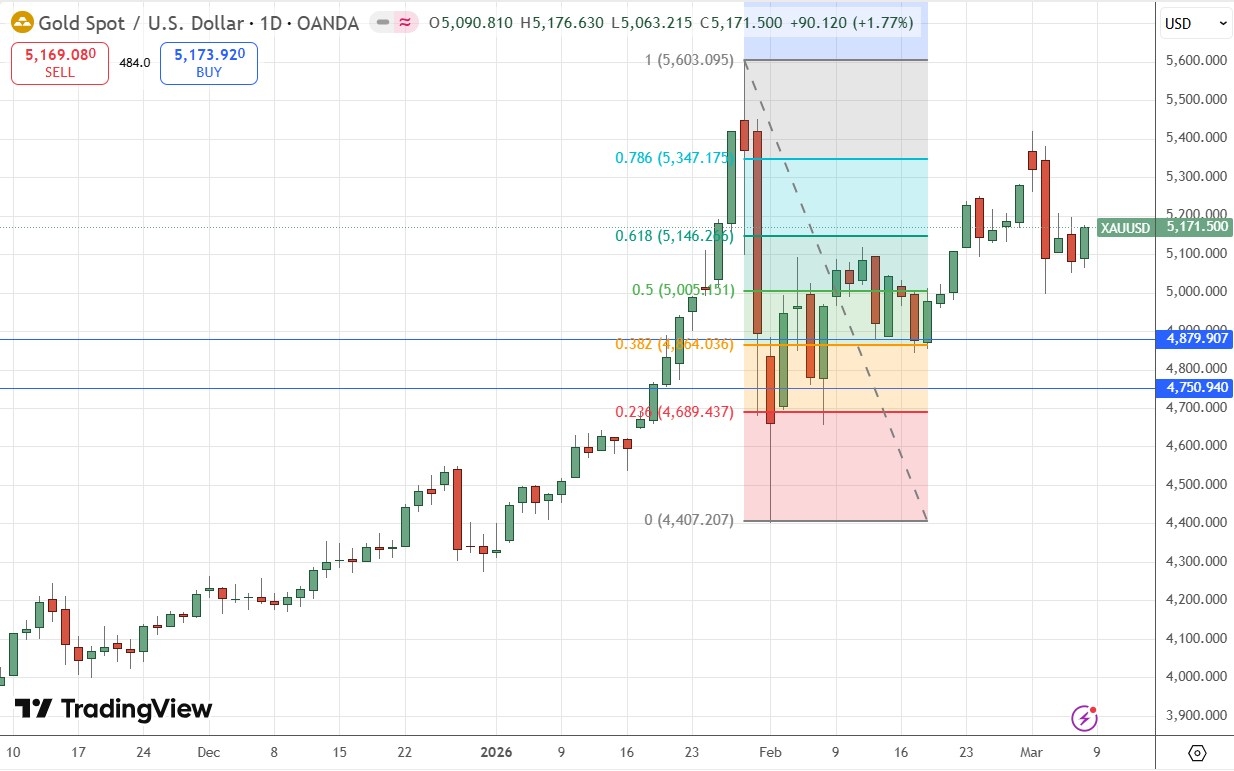
Gold fell over the week, but what happened was technically significant and bullish. When the price made its big drop early this week (see the price chart below), it found support at the big round number of $5,000 which is also highly confluent with the 50% Fibonacci retracement which is also shown as a study within the price chart.

This, combined with the fairly bullish price action we have seen since $5,000 was hit, suggests that Gold is going to keep rising, perhaps given a tailwind as a safe haven asset by the ongoing war in the Middle East.

Despite the bullish development, I will be waiting for a new record daily high closing price before entering a new long trade here.

Weekly Forex Forecast – 9th to 13th March 2026 (Charts)

Gold Daily Price Chart

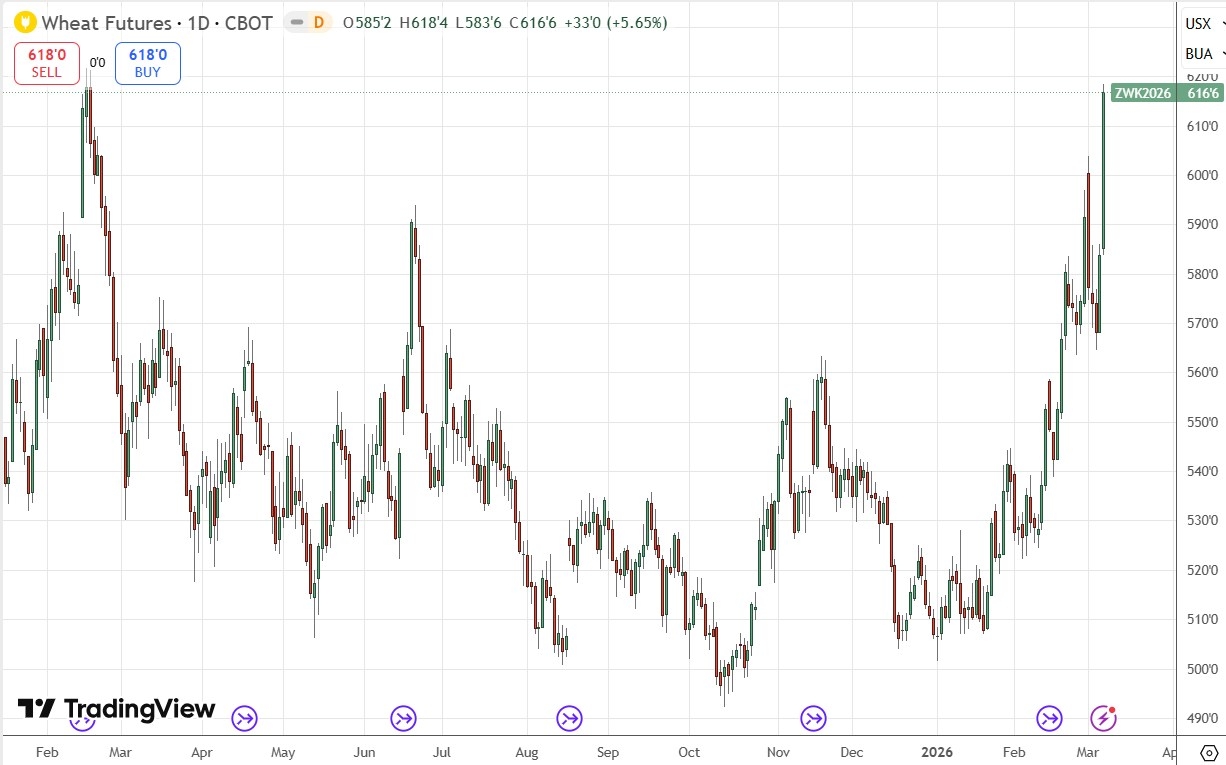
ZW Wheat futures shot higher last week, reaching their highest price in a year. The weekly rise was unusually strong and mirrored the move seen in WTI Crude Oil and Gasoline. For this reason, many analysts see the war as pushing the price of grains up (all grain futures rose last week), but there are deeper reasons relating to supply issues in the grain markets and changes to the wheat business in the USA.

Although this strong rise is a little early, and the price chart below feels like we could see the price come down again very quickly, the moving averages are correctly aligned enough that trend following funds and institutions are going to be entering new long trades in Wheat at Monday’s open.

If Wheat futures are too big for you (and they probably are), you can get exposure to US Wheat by buying the Teacrium Wheat Fund (WEAT) which is an ETF and very affordable.

Weekly Forex Forecast – 9th to 13th March 2026 (Charts)

Wheat Daily Price Chart

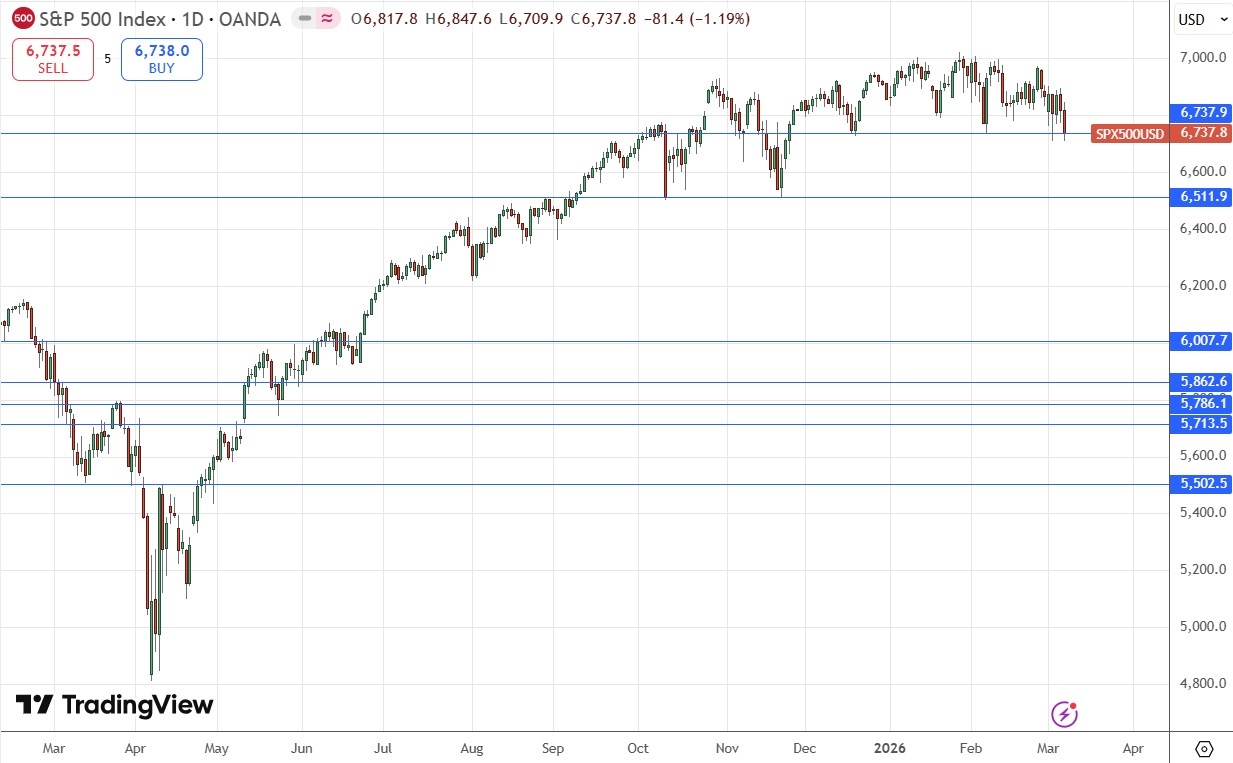
Last week was poor for the US stock market, with the S&P 500 Index not only closing lower, but closing the week sitting heavily on the long-term support level at 6,737.

Technically, things are starting to look bearish. Look at the topping price action underneath and just touching the big round number at 7,000 which we have seen over recent weeks.

We also have a double, maybe even a triple, bearish head and shoulders chart pattern, with the neckline clearly at 6,737.

I think a bearish breakdown is likely below that level and we will then see the price quickly reach the other significant round number at 6,500, the horizontal low at 6,512, and the 200-day moving average sitting above both. If the price breaks below all that, the market really will be in trouble.

Shorting the US stock market, especially an Index, is not easy, and should only be attempted by experienced traders.

Weekly Forex Forecast – 9th to 13th March 2026 (Charts)

S&P 500 Index Daily Price Chart

I see the best trades this week as:

  1. Long of Gold following a daily (New York) close above $5,418.55.

  2. Long of Wheat.

Ready to trade our Forex weekly forecast? Check out our list of the top 10 Forex brokers.

Source link

8 03, 2026

XAG/USD range-bound as RSI holds near 50 and MACD flattens

By |2026-03-08T07:53:18+02:00March 8, 2026|Forex News, News|0 Comments


Silver (XAG/USD) trades modestly higher on Friday as the US Dollar (USD) and Treasury yields ease following softer-than-expected US Nonfarm Payrolls (NFP) data. Despite the intraday bounce, the white metal remains on track for its first weekly decline in three weeks.

At the time of writing, XAG/USD is trading around $84.27, up nearly 2.73% on the day after rebounding from a daily low near $80.17.

Meanwhile, the escalating US-Iran conflict continues to offer some underlying support to safe-haven assets, helping limit deeper losses in Silver.

However, rising Oil prices driven by supply disruptions through the Strait of Hormuz are fueling global inflation concerns. As a result, traders are trimming expectations for Federal Reserve (Fed) interest rate cuts, which tends to weigh on the non-yielding metal.

From a technical perspective, Silver is showing signs of consolidation after retreating from the upper Bollinger Band earlier this week. On the daily chart, price action is attempting to stabilise around the middle Bollinger Band near $83, which also serves as the 20-day Simple Moving Average (SMA), keeping the near-term bias neutral to slightly bullish.

Momentum indicators point to a lack of strong directional conviction. The Relative Strength Index (RSI) is hovering near the 50 mark, suggesting balanced momentum after the recent pullback.

The Moving Average Convergence Divergence (MACD) indicator (12, 26, close, 9) is flattening near the zero line, suggesting fading bearish momentum, though the MACD line remains slightly below the signal line.

The Average Directional Index (ADX) is trending lower near 18, indicating weakening trend strength and reinforcing the view that the market has shifted into a range-bound phase.

On the downside, a decisive break below the middle Bollinger Band could expose the lower Bollinger Band around $72 as the next support level, followed by the February swing low near $64.08.

On the upside, a clear break above the upper Bollinger Band near $93.86 would be needed to attract fresh buying interest. A move beyond this level could open the door toward the $100 psychological mark, which may cap gains initially before a potential extension toward a retest of the all-time high near $121.66.

Silver FAQs

Silver is a precious metal highly traded among investors. It has been historically used as a store of value and a medium of exchange. Although less popular than Gold, traders may turn to Silver to diversify their investment portfolio, for its intrinsic value or as a potential hedge during high-inflation periods. Investors can buy physical Silver, in coins or in bars, or trade it through vehicles such as Exchange Traded Funds, which track its price on international markets.

Silver prices can move due to a wide range of factors. Geopolitical instability or fears of a deep recession can make Silver price escalate due to its safe-haven status, although to a lesser extent than Gold’s. As a yieldless asset, Silver tends to rise with lower interest rates. Its moves also depend on how the US Dollar (USD) behaves as the asset is priced in dollars (XAG/USD). A strong Dollar tends to keep the price of Silver at bay, whereas a weaker Dollar is likely to propel prices up. Other factors such as investment demand, mining supply – Silver is much more abundant than Gold – and recycling rates can also affect prices.

Silver is widely used in industry, particularly in sectors such as electronics or solar energy, as it has one of the highest electric conductivity of all metals – more than Copper and Gold. A surge in demand can increase prices, while a decline tends to lower them. Dynamics in the US, Chinese and Indian economies can also contribute to price swings: for the US and particularly China, their big industrial sectors use Silver in various processes; in India, consumers’ demand for the precious metal for jewellery also plays a key role in setting prices.

Silver prices tend to follow Gold’s moves. When Gold prices rise, Silver typically follows suit, as their status as safe-haven assets is similar. The Gold/Silver ratio, which shows the number of ounces of Silver needed to equal the value of one ounce of Gold, may help to determine the relative valuation between both metals. Some investors may consider a high ratio as an indicator that Silver is undervalued, or Gold is overvalued. On the contrary, a low ratio might suggest that Gold is undervalued relative to Silver.


Source link

8 03, 2026

USD/JPY: Elliott wave analysis and forecast for 06.03.26–13.03.26

By |2026-03-08T07:46:04+02:00March 8, 2026|Forex News, News|0 Comments

The article covers the following subjects:

Major Takeaways

  • Main scenario: Consider long positions from corrections above 156.40 with a target of 160.00–162.00. A buy signal: the price holds above 156.40. Stop Loss: below 156.40, Take Profit: 160.00–162.00.
  • Alternative scenario: Breakout and consolidation below the level of 156.40 will allow the pair to continue declining to the levels of 155.10–154.40. A sell signal: the level of 156.40 is broken to the downside. Stop Loss: above 156.40, Take Profit: 155.10–154.40.

Main Scenario

Consider long positions from corrections above the level of 156.40 with a target of 160.00–162.00.

Alternative Scenario

Breakout and consolidation below 156.40 will allow the pair to continue declining to the levels of 155.10–154.40.

Analysis

An ascending fifth wave of larger degree 5 is developing on the weekly chart, with wave (1) of 5 forming as its part. Apparently, the third wave of smaller degree 3 of (1) has formed on the daily chart, and a correction has been completed as the fourth wave 4 of (1). The fifth wave 5 of (1) has presumably started developing on the H4 time frame, with wave i of 5 still forming within. If the presumption is correct, USD/JPY will continue to rise to the levels of 160.00–162.00. The level of 156.40 is critical in this scenario as a breakout below it will enable the pair to continue declining to the levels of 155.10–154.40.


This forecast is based on the Elliott Wave Theory. When developing trading strategies, it is essential to consider fundamental factors, as the market situation can change at any time.

Price chart of USDJPY in real time mode

The content of this article reflects the author’s opinion and does not necessarily reflect the official position of LiteFinance broker. The material published on this page is provided for informational purposes only and should not be considered as the provision of investment advice for the purposes of Directive 2014/65/EU.


According to copyright law, this article is considered intellectual property, which includes a prohibition on copying and distributing it without consent.

Rate this article:

{{value}} ( {{count}} {{title}} )


Source link

8 03, 2026

Silver (XAG) Forecast: Rising Oil Prices Cloud the Near-Term Silver Outlook

By |2026-03-08T03:52:02+02:00March 8, 2026|Forex News, News|0 Comments


Scan QR code to install app

Important DisclaimersFXEmpire is owned and operated by Empire Media Network LTD., Company Registration Number 514641786, registered at 7 Jabotinsky Road, Ramat Gan 5252007, Israel. The content provided on this website includes general news and publications, our personal analysis and opinions, and materials provided by third parties. This content is intended for educational and research purposes only. It does not constitute, and should not be interpreted as, a recommendation or advice to take any action, including making any investment or purchasing any product. Before making any financial decision, you should conduct your own due diligence, exercise your own discretion, and consult with competent advisors. The content on this website is not personally directed to you, and we do not take into account your individual financial situation or needs. The information contained on this website is not necessarily provided in real time, nor is it guaranteed to be accurate. Prices displayed may be provided by market makers and not by exchanges. Any trading or other financial decision you make is entirely your own responsibility, and you must not rely solely on any information provided through the website. FXEmpire does not provide any warranty regarding the accuracy, completeness, or reliability of any information contained on the website and shall bear no responsibility for any trading losses you may incur as a result of using such information. The website may include advertisements and other promotional content. FXEmpire may receive compensation from third parties in connection with such content. FXEmpire does not endorse, recommend, or assume responsibility for the use of any third-party services or websites. Empire Media Network LTD., its employees, officers, subsidiaries, and affiliates shall not be liable for any loss or damage resulting from your use of the website or reliance on the information provided herein.Risk DisclaimersThis website contains information about cryptocurrencies, contracts for difference (CFDs), and other financial instruments, as well as about brokers, exchanges, and other entities trading in such instruments. Both cryptocurrencies and CFDs are complex instruments and involve a high risk of losing money. You should carefully consider whether you understand how these instruments work and whether you can afford to take the high risk of losing your money. FX Empire encourages you to conduct your own research before making any investment decision and to avoid investing in any financial instrument unless you fully understand how it works and the risks involved.


Source link

Go to Top