About Editorial team of BIPNs

Main team of content of bipns.com. Any type of content should be approved by us.
12 01, 2025

XRP Price Prediction For January 12

By |2025-01-12T09:14:14+02:00January 12, 2025|Crypto News, News|0 Comments

Currently, XRP is moving in a sideways range, which has been a characteristic of its price action over the past months. However, in the past weeks, XRP has broken through key resistance levels, which could signal the start of a new bullish trend. At the time of writing, XRP is trading above the $2.50 mark and is up by more than nine percent in the last 24 hours. 

When looking at the chart, the price of XRP is now positioned above certain important levels, hinting that the market could potentially move upwards towards new highs.

Important Price Levels To Monitor

Looking ahead, for XRP to continue its upward movement and reach new highs, it will need to break through some key resistance points. The first level to watch for an upward breakout is around $2.55, followed by another resistance level at $2.72. If XRP can clear both of these levels, it could pave the way for a rally that may take the price toward all-time highs.

However, it’s important to note that there is an invalidation point for this bullish scenario. If the price drops below $1.96, this could signal that the current trend may not continue, and the market outlook would need to be reassessed. Therefore, the support levels in the $2.20-$2.30 range are critical for the short-term outlook of XRP.

Technical Analysis: 

XRP has formed a triangle pattern, which consists of five waves: A-B-C-D-E. This pattern has now technically completed its minimum requirements. The formation of this pattern suggests that the price could break out either upwards or downwards. As of now, there has already been a positive reaction to the support areas between $2.20 and $2.30, which are Fibonacci levels that traders use to identify potential support and resistance zones.

Source link

12 01, 2025

Gold Price Forecast: XAU/USD Bulls Charge Resistance

By |2025-01-12T08:23:14+02:00January 12, 2025|Forex News, News|0 Comments


Gold Technical Forecast: XAU/USD Weekly Trade Levels

  • Gold prices rebound from multi-year trend support- marks second weekly advance
  • XAU/USD rally within striking distance of key resistance- U.S. CPI on tap next week
  • Resistance 2736/47 (key), 2804, 2900– Support 2607, 2532, 2450/82 (key)

Gold prices closed a fourth consecutive daily advance on Friday with the post-NFP rally posting a weekly advance of nearly 1.9%. A rebound off slope support is attempting to mark resumption of the broader uptrend with key resistance now in view. Battle lines drawn on the XAU/USD weekly technical chart.

Review my latest Weekly Strategy Webinar for an in-depth breakdown of this gold setup and more. Join live on Monday’s at 8:30am EST.

Gold Price Chart – XAU/USD Weekly


Chart Prepared by Michael Boutros, Sr. Technical Strategist; XAU/USD on TradingView

Technical Outlook: In my last Gold Weekly Price Forecast we noted that the XAU/USD was, “trading into a multi-year slope support into the start of the December and the focus is on a reaction off the median-line early in the month. From a trading standpoint, the focus remains on a breakout of the 2607-2736 range for near-term directional guidance.” A two-week advance has now rallied more than 4.4% off the December lows with a rebound off the median-line now threatening a stretch towards uptrend resistance.

The focus is on the record high-week close / 2024 high-close at 2736/47– a breach / close above this threshold is needed to mark uptrend resumption towards subsequent resistance objectives at the 2.618% extension of the 2022 range-break at 2804 and the 2900. The next major technical confluence is eyed at 3000/31– a region defined by the 2.272% extension of the 2011 decline and the 1.618% extension of the 2022 advance. Look for a larger reaction there IF reached.

Initial weekly support rests with the median-line and is backed closely by the 61.8% retracement at 2607– a break / weekly close below this threshold would suggest a larger correction is underway within the broader uptrend with initial support objectives seen at the August high at 2531 and 2450/82– a region defined by the April swing high and the 38.2% retracement of the 2024 trading range. We will reserve this threshold as our bullish invalidation level and losses would need to be limited to this slope for the late-2023 uptrend to remain viable.

Get our exclusive guide to gold trading in 2025

Bottom line: Gold has rebounded off uptrend support into the start of the month with the advance now within striking distance of pivotal resistance. From a trading standpoint, look to reduce portions of long-exposure / raise protective stops on a stretch towards 2736- losses should be limited the median-line IF price is heading higher on this stretch with a breach above the high-close needed to mark uptrend resumption.

Keep in mind we get the release of key US inflation data next week with the Consumer Price Index (CPI) on tap Wednesday. Stay nimble into the release and watch the weekly closes here for guidance. Review my latest Gold Short-term Outlook for a closer look at the near-term XAU/USD technical trade levels.

Key US Economic Data Releases

 Gold Economic Calendar-XAU USD Key Data Releases-GLD Weekly Event Risk-1-10-2025

Economic Calendar – latest economic developments and upcoming event risk.

Active Weekly Technical Charts

— Written by Michael Boutros, Sr Technical Strategist with FOREX.com

Follow Michael on X @MBForex


Source link

12 01, 2025

British Pound Technical Forecast: GBP/USD, GBP/JPY, EUR/GBP

By |2025-01-12T07:18:11+02:00January 12, 2025|Forex News, News|0 Comments

British Pound Talking Points:

  • It was a rough week for the British Pound, as GBP sold-off against all of the Euro, U.S. Dollar and Japanese Yen.
  • Next Wednesday is key as we’ll see the next release of UK CPI ahead of the release of US CPI data.

It was a brutal week for the British Pound as the currency lost against all of the U.S. Dollar, the Euro and the Japanese Yen. In the major pair of GBP/USD, a fresh yearly low came into play as the final four days of the week produced a move that dropped by more than 380 pips, at one point. Perhaps more disconcerting for Sterling bulls is where the move took place, as a prior support at 1.2300 was taken-out before a bounce developed from 1.2250. But even that couldn’t last as the Friday NFP report helped to produce another downside thrust in the move until price breached the 1.2200 level.

At this point, there’s no sign yet of bears letting up and the next major level of contention below current price is the 1.2000 psychological level that hasn’t traded since early-2023.


GBP/USD Weekly Price Chart

gbpusd weekly 11025Chart prepared by James Stanley, GBP/USD on Tradingview


GBP/USD


At this point the challenge on Cable is how established the move has become. As of this writing RSI is pushing back into oversold territory on the daily chart and this would be the first such occurrence of that since November. This, of course, does not preclude bearish continuation, but it does urge caution from chasing, and given prior short-term support structure, there are a few areas of note that bears can look to for lower-high resistance.

The psychological level of 1.2250 is of interest, after which the Fibonacci level I had looked at earlier in the week at 1.2297 comes into the picture. And above that is another Fibonacci level at 1.2367.


GBP/USD Daily Chart

gbpusd daily 11025Chart prepared by James Stanley, GBP/USD on Tradingview


GBP/JPY


GBP/JPY printed an evening star formation that confirmed on Wednesday, and that led to a strong sell-off on Thursday and Friday. But similarly, there were some items of note at key support zones last week. I had looked at the 193.61-194.11 zone in the Wednesday article as this is the bottom portion of a gap from back in 2008. That area led to a bounce on Thursday but sellers caught the break on Friday, making a strong push down to a fresh monthly low.

For next week, the focus is on deeper support, looking to the 190.81 Fibonacci level which is nearing confluence with a bullish trendline drawn from August and December swing-lows.


GBP/JPY Daily Price Chart

gbpjpy daily 11025Chart prepared by James Stanley, GBP/JPY on Tradingview


EUR/GBP


As of this writing EUR/GBP has gained 1.09% this week, which would stand as the largest weekly gain for the pair since January of 2023. The pair rallied up to the 23.6% retracement of the two-year-move, and this follows almost two months of stalling after sellers were unable to elicit any significant bearish continuation below .8260.


EUR/GBP Weekly Price Chart

eurgbp weekly 11025Chart prepared by James Stanley, EUR/GBP on Tradingview


EUR/GBP Shorter-Term


Given the breakout to a fresh two-month high, the next natural question is whether a bullish trend can follow Given prior price structure, there’s now support potential around prior resistance, and I’m tracking this from around .8311 up to .8328. And for next resistance, there’s a prior swing-high at .8448 before the psychological level of .8500 would come back into play.


EUR/GBP Daily Price Chart

eurgbp daily 11025Chart prepared by James Stanley, EUR/GBP on Tradingview


— written by James Stanley, Senior Strategist


Source link

12 01, 2025

A Doctor Reveals The 5 Natural Supplements That ‘May Actually Be Harmful To The Heart’: Ma Huang, Bitter Orange And More

By |2025-01-12T07:15:12+02:00January 12, 2025|Dietary Supplements News, News|0 Comments


Many of us turn to supplements to enhance our health and fill nutritional voids, but their benefits are not always as they appear. At times, especially when consumed in excessive amounts or without appropriate advice, many wellness products may lead to adverse effects.

For instance, certain supplements could inadvertently elevate blood pressure and heighten the likelihood of cardiovascular issues. In an enlightening TikTok video, user @oyiheartdoctor, a physician and heart health authority, explained five natural supplements that might be “harmful to the heart” and provided reasons for their potential dangers.

60+ Gift Ideas For Everyone On Your List

Shutterstock

5 Unexpected Natural Supplements That Could Be Harmful to the Heart, According to a Doctor

1. Yohimbine

At the beginning of the video, the creator said: “these are five supplements that may actually be harmful to the heart, especially when taken excessively or without proper guidance.” Her first listed one was Yohimbine, which she said is often “marketed for weight loss or improving sexual performance.” It can cause “dangerously elevated heart rate and blood pressure,” she warned. The doctor also noted that these pills can “cause arrhythmias and heart attacks,” and that “people are more at risk of having the side effects particularly if they have pre-existing heart conditions or high blood pressure.”

Shutterstock


2. Ma Huang

The second supplement that @oyiheartdoctor listed was Ma Huang (also known as Ephedra sinica), a “herbal supplement used for weight loss and boosting energy.” She added that it “can be bad for the heart cause it can highly “stimulate the nervous system, leading to increased heart rates and elevated blood pressure,” as well as a “high risk of heart attacks and strokes.” It has “actually been banned in many countries including the US,” but can still appear in some products or even under other names,” she warned.

Shutterstock


3. Bitter Orange

Next, she noted that “bitter orange citrus aurantium” is another “common ingredient in weight loss supplements that is bad for the heart,” as it contains synephrine. This can act like ephedrine, she went on, “increasing blood pressure and heart rate with an attendant risk of arrhythmias.” She stressed that it’s often “combined with” caffeine. “As you can imagine, this can amplify its dangerous cardiovascular effects,” the creator continued.

Shutterstock


4. Vitamin E

A “high dose” of vitamin E, a “fat-soluble antioxidant,” is also “bad for the heart,” she explained. “Small doses can be heart-healthy, but high doses like 400 international units or more daily have been linked to an increased risk of heart failure and hemorrhagic stroke,” she said. The doctor pointed out that “taking recommended daily amounts” can lead to benefits for the skin and immunity, and avoiding heavier doses “without medical advice” is key.  

Shutterstock

5. Calcium

Calcium supplements are “often taken for bone health, but can be bad for the heart” if taken in excess, the doctor shared. “Excessive calcium, especially from supplements rather than food,” she urged, can “lead to calcium buildup in the arteries, increasing the risk of heart attacks and atherosclerosis.” This, she said, refers to “blockages in the heart arteries.” She noted that you can “balance calcium intake with magnesium and vitamin D, and also vitamin K and vitamin K2.” This can “ensure proper absorption and heart safety.”


@oyiheartdoctor Five supplements to the heart #supplements #heart #healthy ♬ original sound – Dr. Tiktokidi heartDoc MD FACC

The Bottom Line

“While supplements can actually provide health benefits, they aren’t risk-free, especially for your heart,” @oyiheartdoctor advised. The TikToker also stressed that it’s vital to “always consult your doctor before starting any new supplement, especially if you have pr-existing heart conditions or take other medications.”  


Source link

12 01, 2025

XRP Breakout Alert! Price Poised for 80% Rally

By |2025-01-12T07:13:29+02:00January 12, 2025|Crypto News, News|0 Comments

XRP, the native token of Ripple Labs, is poised for significant upside momentum following the breakout of a bullish price action pattern on the daily timeframe. Over the past few days, the overall cryptocurrency market has been struggling, and during this period, XRP experienced a prolonged consolidation.

XRP Price Prediction 

According to expert technical analysis, XRP has broken out of a bullish flag and pole price action pattern on the daily timeframe and has closed a daily candle above the pattern. This pattern breakout has ended XRP’s prolonged consolidation. Based on recent price action, there is a strong possibility that it could soar by 80% to reach the $4.5 level in the coming days.

Source: Trading View

This bullish pattern appears to be a textbook example, indicating an ideal buying opportunity for traders and investors looking for long-term holdings.

On-Chain Metrics Signal Investor Confidence

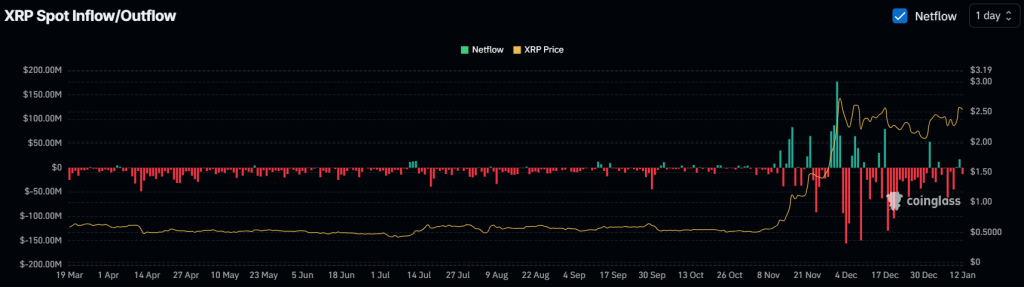
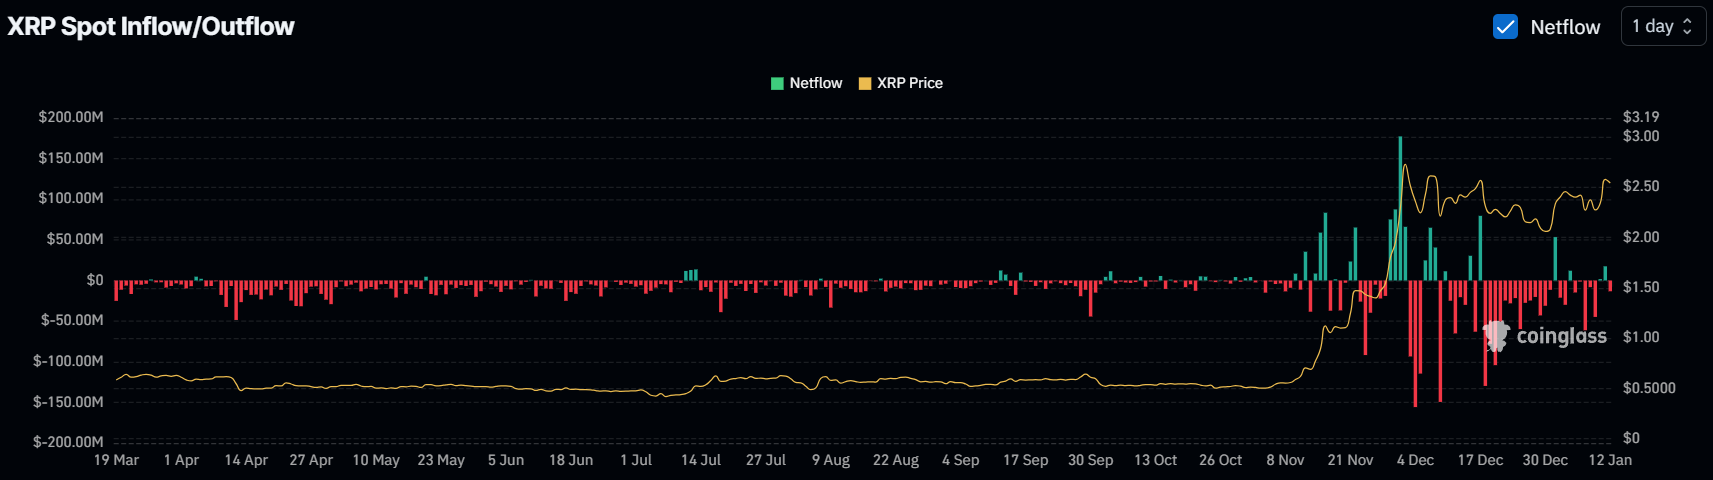
Besides the recent breakout, XRP investors have already shown strong interest and confidence in the token, even during periods of price struggles. Since December 18, 2024, exchanges have recorded token inflows on only three days, despite a notable price decline across the market, as revealed by Coinglass’s spot inflow/outflow metrics.

XRP Breakout Alert! Price Poised for 80% Rally
Source: Coinglass

$13 Million Worth of XRP Outflow from Exchanges 

However, in the past 24 hours, on-chain metrics indicate that investors have withdrawn a significant 13 million XRP tokens from exchanges, highlighting the continuous accumulation by long-term holders. This ongoing accumulation could strongly support XRP in its rally.

Besides long-term holders, trader participation has also skyrocketed. Since the breakout, XRP’s open interest has jumped by 31%, indicating strong engagement from traders amid the market shift.

Current Price Momentum

Currently, XRP is trading near $2.54 and has experienced a price surge of over 8.75% in the past 24 hours. During the same period, its trading volume jumped by 60%, indicating heightened participation from traders and investors.

Source link

12 01, 2025

British Pound Technical Forecast: GBP/USD, GBP/JPY, EUR/GBP

By |2025-01-12T05:17:22+02:00January 12, 2025|Forex News, News|0 Comments

British Pound Talking Points:

  • It was a rough week for the British Pound, as GBP sold-off against all of the Euro, U.S. Dollar and Japanese Yen.
  • Next Wednesday is key as we’ll see the next release of UK CPI ahead of the release of US CPI data.

It was a brutal week for the British Pound as the currency lost against all of the U.S. Dollar, the Euro and the Japanese Yen. In the major pair of GBP/USD, a fresh yearly low came into play as the final four days of the week produced a move that dropped by more than 380 pips, at one point. Perhaps more disconcerting for Sterling bulls is where the move took place, as a prior support at 1.2300 was taken-out before a bounce developed from 1.2250. But even that couldn’t last as the Friday NFP report helped to produce another downside thrust in the move until price breached the 1.2200 level.

At this point, there’s no sign yet of bears letting up and the next major level of contention below current price is the 1.2000 psychological level that hasn’t traded since early-2023.


GBP/USD Weekly Price Chart

gbpusd weekly 11025Chart prepared by James Stanley, GBP/USD on Tradingview


GBP/USD


At this point the challenge on Cable is how established the move has become. As of this writing RSI is pushing back into oversold territory on the daily chart and this would be the first such occurrence of that since November. This, of course, does not preclude bearish continuation, but it does urge caution from chasing, and given prior short-term support structure, there are a few areas of note that bears can look to for lower-high resistance.

The psychological level of 1.2250 is of interest, after which the Fibonacci level I had looked at earlier in the week at 1.2297 comes into the picture. And above that is another Fibonacci level at 1.2367.


GBP/USD Daily Chart

gbpusd daily 11025Chart prepared by James Stanley, GBP/USD on Tradingview


GBP/JPY


GBP/JPY printed an evening star formation that confirmed on Wednesday, and that led to a strong sell-off on Thursday and Friday. But similarly, there were some items of note at key support zones last week. I had looked at the 193.61-194.11 zone in the Wednesday article as this is the bottom portion of a gap from back in 2008. That area led to a bounce on Thursday but sellers caught the break on Friday, making a strong push down to a fresh monthly low.

For next week, the focus is on deeper support, looking to the 190.81 Fibonacci level which is nearing confluence with a bullish trendline drawn from August and December swing-lows.


GBP/JPY Daily Price Chart

gbpjpy daily 11025Chart prepared by James Stanley, GBP/JPY on Tradingview


EUR/GBP


As of this writing EUR/GBP has gained 1.09% this week, which would stand as the largest weekly gain for the pair since January of 2023. The pair rallied up to the 23.6% retracement of the two-year-move, and this follows almost two months of stalling after sellers were unable to elicit any significant bearish continuation below .8260.


EUR/GBP Weekly Price Chart

eurgbp weekly 11025Chart prepared by James Stanley, EUR/GBP on Tradingview


EUR/GBP Shorter-Term


Given the breakout to a fresh two-month high, the next natural question is whether a bullish trend can follow Given prior price structure, there’s now support potential around prior resistance, and I’m tracking this from around .8311 up to .8328. And for next resistance, there’s a prior swing-high at .8448 before the psychological level of .8500 would come back into play.


EUR/GBP Daily Price Chart

eurgbp daily 11025Chart prepared by James Stanley, EUR/GBP on Tradingview


— written by James Stanley, Senior Strategist


Source link

12 01, 2025

Gold Price Forecast: XAU/USD Bulls Charge Resistance

By |2025-01-12T04:21:22+02:00January 12, 2025|Forex News, News|0 Comments


Gold Technical Forecast: XAU/USD Weekly Trade Levels

  • Gold prices rebound from multi-year trend support- marks second weekly advance
  • XAU/USD rally within striking distance of key resistance- U.S. CPI on tap next week
  • Resistance 2736/47 (key), 2804, 2900– Support 2607, 2532, 2450/82 (key)

Gold prices closed a fourth consecutive daily advance on Friday with the post-NFP rally posting a weekly advance of nearly 1.9%. A rebound off slope support is attempting to mark resumption of the broader uptrend with key resistance now in view. Battle lines drawn on the XAU/USD weekly technical chart.

Review my latest Weekly Strategy Webinar for an in-depth breakdown of this gold setup and more. Join live on Monday’s at 8:30am EST.

Gold Price Chart – XAU/USD Weekly


Chart Prepared by Michael Boutros, Sr. Technical Strategist; XAU/USD on TradingView

Technical Outlook: In my last Gold Weekly Price Forecast we noted that the XAU/USD was, “trading into a multi-year slope support into the start of the December and the focus is on a reaction off the median-line early in the month. From a trading standpoint, the focus remains on a breakout of the 2607-2736 range for near-term directional guidance.” A two-week advance has now rallied more than 4.4% off the December lows with a rebound off the median-line now threatening a stretch towards uptrend resistance.

The focus is on the record high-week close / 2024 high-close at 2736/47– a breach / close above this threshold is needed to mark uptrend resumption towards subsequent resistance objectives at the 2.618% extension of the 2022 range-break at 2804 and the 2900. The next major technical confluence is eyed at 3000/31– a region defined by the 2.272% extension of the 2011 decline and the 1.618% extension of the 2022 advance. Look for a larger reaction there IF reached.

Initial weekly support rests with the median-line and is backed closely by the 61.8% retracement at 2607– a break / weekly close below this threshold would suggest a larger correction is underway within the broader uptrend with initial support objectives seen at the August high at 2531 and 2450/82– a region defined by the April swing high and the 38.2% retracement of the 2024 trading range. We will reserve this threshold as our bullish invalidation level and losses would need to be limited to this slope for the late-2023 uptrend to remain viable.

Get our exclusive guide to gold trading in 2025

Bottom line: Gold has rebounded off uptrend support into the start of the month with the advance now within striking distance of pivotal resistance. From a trading standpoint, look to reduce portions of long-exposure / raise protective stops on a stretch towards 2736- losses should be limited the median-line IF price is heading higher on this stretch with a breach above the high-close needed to mark uptrend resumption.

Keep in mind we get the release of key US inflation data next week with the Consumer Price Index (CPI) on tap Wednesday. Stay nimble into the release and watch the weekly closes here for guidance. Review my latest Gold Short-term Outlook for a closer look at the near-term XAU/USD technical trade levels.

Key US Economic Data Releases

 Gold Economic Calendar-XAU USD Key Data Releases-GLD Weekly Event Risk-1-10-2025

Economic Calendar – latest economic developments and upcoming event risk.

Active Weekly Technical Charts

— Written by Michael Boutros, Sr Technical Strategist with FOREX.com

Follow Michael on X @MBForex


Source link

12 01, 2025

XRP Price Forecast: Ripple Targets $8 After IMF Partnership, Yet Analysts Eye This $0.04 Altcoin For 40,000% Growth In Q1 2025

By |2025-01-12T03:10:11+02:00January 12, 2025|Crypto News, News|0 Comments

In a world where partnerships may trigger a currency’s growth, the XRP price is thriving following a recent partnership between Ripple Labs, its parent company, and the International Monetary Fund (IMF).

Predictions now indicate a possible surge up to $8. However, instead of the XRP price garnering investors’ interest, analysts have their eyes elsewhere. WallitIQ (WLTQ), a $0.042 altcoin, is stealing the spotlight with its impressive potential to generate 40,000% returns by Q1 2025.

Ripple (XRP) May Hit $8 But WallitIQ (WLTQ) Will Bring Jaw-dropping 40,000% Gains

The XRP price is currently trading around $2.44, with predictions indicating a rise to $8. History shows that the XRP price often rises after new Ripple partnerships. For example, after Ripple Labs announced its partnership with MoneyGram in 2019, the XRP price saw temporary gains.

Similarly, the XRP price saw fair hikes after Ripple Labs partnered with banks like Santander and American Express to promote its currency for cross-border payments. In August 2024, Ripple Labs began its partnership with the IMF, a move that is predicted to trigger an XRP price surge this year, perhaps up to $8.

However, surges caused by partnerships are often short-lived and less than expectations, and smart analysts know this. Therefore, analysts are bullish on a surer option: a rising altcoin currently priced at $0.0420. This altcoin, WallitIQ (WLTQ), is not based on fleeting partnerships but on the latest AI technology, a factor that will inevitably trigger rapid adoption and jaw-breaking surges in Q1 2025.

Already demonstrating its impressive potential, this altcoin generated over $6 million in the last presale stages as thousands of analysts bought over 350 million tokens. The ongoing presale, which is currently priced at $0.0420 per token, has recently started and has already generated over $200,000 from the sale of 5 million tokens.

Analysts predict that this altcoin will effortlessly generate $5 million in monthly revenue by Q1 2025, ultimately dominating the $700 billion crypto wallet and AI market. While the XRP price surge to $8 due to the Ripple partnership is uncertain, WallitIQ (WLTQ) is expected to multiply investments by 40,000% in Q1 2025.

Therefore, analysts advise investors to take advantage of this life-changing opportunity by joining the WallitIQ (WLTQ) presale immediately. The $0.0420 price will not last for long, as hundreds of investors are joining the presale daily.

For investors who want massive gains in Q1 2025, the best time to act is now.

WallitIQ (WLTQ) Will Be The Next Game-Changer In Crypto

A major reason why analysts are bullish on WallitIQ (WLTQ) despite the XRP price predictions is that this altcoin presents something more. This rising altcoin will change the scope of crypto trading with improved security and simplicity features.

For instance, WallitIQ (WLTQ) uses a double-layered encryption process to protect transactions. It also features Escrow-connect, an AI-powered tool that double-checks external connections before establishing them.

Additionally, WallitIQ (WLTQ) supports biometric authentication. Users can secure their accounts with fingerprints or facial recognition, which are more reliable than pins and passwords. This altcoin platform has publicly audited its smart contract with SolidProof, a top-notch and reliable smart contract auditing firm.

Far from being complicated due to advanced security, WallitIQ (WLTQ) is very easy to use, even for beginners. It features a user-friendly interface that supports customizable widgets. The platform also contains a variety of educational resources to help investors learn as they trade.

Conclusion

While the XRP price is poised to hit $8 following the IMF partnership with Ripple Labs, its growth depends on short-term market reactions. Therefore, analysts are counting on WallitIQ (WLTQ), a highly innovative altcoin projected to grow 40,000% in Q1 2025.

For any trader who wants to see massive gains in Q1 2025, WallitIQ (WLTQ) is the way to go. Coins are still going out for a token price of $0.0420, but not for long. With hundreds of investors joining daily, this price will skyrocket soon.

Before that happens and you miss your chance, join the WallitIQ (WLTQ) presale now.

Join the WallitIQ (WLTQ) presale and community:

Disclosure: This is a sponsored press release. Please do your research before buying any cryptocurrency or investing in any projects. Read the full disclosure here.

Source link

12 01, 2025

Cardano (ADA) Price Prediction For January 12

By |2025-01-12T01:09:10+02:00January 12, 2025|Crypto News, News|0 Comments

ADA, the native token of the Cardano blockchain, is poised for significant upside momentum after breaking out of a bullish price action pattern on the daily time frame. Following a prolonged price decline in the cryptocurrency market, the overall market is recovering, sparking a major rally in ADA and confirming the breakout.

Cardano (ADA) Price Action and Upcoming Levels

According to expert technical analysis, ADA has formed a bullish Head-and-Shoulders price action pattern on the hourly time frame. With the recent price recovery, it has broken out of the pattern and closed an hourly candle above it.

Source: Trading View

This bullish pattern is often considered a buy signal by traders and investors, as it typically favors bullish momentum. Based on historical price trends, if ADA holds above the $0.95 mark, it could soar by 25%, reaching the $1.24 level in the coming days.

On the hourly time frame, this upside momentum has further broken above the 200 Exponential Moving Average (EMA), indicating that ADA has turned bullish in the short term.

On-Chain Metrics Bullish Sentiment

Observing this bullish price action, traders on Binance have built strong long positions, as reported by the on-chain analytics firm Coinglass.

79% of ADA Traders Are Long

Currently, the Binance ADAUSDT long/short ratio stands at 3.75, indicating strong bullish sentiment among traders. Further data reveals that 78.96% of top traders currently hold long positions, while 21.04% hold short positions.

However, traders seem to be continuously building new positions, resulting in open interest increasing by 9.89% in the past 24 hours.

ADA’s Trader Over-Leveraged Levels 

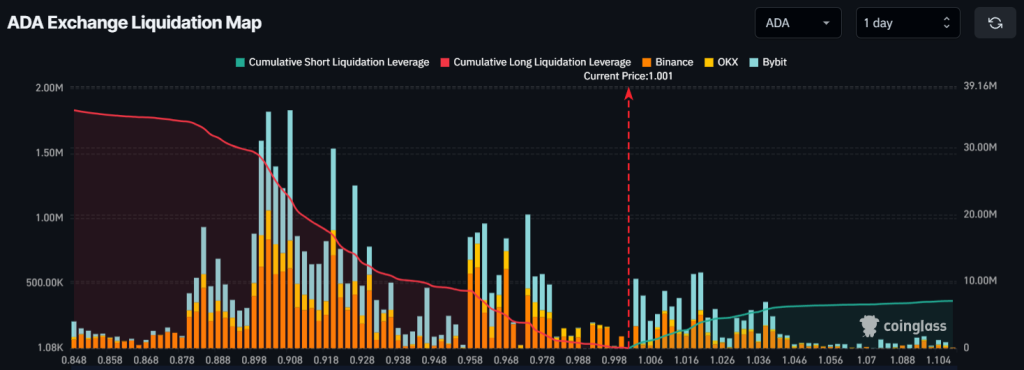
As of now, traders are over-leveraged at $0.908, where bulls have built significant long positions worth $22.40 million. Meanwhile, short sellers appear to be over-leveraged at the $1.02 mark, with $3.87 million worth of short positions.

Cardano (ADA) Price Prediction For January 12
Source: Coinglass

This liquidation data indicates that traders are strongly bullish, which might explain the substantial bets on long positions.

Current Price Momentum 

Currently, ADA is trading near $0.999 and has experienced an upside momentum of over 7.5% in the past 24 hours. Despite the shift in market sentiment and the breakout, ADA’s trading volume has dropped by 44% during the same period, indicating lower participation from traders and investors.

Source link

12 01, 2025

Gold Price Forecast: XAU/USD Bulls Charge Resistance

By |2025-01-12T00:19:53+02:00January 12, 2025|Forex News, News|0 Comments


Gold Technical Forecast: XAU/USD Weekly Trade Levels

  • Gold prices rebound from multi-year trend support- marks second weekly advance
  • XAU/USD rally within striking distance of key resistance- U.S. CPI on tap next week
  • Resistance 2736/47 (key), 2804, 2900– Support 2607, 2532, 2450/82 (key)

Gold prices closed a fourth consecutive daily advance on Friday with the post-NFP rally posting a weekly advance of nearly 1.9%. A rebound off slope support is attempting to mark resumption of the broader uptrend with key resistance now in view. Battle lines drawn on the XAU/USD weekly technical chart.

Review my latest Weekly Strategy Webinar for an in-depth breakdown of this gold setup and more. Join live on Monday’s at 8:30am EST.

Gold Price Chart – XAU/USD Weekly


Chart Prepared by Michael Boutros, Sr. Technical Strategist; XAU/USD on TradingView

Technical Outlook: In my last Gold Weekly Price Forecast we noted that the XAU/USD was, “trading into a multi-year slope support into the start of the December and the focus is on a reaction off the median-line early in the month. From a trading standpoint, the focus remains on a breakout of the 2607-2736 range for near-term directional guidance.” A two-week advance has now rallied more than 4.4% off the December lows with a rebound off the median-line now threatening a stretch towards uptrend resistance.

The focus is on the record high-week close / 2024 high-close at 2736/47– a breach / close above this threshold is needed to mark uptrend resumption towards subsequent resistance objectives at the 2.618% extension of the 2022 range-break at 2804 and the 2900. The next major technical confluence is eyed at 3000/31– a region defined by the 2.272% extension of the 2011 decline and the 1.618% extension of the 2022 advance. Look for a larger reaction there IF reached.

Initial weekly support rests with the median-line and is backed closely by the 61.8% retracement at 2607– a break / weekly close below this threshold would suggest a larger correction is underway within the broader uptrend with initial support objectives seen at the August high at 2531 and 2450/82– a region defined by the April swing high and the 38.2% retracement of the 2024 trading range. We will reserve this threshold as our bullish invalidation level and losses would need to be limited to this slope for the late-2023 uptrend to remain viable.

Get our exclusive guide to gold trading in 2025

Bottom line: Gold has rebounded off uptrend support into the start of the month with the advance now within striking distance of pivotal resistance. From a trading standpoint, look to reduce portions of long-exposure / raise protective stops on a stretch towards 2736- losses should be limited the median-line IF price is heading higher on this stretch with a breach above the high-close needed to mark uptrend resumption.

Keep in mind we get the release of key US inflation data next week with the Consumer Price Index (CPI) on tap Wednesday. Stay nimble into the release and watch the weekly closes here for guidance. Review my latest Gold Short-term Outlook for a closer look at the near-term XAU/USD technical trade levels.

Key US Economic Data Releases

 Gold Economic Calendar-XAU USD Key Data Releases-GLD Weekly Event Risk-1-10-2025

Economic Calendar – latest economic developments and upcoming event risk.

Active Weekly Technical Charts

— Written by Michael Boutros, Sr Technical Strategist with FOREX.com

Follow Michael on X @MBForex


Source link

Go to Top