About Editorial team of BIPNs

Main team of content of bipns.com. Any type of content should be approved by us.
1 01, 2025

Bitcoin Price Prediction for Today, December 31 – InsideBitcoins

By |2025-01-01T10:39:50+02:00January 1, 2025|Crypto News, News|0 Comments

Join Our Telegram channel to stay up to date on breaking news coverage

The Bitcoin price prediction is currently moving bearishly and seems to be preparing for the next move below the support level of $92,000.

Bitcoin Prediction Data:

  • Bitcoin price now – $92,853
  • Bitcoin market cap – $1.85 trillion
  • Bitcoin circulating supply – 19.8 billion
  • Bitcoin total supply – 19.8 billion
  • Bitcoin Coinmarketcap ranking – #1

Bitcoin (BTC) exemplifies the transformative potential of early adoption in crypto projects. With a 24-hour price range of $91,317.14 to $94,903.32, BTC remains a powerhouse in the market. From its all-time low of $0.08761 in July 2010, BTC has soared by a staggering +190,696,669.81%, cementing its status as a revolutionary investment. Though currently -14.32% below its all-time high of $108,268.45 reached on December 17, 2024, Bitcoin’s unparalleled rise demonstrates the immense opportunities in getting in early on game-changing technologies.

BTC/USD Long-term Trend: Bullish (Daily Chart)

Key levels:

Resistance Levels: $105,000, $110,000, $115,000

Support Levels: $80,000, $75,000, $70,000

BTCUSD – Daily Chart

In the current market conditions, Bitcoin’s performance against the USD reflects a mix of reduced trading activity and evolving sentiment as we navigate the post-holiday period. As of now, the broader market remains heavily correlated, suggesting a unified response to external influences. Although the overall trading volume has shown a 60% increase, it remains significantly lower than the levels seen in prior weeks. This suggests that while there is renewed interest, the market is still lacking the robust participation required for a substantial bullish move.

Bitcoin Price Prediction: Bitcoin (BTC) May Face the Downside

BTC/USD is seen hovering at $92,853, with the current consolidation pattern, the king coin remains below the 9-day and 21-day moving averages. Though Bitcoin (BTC) begins the day off intending to trend higher but couldn’t. Meanwhile, any bullish cross above the 9-day and 21-day moving averages could hit the nearest resistance level of $93,000. Beneath this, other supports could be found at $80,000, $75,000, and $70,000.

Moreover, the Bitcoin price is likely to slide below the lower boundary of the channel as the technical indicator 9-day moving average (MA) remains below the 21-day moving average (MA). On the next positive move, BTC could break to the upside as the candle is yet to close. Therefore, if the bulls push the king coin to the north, the potential resistance levels could be found at $105,000, $110,000, and $115,000.

BTC/USD Medium-term Trend: Bearish (4H Chart)

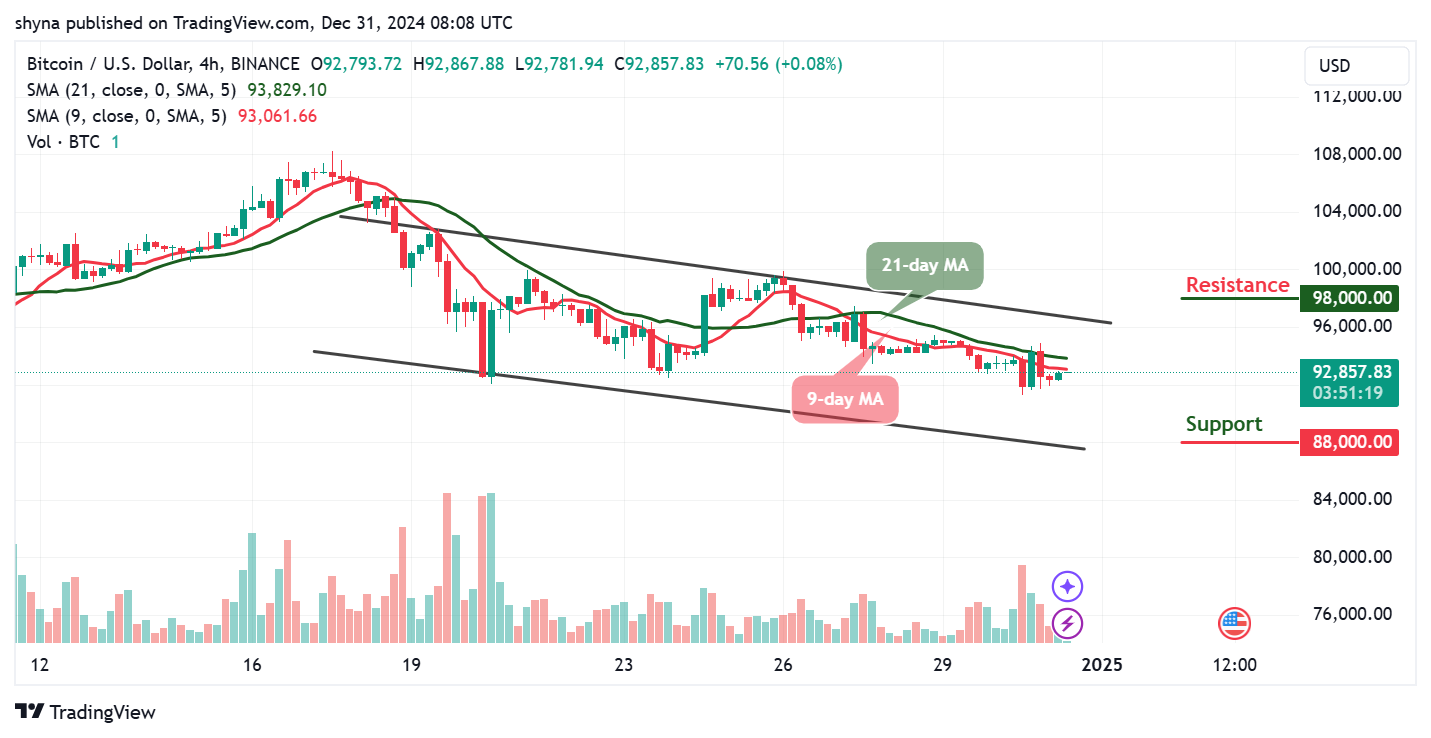
The 4-hour chart for Bitcoin (BTC) against the US Dollar shows the price moving within a descending channel, reflecting a short-term bearish trend. The resistance level is marked at $98,000 and above, while support is established at $88,000. Currently, BTC is trading at $92,857, slightly below the midpoint of the channel. The 9-day and 21-day Moving Averages (MAs) indicate ongoing bearish momentum, as the 9-day MA is below the 21-day MA. This alignment reinforces the current downward trend, but the recent consolidation near $92,800 suggests that the price may be stabilizing in preparation for a potential breakout.
Bitcoin Price Prediction for Today, December 31 – BTC Technical AnalysisBitcoin Price Prediction for Today, December 31 – InsideBitcoins
BTCUSD – 4-Hour Chart

Nevertheless, if the price manages to hold above the $92,000 level, a bullish breakout could occur, pushing the price toward the $94,000 – $96,000 zone, with the channel’s upper resistance at $98,000 as the next major target. On the downside, if selling pressure intensifies and the price breaks below $92,000, BTC could test the lower boundary of the channel near $88,000 and below. Volume fluctuations and interactions with the moving averages will be key indicators to watch, as they may confirm the likelihood of a reversal or continuation within the descending channel.

Crypto analyst @GoingParabolic, boasting over 248k followers on X (formerly Twitter), has observed that $BTC has re-entered the accumulation zone. In their view, a few weeks of consolidation could pave the way for a significant breakout, with a target of $131.5K+ by Q1 2025 appearing inevitable.

Bitcoin Alternatives

Bitcoin’s potential for a bullish breakout hinges on factors like increased trading volume, renewed interest from U.S. investors, and improved market sentiment, though the current low activity and reduced volume suggest stronger catalysts are needed to drive sustained momentum. In contrast, Wall Street Pepe has emerged as a standout in the cryptocurrency space, defying the broader market slowdown by raising nearly $39 million in its presale phase, with impressive daily contributions of $500,000 – double the early performance of Pepe Unchained.

Wall Street Pepe Is Number One On This List – Should Be The Best Token To Buy Now For Gains In 2025

Wall Street Pepe combines the excitement of meme culture with powerful trading tools, offering features like signals, insider groups, and staking rewards to support informed investment decisions. Backed by a vibrant community and launching during the crypto bull run, it’s positioned for significant growth. With its innovative approach and early momentum, Wall Street Pepe presents a unique opportunity to join a project redefining the future of meme coins.

Visit Wall Street Pepe

Related News

Newest Meme Coin ICO – Wall Street Pepe

Wall Street PepeWall Street Pepe

  • Audited By Coinsult
  • Early Access Presale Round
  • Private Trading Alpha For $WEPE Army
  • Staking Pool – High Dynamic APY

Wall Street PepeWall Street Pepe


Join Our Telegram channel to stay up to date on breaking news coverage


Source link

1 01, 2025

USANA’s $205M Majority Stake In Hiya Brings ‘Kidsperience’ And Direct-To-Consumer Sales

By |2025-01-01T08:41:09+02:00January 1, 2025|Dietary Supplements News, News|0 Comments


Source link

1 01, 2025

Solana Price Prediction 2025-2030: Will SOL Reach $500

By |2025-01-01T08:39:10+02:00January 1, 2025|Crypto News, News|0 Comments

Solana (SOL) has been hailed as one of the strongest contenders in the cryptocurrency market, often referred to as the “Ethereum Killer” due to its fast transactions and lower fees. However, with the cryptocurrency market’s volatility, questions like “Will Solana’s price hit $500?” and “How high can Solana go?” continue to linger among investors. Currently priced around $192, SOL has experienced significant growth, but it’s also seen a notable pullback from its all-time high (ATH) of $264 in late 2024.

Solana Price Forecast for 2025

Looking ahead to 2025, Solana has the potential to make considerable strides. Analysts predict that the continued expansion of Solana’s ecosystem and the approval of a Solana ETF could push the price toward new heights. If the bull market supports the altcoin season, SOL might breach its current ATH and hit a high of $400 by the end of 2025. However, market volatility could pull the price back down to a low of $250 if regulatory concerns or network issues arise. Considering these dynamics, the average price of SOL in 2025 could stabilize around $325.

Solana Price Prediction 2025:

  • Potential Low: $250
  • Potential Average: $325
  • Potential High: $400

Solana Price Projection for 2026-2030

As Solana continues to grow and gain traction in the decentralized finance (DeFi) space, its price is expected to maintain a bullish trajectory. Here’s a look at Solana’s projected price range from 2026 to 2030.

2026: $310 to $510

By 2026, Solana’s price could see steady growth, with a potential low of $310. Factors such as more DeFi projects using Solana’s blockchain, an expanding ecosystem, and increased demand for SOL could push the price to a high of $510 by the end of 2026. The average price for the year is expected to settle around $410.

2027: $389 to $623

In 2027, Solana is projected to build on its momentum. The price could dip to $389 in unfavorable market conditions, but the growing interest in Solana’s blockchain could drive the price up to $623. With an increasing number of decentralized applications (dApps) built on Solana, the price could average around $506 for the year.

2028: $476 to $769

By 2028, the price of Solana might continue its ascent. With the blockchain becoming a go-to platform for decentralized applications, Solana’s price could reach as high as $769. However, it might encounter a low of $476, depending on market factors. The average expected price for 2028 is projected to be $622.

2029: $597 to $948

Looking to 2029, Solana’s price could potentially reach $948, with a low of $597. As Solana’s position in the blockchain space strengthens and more projects adopt its technology, SOL could experience substantial growth, settling around $772 on average.

2030: $716 to $1,351

By 2030, Solana could see a significant rise, reaching a potential high of $1,351. The ongoing development in the Solana ecosystem, along with increased mainstream adoption, could push the price of SOL up, with a potential low of $716. The average price of SOL in 2030 could be around $1,033, positioning it as one of the leading cryptocurrencies in the market.

Market Analysis and Predictions

Several analysts and market experts have offered varying predictions for Solana’s future. Raoul Pal, founder of Real Vision, has been particularly bullish on Solana, suggesting that the cryptocurrency could experience a 20x rally due to its advanced blockchain technology and the growing interest in its ecosystem. He believes that Solana’s potential for scalability and its decentralized nature make it a strong competitor in the blockchain space, potentially driving its price above $400 in the coming months.

On the other hand, platforms like Changelly and Coincodex have provided more conservative predictions. Changelly forecasts Solana’s price at around $228 in 2025, while Coincodex predicts a price of $291.49 for the same period. Despite these variations, the overall sentiment is positive, with expectations that Solana’s price will continue to appreciate over the long term.

Is Solana a Good Investment?

Considering the developments in the Solana ecosystem, its low transaction fees, and high-speed processing, Solana remains a promising investment for the long term. The rise of DeFi and decentralized applications (dApps) on Solana’s blockchain will likely contribute to sustained demand for SOL, supporting its price growth in the coming years.

Conclusion

Solana’s future is looking bright, with strong growth potential over the next few years. From 2025 to 2030, SOL could see significant price increases, potentially reaching as high as $1,351 by 2030. While volatility is always a risk in the crypto market, Solana’s robust ecosystem, advanced technology, and growing adoption position it well for long-term success. Whether SOL hits $500 or not, it’s clear that Solana has a promising future ahead, and investors will likely continue to watch its growth closely.


Post Views: 3

Source link

1 01, 2025

Gold (XAU/USD) Price Analysis: Will Prices Continue to Soar in 2025?

By |2025-01-01T07:53:24+02:00January 1, 2025|Forex News, News|0 Comments


  • Gold prices on course to end 2024 with a 27% gain, the best yearly performance since 2010.
  • 2025 outlook is positive due to geopolitical risks, central bank buying, and safe-haven demand.
  • Trump administration policies present both risks and opportunities for gold prices.
  • Technical analysis shows potential for further gains, but a deeper correction before reaching new highs is possible.

Most Read: EUR/USD Tug-of-War Continues, US Dollar Index (DXY) Steady

Gold prices slipped yesterday as a stronger US Dollar, anticipation of a hawkish Fed and thin liquidity all contributed. Uncertainties around tariffs and challenges in 2025 are keeping the precious metals appeal going for now and capping further losses.

Gold prices are on track to end the year with a remarkable 27% increase, marking their best yearly performance since 2010.

Currency Strength Chart: Strongest – Weakest – JPY, GBP, EUR, AUD, CHF, USD, NZD, CAD – 

Source: FinancialJuice (click to enlarge)

2025 Outlook For Gold

Looking at the year ahead and 2025 and it will no doubt be interesting. Geopolitical risk remains a threat with the Middle East still on edge and the Russia-Ukraine situation no closer to a resolution. Just yesterday there were rumors that a proposal by the incoming Trump administration to delay Ukraine joining NATO by 10 years will not be accepted by the Kremlin.

Anyone with knowledge of the situation there will know that this will not change as the main reason for the conflict (at least from a Russian perspective) is Ukraine joining NATO. These developments are likely to keep some geopolitical risk premium in play and keep safe haven demand going. 

Global Central Banks were one of the main drivers of the Gold price rise in 2024. This is expected to continue in 2025. The World Gold Council survey revealed in the second half of 2024 that Central Banks are likely to purchase more Gold in the next 12 months. This should further bolster demand for the precious metal.

When it comes to risks affecting Gold prices moving forward, it does get challenging. The reason for this is the incoming Trump administration is expected to do good things for the economy but some policies could lead to higher interest rates. This could weigh on Gold prices. 

This is a double-edged sword however, in that the increased risk of uncertainty from Trump policy and concern around the impact of tariffs could actually bolster the demand for safe haven assets and thus Gold. 

All in all analysts are largely pricing in further gains for the precious metal in 2025, personally I do see the potential for upside as well. However, I would not rule out a deeper correction before price does actually breach the current ATH resting around the 2790 handle. 

The Week Ahead

Today could potentially be a slow day with the New Years holiday tomorrow. In such a case we could see a similar repeat to yesterday’s price action with a slow grind to the downside.  

The holiday tomorrow will be followed by a return on Thursday January 2, 2025 which could bring about some volatility to markets as liquidity is expected to start returning to normal. Friday brings the last piece of high impact data from the US with the ISM Manufacturing PMI release.

The data is unlikely to change the overall narrative of the USD and thus any moves inspired by the data is likely to remain short-lived. 

Gold (XAU/USD) Price Analysis: Will Prices Continue to Soar in 2025?

For all market-moving economic releases and events, see the MarketPulse Economic Calendar.

Technical Analysis Gold (XAU/USD)

From a technical analysis standpoint, this analysis is a follow up from the technicals last week. Read: Gold (XAU/USD) Technical Analysis: Bullish Structure Emerges

Gold appeared poised for a move higher last week and it very much obliged. The precious metal ran into the first key area of resistance around the 2639 before falling to close the week around 2620.

The two-hour chart below shows the clear change in structure after topping out at 2639 on December 26. Since then, price has printed a series of lower highs and lower lows, breaching the 2600 psychological level briefly yesterday. 

There is a descending trendline in play on the two-hour chart with a candle break and close above the trendline potentially leading to a retest of 2639.

A break below the $2600 handle may find support at the long-term ascending trendline which rests around the 2592-2596 range. 

Gold (XAU/USD) Two-Hour (H4) Chart, December 31, 2024

Source: TradingView (click to enlarge)

Support

Resistance

Follow Zain on Twitter/X for Additional Market News and Insights @zvawda

Content is for general information purposes only. It is not investment advice or a solution to buy or sell securities. Opinions are the authors; not necessarily that of OANDA Business Information & Services, Inc. or any of its affiliates, subsidiaries, officers or directors. If you would like to reproduce or redistribute any of the content found on MarketPulse, an award winning forex, commodities and global indices analysis and news site service produced by OANDA Business Information & Services, Inc., please access the RSS feed or contact us at info@marketpulse.com. Visit https://www.marketpulse.com/ to find out more about the beat of the global markets. © 2023 OANDA Business Information & Services Inc.


Source link

1 01, 2025

Tea leaves being wasted in absence of processing plant

By |2025-01-01T02:38:09+02:00January 1, 2025|Dietary Supplements News, News|0 Comments


By Hari Prasad Koirala,Urlabari, Jan.1 : In the absence of a plant to process green tea leaves, the green leaves of farmers in the area of Laligurans Municipality of Tehrathum are being wasted on the tree.

Singhadevi Tea Producers’ Cooperative Ltd., located in Sansare of Laligurans Municiplaity-9, has cultivated tea on 1,200 ropanies of land. The green leaves grown by 200 farmers, including 145 farmers affiliated with the cooperative, have been wasted due to the lack of a plant to process the tea leaves.

Since 2075 B.S., farmers who have been cultivating tea commercially have been operating a plant to process 250 kg of green leaves daily through the cooperative. However, the cooperative needs a plant to process 1,000 kg of green leaves daily. 

Chairman of the cooperative Tek Bahadur Magar said, “16,000 kg of tea (green tea, golden tea, silver tea, black tea) is produced by processing 80,000 kg of green leaves annually. There are 10 workers in the factory.”

Despite having abundant raw materials, the raw materials are being wasted due to the lack of a processing plant, he said. 

“All the tea produced is exported to India and third countries,” he said, adding that demand for tea, which is being sold at Rs. 300 to Rs. 3,500 per kg, is high. “However, we have not been able to process it according to the demand,” he said. 

Manager of the cooperative Bir Bahadur Basnet said that they have not used pesticides in the tea for 10 years. 

“As it is pure organic tea, there is no problem of market. There is pressure to purchase the tea produced in other municipalities as well. We have not been able to process the green leaves produced by our own members. How can we buy from neighbouring municipalities,” Basnet said.

Tea is being cultivated on around 150 ropanies of land in Chhathar Rural Municipality, on 75 ropanies of land in Jirikhimti and on 100 ropanies of land in Sakdina. The farmers there have not picked tea leaves for a few years.

Meanwhile, the Koshi Province government has allocated Rs. 2 million as a conditional grant to set up a new plant. 

Santosh Ghimire, Chief Administrative Officer of Laligurans Municipality, said, “The province has started the process of purchasing the plant through the municipality. “We have started the work in a fast-track manner to process the green leaves produced in March.” Ghimire said that if two plants are installed, the wasted green leaves can be processed.

How did you feel after reading this news?


Source link

1 01, 2025

Cardano (ADA) Price Prediction: Bearish Short-Term, Bullish Long-Term

By |2025-01-01T02:36:08+02:00January 1, 2025|Crypto News, News|0 Comments

Cardano (ADA), one of the most well-known cryptocurrencies, continues to face challenging market conditions as we approach the end of 2024. Despite its solid fundamentals, the token has been struggling to gain upward momentum, with many other major cryptocurrencies like Bitcoin (BTC), Ethereum (ETH), and Solana (SOL) also experiencing declines. This has led to a prevailing bearish sentiment in the broader market, and Cardano is no exception, with its price expected to potentially drop further in the near term.

Market Sentiment and Current Price Action

As of December 31, 2024, ADA is facing significant selling pressure, with traders concerned about ongoing market uncertainty. Currently, ADA is trading at around $0.845, marking a drop of more than 3% in the last 24 hours. The current technical indicators suggest that ADA could continue its downward movement, especially if it fails to hold the critical support levels.

The broader cryptocurrency market remains neutral-to-bearish, with many assets struggling to find solid ground. This is largely due to external factors like regulatory challenges, ongoing geopolitical tensions, and a lack of major catalysts driving bullish action.

Cardano’s Short-Term Price Prediction

The short-term outlook for ADA suggests that the price could continue its descent. The most recent technical analysis reveals the formation of a descending triangle pattern on the daily chart. This bearish pattern typically signals a continuation of downward momentum if the price fails to break above the descending resistance line. ADA has recently broken below the support of a head-and-shoulders formation, which further strengthens the case for additional declines.

If ADA’s price closes a daily candle below the key level of $0.825, there’s a strong possibility it will decline further, potentially reaching as low as $0.75. This would represent a 10% drop from its current price. The breakdown of such important support levels could cause further panic among traders, driving the price lower.

However, there is still a glimmer of hope for ADA in the long term. As it stands, the price is hovering near the important $0.825 mark, and a bounce from here could set the stage for a reversal. If ADA manages to reclaim this level and maintain a positive daily close above it, it could stabilize and eventually mount a recovery.

On-Chain Data and ADA Outflows

Despite the bearish technical outlook, Cardano continues to show strong long-term potential. On-chain data from Coinglass reveals a notable outflow of ADA tokens from exchanges. This suggests that investors are taking a long-term view and removing their assets from exchanges, potentially to hold them for the future. In total, over $38 million worth of ADA has been withdrawn from exchanges recently.

The outflow of ADA indicates that long-term holders are not selling in the face of market pressure, and this can be interpreted as a sign of confidence. Investors who believe in the long-term success of Cardano may view these price declines as buying opportunities, positioning themselves for potential gains once the market turns bullish again.

In contrast, shorter-term traders seem hesitant, with the increased volatility and uncertainty in the market leading to liquidation of long positions. Data also shows a drop in ADA’s open interest by 3.9% in the past 24 hours, reflecting the cautious approach of market participants at present.

Looking Ahead: What’s Next for ADA?

For now, the focus is on whether ADA can maintain its crucial support levels and prevent further losses in the short term. Should the price fail to defend the $0.825 support, the next target could be the $0.75 region. However, long-term holders’ actions suggest a belief that ADA has greater potential once the broader market conditions improve.

For those looking at Cardano for long-term investments, these price drops may present an opportunity to buy at lower levels before a potential recovery. While the immediate future for ADA may appear bearish, the token’s fundamentals remain strong, and its community continues to innovate within the blockchain space. As the year closes, the narrative surrounding Cardano’s potential is one of patience, with many waiting for a market turnaround in 2025.

In conclusion, while the short-term outlook for ADA remains cautious, the long-term potential continues to shine through. If ADA manages to weather the storm of this bearish trend, it could see a solid rebound in the coming months as market conditions improve. As always, investors should remain vigilant and be prepared for volatility in this unpredictable space.


Post Views: 3

Source link

1 01, 2025

Natural Gas Price Forecast: Faces Pressure After Reaching Key Resistance Levels

By |2025-01-01T01:50:29+02:00January 1, 2025|Forex News, News|0 Comments


Bearish Price Action

Today’s bearish price action follows signs of resistance seen yesterday after the 4.20 trend high was reached. Once reached sellers took back control and dropped natural gas to end the day a little below the halfway point of the day’s price range and below the prior trend high at 4.01. That is not bullish price action following a new trend high and it was further indicated today.

Top Channel Line Resistance

Resistance was seen yesterday around the top parallel line of a rising trend channel. Given the subsequent bearish reaction there is the potential for the price of natural gas to eventually target the lower channel line. The line starts from the April 2024 bottom. Of course, that line is quite a way down. Whether it is reached or not, it provides supporting technical clues for a possible bearish correction that may see natural gas fall through key support levels.

Moving Average Support at 20-Day Line

If weakness persists a test of support around the 20-Day MA at a minimum, now at 3.42, looks likely. It can be watched along with the nearby rising trendline. Although the 20-Day line has reflected support on several days recently due to daily closes above the 20-Day line, the line was breached earlier in each relative trading session. Maybe this time natural gas falls below the 20-Day MA but does not recover within the same day to close above the line. That might be a change in character, and if it happens the recent 3.29 swing low will be at risk of being broken.

Bearish Weekly Pattern Forming

A bigger concern is reflected in the developing weekly chart (not shown). If natural gas stays weak or weakens into this week’s close it is set to leave a bearish shooting star candlestick pattern. Given that it occurred following a successful of resistance at the top of the rising trend channel, is the market’s way of telling us to pay attention.

For a look at all of today’s economic events, check out our economic calendar.


Source link

1 01, 2025

EUR/USD Analysis Today 31/12: Ends 2024 Weak (Chart)

By |2025-01-01T00:39:46+02:00January 1, 2025|Forex News, News|0 Comments

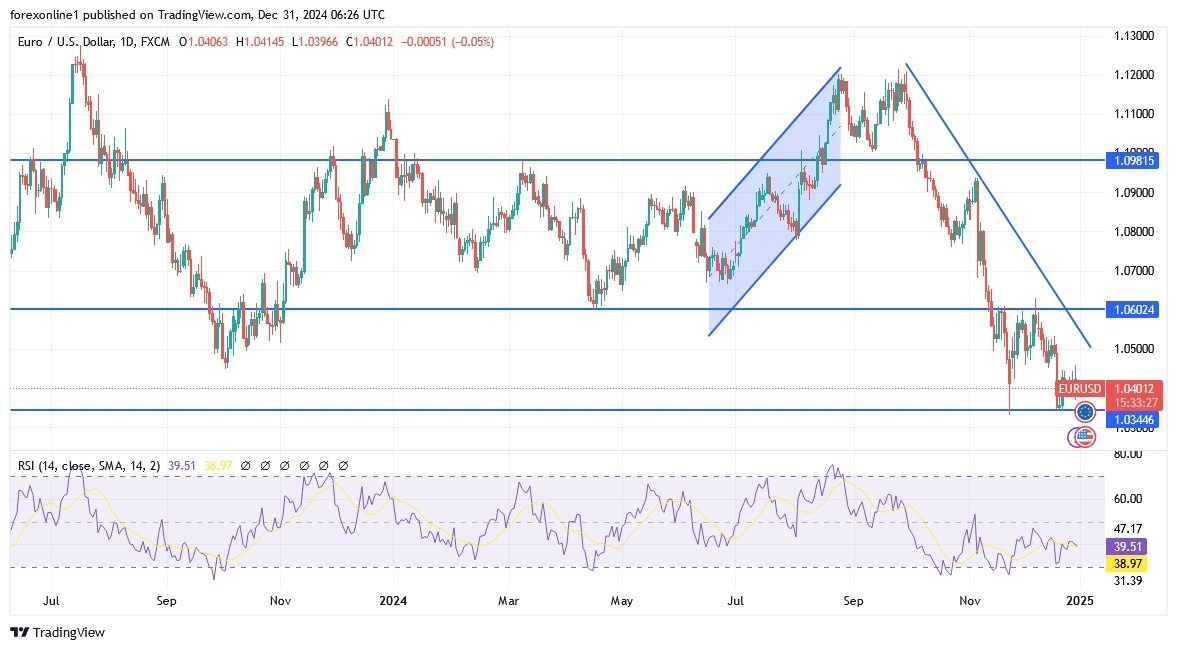
  • Bulls failed again to push the EUR/USD price higher in the last trading of 2024 as it tried to rebound towards the resistance level of 1.0458.
  • With no strength factors, the EUR/USD price returned in its broader downward path, settling down around the support level of 1.0372, near its lowest in two years.
  • Furthermore, the recent gains of the euro came with temporary momentum after the announcement of stronger-than-expected Spanish inflation figures. But why Spain?

According to economists, the inflation process is moving faster in Spain compared to other Eurozone countries. Therefore, this data will confirm the assessment of a member of the European Central Bank’s Governing Council who confirmed that the next interest rate cut by the ECB may take longer after the recent rise in inflation.

Euro Dollar losses may continue in 2025

Forecasts from forex market analysts indicate that the performance of the EUR/USD pair during January 2025 will continue the current downward trend. Experts believe that January is historically negative for the performance of the euro against the US dollar. In addition, the US dollar finds strength factors at the same time, which ensures stronger downward breakouts for the euro dollar in the coming days.

Trading Tips:

The recent performance confirms the strength of our technical view of the Euro that it will remain under downward pressure and any attempts to rebound upwards may be temporary

US Stock Markets May Close for an Exceptional Event

The US stock markets have been officially announced to close on January 9, 2025, in celebration of a National Day of Mourning for former US President Jimmy Carter. In this regard, the companies listed on the market said that the New York Stock Exchange and the US stock exchanges of Nasdaq and CBOE Global Markets will be closed. For its part, CME Group, the operator of stock markets and interest rates in the United States, has not yet commented on its plans. Meanwhile, the US bond market will close at 2pm New York time, as recommended by the Securities Industry and Financial Markets Association. Generally, the closures are part of a long-standing US tradition where financial institutions cease operations after the death of a US president.

EUR/USD Analysis Today:

The broader trend of the EUR/USD pair remains downward. Clearly, the chances of the EUR/USD moving towards parity are strong if the factors of euro weakness persist. Meanwhile, the US dollar price remains supported by Trump’s trade and the demand for it as a safe haven. Technically, the gains made by the EUR/USD pair raised the exchange rate above its nine-day exponential moving average (EMA), which represents the first truly positive technical development in some time. If the EUR/USD pair closes above this indicator – which is currently at 1.0432 – further gains could take it into the first week of January 2025. However, this will not be until next Friday when the first real test of important economic data for 2025 comes in the form of the first US non-farm payrolls report for the year.

The broader expectation is that the report will show continued strength in the US labour market, justifying the Federal Reserve’s decision to pause US interest rate hikes. However, the biggest surprise would be a weaker-than-expected US jobs number, which could lead to a decline in the US dollar. Moreover, given all the survey evidence we see, this is unlikely, and the US dollar’s ​​superiority could extend.

Ready to trade our EUR/USD Forex analysis? We’ve made a list of the best forex demo accounts worth trading with. 

Source link

1 01, 2025

Why Experts Say This Underrated Supplement Is Key To Building Muscle And Strength

By |2025-01-01T00:36:47+02:00January 1, 2025|Dietary Supplements News, News|0 Comments


Can Amino Acid Supplements Help You Build Muscle? JOE LINGEMAN

“Hearst Magazines and Yahoo may earn commission or revenue on some items through these links.”

There are about as many performance supplements on the market as there are protein-packed foods in a WH editor’s fridge. (Hint: It’s a lot.) A biggie as of late? Amino acids, which are the building blocks of protein.

The 11 amino acids our bodies synthesize are called “nonessential,” but we need nine others (known as “essential”) to survive. These supps contain “one or more of the essential amino acids your body doesn’t produce on its own,” says Adam Field, PhD, a lecturer in sport and exercise sciences at Manchester Metropolitan University in England. (BTW, they’re not the same as protein powders, says Kelly Jones, RD, a board-certified sports dietitian and founder of Kelly Jones Nutrition based in Newtown, Pennsylvania.)

Meet the experts: Adam Field, PhD, is a lecturer in sport and exercise sciences at Manchester Metropolitan University in England. Kelly Jones, RD, is a board-certified sports dietitian and founder of Kelly Jones Nutrition based in Newtown, Pennsylvania. Dana White, RD, is a registered dietitian and an athletic trainer who specializes in sports nutrition based in Fairfield, Connecticut.

Not only are amino acid (AA) powders said to pack a serious punch when it comes to building and repairing muscle, but AAs are also integral to bone health, pH balance, and more.

Ahead, experts reveal which claims hold up, as well as who can actually benefit from adding this boost to their arsenal.

Amino acid supplements help you create and maintain muscle.

Many people consume amino acids to support growth in muscle mass and strength. But get this: “They increase the quality of the muscle you build as opposed to just the [size of the] actual muscle itself,” says Field—meaning each individual muscle fiber tends to be stronger from taking AAs.

FYI, for muscle and workout perks, shop for a product containing the three branched-chain amino acids (BCAAs): leucine, valine, and isoleucine. BCAAs, particularly leucine, are especially useful when it comes to muscle growth, according to research in Nutrients.

They play a role in fixing muscle damage and soreness.

Adequate intake of BCAAs facilitates muscle repair. Healing can take a few days, so having enough BCAAs to optimize muscle protein synthesis makes your muscles’ active-recovery window more efficient—meaning you recover faster, says Jones.

The kicker: BCAAs are most effective when consumed with protein and carbs. BCAAs alone can’t help your body synthesize protein; they have to be consumed with the other essential amino acids to complete the job. Plus, muscles need carbs for repair because they provide energy for the process. Without a carb, an isolated AA “is not going to have the most powerful benefit in recovery,” says Dana White, RD, a registered dietitian and an athletic trainer who specializes in sports nutrition based in Fairfield, Connecticut. (Try adding a BCAA powder to an electrolyte sports drink, like those from Skratch Labs, Liquid I.V., or Thorne.)

Who Should Take Amino Acids

Some experts, like Field, feel that “anyone who wants to build muscle would benefit from taking them,” whether they’re a recreational exerciser or a total pro, as Field says. Jones, on the other hand, typically recommends taking them only if you’re engaging in endurance activities lasting two hours or longer.

Other sitches in which you might be a good candidate for an AA supplement: if you have dietary restrictions, such as eating plant-based, or you don’t consume adequate animal protein (which has all essential amino acids).

Regardless, if you’re interested in taking AA supps, talk to your doctor first to make sure it’s safe for you to take them.

Potential risks: Some negative side effects like muscle cramps, facial swelling, and bloating have been reported in relation to medication interactions, as well as for some people with existing health issues. Otherwise, AA supps are generally safe for everyday use, as long as you stick to the serving size.

The Best Amino Acid Supplements To Try

Amino acid complexes are available in powder form, but many brands also offer oral capsules. Choose a product that is third-party tested to ensure the ingredient list is accurate. Look for an informed sports certification, such as NSF Certified for Sport, Jones says. She’s a fan of the brands Thorne, Klean Athlete, and Now Foods:

Amino Complex

Just mix one scoop of the NSF Certified for Sport powder with eight ounces of water daily to help promote muscle growth.

CourtesyCourtesy

Courtesy

$46.00 at amazon.com

Aminos

“All the flavors are delicious, and the individual servings are great for travel,” says Jacqueline Andriakos, WH executive health and fitness director.

CourtesyCourtesy

Courtesy

$49.45 at amazon.com

Branched-Chain Amino Acid Powder

The flavorless powder blends seamlessly into smoothies and shakes for a pre- or post-workout pick-me-up.

CourtesyCourtesy

Courtesy

$26.70 at amazon.com

What’s the difference between amino acid supplements and protein powder?

Unlike protein powders, which generally contain all of the essential amino acids and are comparable to what you would consume in a meal, AA powders offer aminos in isolated forms—with just one or a few. This means you can tailor your supplement intake to your specific goal (say, hypertrophy or a jolt of energy right before that bike race training workout).

Plus, consuming protein powder before or during an intense sweat sesh might also cause problems such as GI distress, since it can be too filling for some people doing long, intense workouts. In such cases, a BCAA powder may be more suitable.

Already have a protein powder that works for you? No need to add on an amino acid complex, since your powder has you covered.

You Might Also Like


Source link

1 01, 2025

Bearish Momentum and Possible Rebound

By |2025-01-01T00:35:17+02:00January 1, 2025|Crypto News, News|0 Comments

XRP, the native token of Ripple Labs, continues to face significant downward pressure. On December 31, XRP’s price dropped 2.62%, reaching $2.02. While the broader cryptocurrency market is also experiencing a downturn, XRP’s technical and on-chain indicators suggest that further declines could be on the horizon. Analysts are predicting a possible 10-12% drop, with XRP potentially reaching the $1.83 support level in the short term.

XRP Faces Continued Bearish Sentiment

The overall market sentiment for XRP remains bearish as we approach the end of 2024. Despite the popularity and utility of XRP in cross-border payments, the cryptocurrency has struggled to maintain its upward momentum. XRP’s price has recently broken out of a descending triangle pattern, signaling that the market sentiment is shifting towards a more bearish outlook. This technical breakdown has fueled expectations that the price could continue to decline unless a reversal occurs.

Technical Analysis: Support Levels and Key Indicators

According to expert technical analysis, XRP has retested its breakdown level, which further supports the possibility of continued price declines. On the daily chart, the recent breakdown of the triangle pattern has led to a shift in market sentiment, with a bearish trend taking hold. XRP’s price has been unable to sustain above key support levels, and the next target appears to be around the $1.83 mark.

The Relative Strength Index (RSI) and Moving Average Convergence Divergence (MACD) indicators also suggest weakness in XRP’s short-term price action. The RSI is heading towards the oversold territory, which historically indicates that the asset could experience further declines. Similarly, the MACD, which measures the momentum of price movements, is showing weak buying pressure and an increase in selling activity.

If XRP’s price fails to hold the $2.00 support level, a deeper correction toward the $1.83 mark is likely. The next key support zone to watch would be the $1.80 area, which has historically been a significant level for the token.

On-Chain Metrics: Outflow of XRP from Exchanges

Despite the current bearish outlook, there are signs that investors remain optimistic about XRP’s long-term prospects. On-chain data from the analytics firm Coinglass reveals that exchanges have witnessed significant outflows of XRP tokens over the past few days. This means that a substantial amount of XRP is being transferred from exchanges to unknown wallets, potentially indicating that investors are accumulating the asset during the dip.

This on-chain metric suggests that while short-term market sentiment may be bearish, long-term investors are taking advantage of the lower price levels to add to their holdings. This could create buying pressure in the future if the price stabilizes at lower levels.

Increased Trading Volume Amidst Price Decline

XRP’s price decline has been accompanied by a sharp increase in trading volume, which surged by 90% in the past 24 hours. This spike in volume indicates heightened activity in the market as traders and investors react to the price movement. The increase in volume could point to the possibility of more volatility in the coming days, as traders adjust their positions based on short-term market sentiment.

Although this surge in volume could suggest that market participants are actively trading XRP, it also highlights that a portion of the trading activity is driven by panic selling as prices fall. Investors will be keeping a close eye on how the market reacts in the coming days to gauge whether a rebound or further decline is imminent.

The Bigger Picture: XRP’s Long-Term Potential

While the short-term outlook for XRP remains bearish, the cryptocurrency’s long-term potential still holds promise. XRP has consistently been seen as a leading asset in the payments space, offering fast and cost-effective cross-border transactions. Ripple’s ongoing legal battle with the SEC is still a key factor influencing XRP’s price, but investors remain hopeful that a favorable outcome could unlock greater growth and adoption for XRP in the future.

In 2025, if market conditions improve and Ripple’s regulatory issues are resolved, XRP could experience a significant rebound. However, for now, the immediate outlook is cautious, with bearish pressure expected to continue in the short term.

Conclusion: Bearish Short-Term, Bullish Long-Term

As we close out 2024, XRP’s price faces significant challenges, and the short-term outlook remains bearish, with a possible decline to the $1.83 support level. However, the outflow of XRP from exchanges signals that long-term investors remain confident in the asset, viewing the current dip as a buying opportunity. The next few days will be crucial in determining whether XRP can rebound or if it will continue to struggle under bearish pressure.


Post Views: 4

Source link

Go to Top