About Editorial team of BIPNs

Main team of content of bipns.com. Any type of content should be approved by us.
20 12, 2024

USD/JPY Fed Breakout Testing Key Resistance

By |2024-12-20T05:47:29+02:00December 20, 2024|Forex News, News|0 Comments

Japanese Yen Technical Forecast: USD/JPY Weekly / Daily Trade Levels

  • USD/JPY post-FOMC breakout extends more than 6.1% off December low
  • USD/JPY bulls testing major pivot zone at uptrend resistance- US Core PCE on tap tomorrow
  • Resistance 157.16/89 (key), ~159.50s, 160.40/73- Support 151.90-152, ~151.16, 148.73-149.60 (key)

The Japanese Yen is poised to mark a third consecutive weekly decline against the US Dollar with USD/JPY surging to fresh multi-month highs on the back of the Fed rate decision. The rally takes price into a critical pivot zone and while the broader outlook remains constructive, we’re looking for possible inflection here in the days ahead. Battle lines drawn on the USD/JPY weekly technical chart into the close of the year.

Review my latest Weekly Strategy Webinar for an in-depth breakdown of this Yen setup and more. Join live on Monday’s at 8:30am EST.

Japanese Yen Price Chart – USD/JPY Weekly


Chart Prepared by Michael Boutros, Sr. Technical Strategist; USD/JPY on TradingView

Technical Outlook: In last month’s Japanese Yen Technical Forecast we highlighted potential for a larger correction within the September uptrend in USD/JPY while noting that, “From a trading standpoint, look to reduce short-exposure / lower protective stops on a stretch towards 150 IF reached. Ultimately, we are looking for an exhaustion low ahead of 148 for the September rally to remain viable with a breach / close above 154.34 needed to mark uptrend resumption.” Price plunged nearly 5.2% off the November highs with USD/JPY registering an intraday low at 148.64 into the monthly open before rebounding.

The US Dollar is now poised to mark a third consecutive weekly advance with the recovery extending more than 6.1% off the December low on the heels of the FOMC rate decision. The rally takes USD/JPY towards a major resistance hurdle just higher at 157.17/89– a region defined by the 78.6% retracement of the yearly range and the July breakdown close. Note that the 2020 parallel converges on this zone over the next few weeks and further highlight the technical significance of this threshold.

Initial weekly support now rests back at the 1986 low / 1998 & 2022 high at 151.90-152 and is backed closely by the 52-week moving average (currently ~151.16). Broader bullish invalidation now raised to the 2022 high-close / 2023 high-week close (HWC) at 148.73-149.60– a break / close below this threshold would suggest a more significant high is in place / a larger reversal is underway. Ultimately, a break below the 61.8% retracement at 146.29 would be needed to put the bears in control.

A topside breach / close above this key pivot zone exposes subsequent resistance objectives at the upper parallel (blue slope near 159.50s) and the 1990 high / 2024 HWC at 160.40/73. Ultimately, a close above the swing highs at 161.95 would be needed to fuel the next major leg of the multi-year uptrend in USD/JPY (look for a larger reaction there IF reached).

Get our exclusive guide to USD/JPY trading in Q4 2024

Bottom line: The USD/JPY rally is now approaching major technical resistance, and the focus is on possible inflection into this threshold. From a trading standpoint, look to reduce portions of long-exposure / raise protective stops on a test of 157.16/89- losses should be limited to 152 IF price is heading higher on this stretch with a close above this pivot zone needed to mark resumption of the September uptrend.

Keep in mind we get the release of key US inflation data tomorrow with the Consumer Price Expenditure (PCE) expected to show a slight uptick to 2.9% y/y in November. Stay nimble into the release watch the weekly close here for guidance. Review my latest Japanese Yen Short-term Outlook for a closer look at the near-term USD/JPY technical trade levels.

USD/JPY Key Economic Data Releases

Japan US Economic Calendar- USDJPY Data Releases-12-19-2024 

Economic Calendar – latest economic developments and upcoming event risk.

Active Weekly Technical Charts

— Written by Michael Boutros, Sr Technical Strategist

Follow Michael on X @MBForex



Source link

20 12, 2024

JPMorgan Analysts Predict Dogecoin Price To Reach $10, Why Are Crypto Millionaires Buying This Cheap $0.02 Altcoin Instead?

By |2024-12-20T05:45:03+02:00December 20, 2024|Crypto News, News|0 Comments

Amidst the clamor of overhyped tokens and overwhelming speculations, a new altcoin is rising. Priced at an unassuming $0.0234, the WallitIQ (WLTQ) altcoin is more than just a bargain. While the Dogecoin price fluctuates amidst JPMorgan analysts’ bold $10 prediction, many crypto millionaires believe that the WallitIQ (WLTQ) presale altcoin is poised to redefine wealth creation.

Crypto Millionaires Favour WallitIQ (WLTQ) Over Analysts’ Dogecoin Price Prediction 

The crypto market is no stranger to surprises, and a notable shift is currently shaking its foundations. Although JPMorgan analysts are sticking to their ambitious $10 Dogecoin price forecast, the actions of crypto millionaires tell a starkly different story.

Rather than rallying around the JPMorgan analysts’ narrative, these crypto millionaires are investing heavily in WallitIQ (WLTQ), an emerging altcoin priced at mere fractions of a dollar. 

Investors are observing this shift with curiosity and mixed feelings, as these crypto millionaires, who typically look forward to JPMorgan analysts for guidance, are now turning their attention from the Dogecoin price to WallitIQ (WLTQ).

While many crypto millionaires agree that the Dogecoin price may have growth potential, they argue that the JPMorgan analysts’ $10 target is unrealistic. At a price of $10, the Dogecoin price would have a market capitalization that exceeds trillions of dollars, surpassing even Bitcoin’s (BTC) valuation.

JPMorgan analysts have yet to provide convincing evidence to support their price prediction. In contrast, crypto millionaires are certain that WallitIQ (WLTQ), a new altcoin that has raised over $2 million in its presale stage, less than 60% complete, will continue to thrive. 

Highlighting the altcoin’s strengths, the crypto millionaires point to WallitIQ’s (WLTQ) potential to deliver up to $2 million monthly revenue. Moreover, investors who buy the altcoin during its presale stand to gain massive rewards.

Early adopters can earn part of the 20% tokenomics allocation slated to incentivize investors’ participation. By staking their purchased altcoins, investors can enjoy a 180% APR yield, a profit potential far exceeding that of the Dogecoin price and other traditional financial institutions.

In addition, WallitIQ (WLTQ) wallets give investors access to over 1,500 crypto tokens, allowing for easy expansion of their portfolios. 

Payment for access to other premium features, transaction fees, and gas fees can all be managed directly from the investors’ wallets using the native altcoin.

WallitIQ (WLTQ) Emerges As Investors’ Favorite Altcoin 

WallitIQ (WLTQ) has garnered much praise for its future-proof innovation. One notable feature is its AI anomaly detection software, which protects investors’ funds by using machine learning to analyze usage patterns and flag any unusual activity within a wallet.

Moreover, investors benefit from a multilingual AI chatbot that provides instant support for setting up their wallets and addressing transaction issues. 

To equip investors with information needed to be traded efficiently, WallitIQ (WLTQ) provides educational materials that can help investors develop from novices to professionals.

These features continue to boost investors’ confidence and fuel their participation in WallitIQ’s (WLTQ) ongoing presale. Those who have yet to invest in WallitIQ (WLTQ) risk missing out on a lucrative opportunity if they delay.

With WallitIQ’s (WLTQ) smart contract audited by SolidProof, a respected smart contract auditing firm, thousands of investors have taken the bold step of purchasing this $0.0234 altcoin.

Conclusion

Opportunities like this don’t come around often, and many crypto millionaires are determined to profit from the WallitIQ (WLTQ) presale. 

While the mainstream media focuses on the JPMorgan analysts’ Dogecoin price prediction, these crypto millionaires, along with others who are paying attention to the shifting paradigm, are securing their positions in a future defined by the WallitIQ (WLTQ) altcoin. 

Investors who refuse to settle for mediocrity start their journey to transformational wealth should act now and buy WallitIQ (WLTQ) at $0.0243.

Join the WallitIQ (WLTQ) presale and community: 

Join WallitIQ (WLTQ) Presale
Join the WallitIQ (WLTQ) Community

Source link

20 12, 2024

Crude Oil Price Forecast: Tight Range Signals Potential Volatility Ahead

By |2024-12-20T05:07:07+02:00December 20, 2024|Forex News, News|0 Comments


Stuck With Range From 69.42 to 71.41

Two key near-term price levels to watch include potential support around the 20-Day MA, now at 69.42, and resistance at last week’s high of 71.41. Although a decline below the 20-Day line is a sign of weakness, the top trendline is also nearby and can be watched in conjunction with the moving average line as a potential support area. In this case, both moving averages are being used as a guide, but they are within a consolidation pattern, so their current significance is not the same as if crude oil was in a trending environment.

Breakout Above 71.41 Leads to 73.27

If the 71.41 high is exceeded, the November 22 swing high becomes the next target, and it will likely be reclaimed. A breakout above 71.41 would confirm strength and should increase the chance that the price of crude can keep rising. Also, on the larger time frame weekly chart (not shown), the 20-Week MA at 71.35 matches the November high pivot giving it a greater significance if a breakout occurs.

If the 71.41 high is exceeded, then the 50% retracement area at 72.97 would be the next upside target. It matches with the November swing high at 73.27. Further up is the 61.8% Fibonacci retracement at 74.42, followed by the bottom and top boundary lines of a large symmetrical triangle pattern. Around the same price zone is the 78.6% retracement level at 76.47.

Lower Volatility, Leads to Higher Volatility

Since crude has been consolidating recently into a tight trading range, there is the potential for a spike in volatility once the range has been cleared. A somewhat downward bias remains given the series of lower swing highs and the breakdown from a large symmetrical triangle pattern at the beginning of September. The impact of the pattern and breakdown is still being felt given that recent consolidation has occurred below the triangle.

For a look at all of today’s economic events, check out our economic calendar.


Source link

20 12, 2024

EUR/USD Analysis Today 19/12: Nears Parity (Chart)

By |2024-12-20T03:46:06+02:00December 20, 2024|Forex News, News|0 Comments

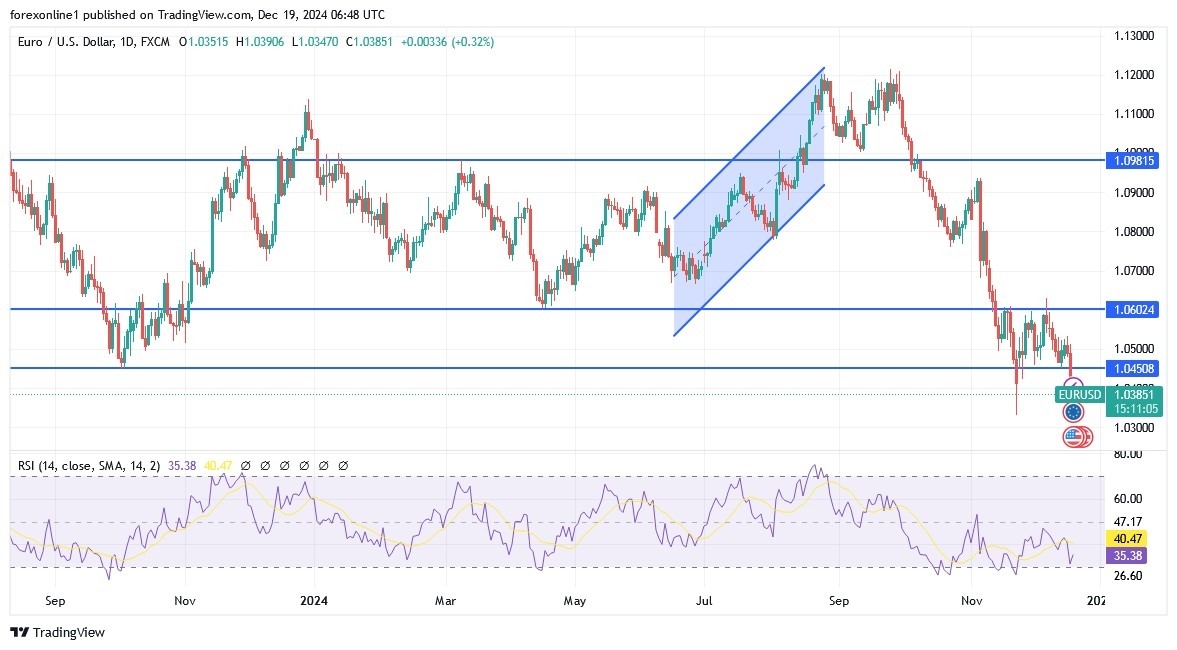
  • The EUR/USD pair has plummeted to a support level of 1.0343, the lowest for the currency pair since November 2022, before stabilizing around 1.0385 at the time of writing this analysis.
  • The performance confirms the strength of the trading strategy that we recommended to our clients which was to sell EUR/USD from every upward level.
  • Selling of EUR/USD increased after the US Federal Reserve hinted that it would be more hawkish in 2025.
  • As we previously predicted, the bank would be wary of Trump’s policies, which typically raise inflation rates in the country.

The US Federal Reserve Cuts Rates but Doesn’t Promise More

According to economic calendar data, the US Federal Reserve cut the federal funds rate by 25 basis points as expected but indicated only 50 basis points of rate cuts for 2025, which is half the cut expected in September. At the same time, the European Central Bank has already cut its main deposit rate four times this year and maintained a cautious stance on further easing. However, many analysts believe that the ECB may need to accelerate policy easing to support the weak Eurozone economy. This disparity was enough to increase EUR/USD selling, and after its recent losses, expectations for the currency pair to move towards parity have strengthened.

The Eurozone Economy Continues to Suffer Economically and Politically

Confirming this, preliminary Purchasing Managers’ Indexes for both manufacturing and services pointed to another, albeit slower, contraction in private sector activity, with Germany and France continuing to perform poorly. Also, Annual inflation rose less than expected to 2.2% from the initial estimate of 2.3%. Adding to the euro’s problems is political uncertainty. In this regard, in Germany, the chancellor lost a vote of confidence in parliament as expected. In France, the new government faces significant challenges, including passing the 2025 budget.

Trading Tips:

The pressure on the euro is strong and may continue for some time, so any rebound upwards may be opportunities to sell the euro again this week, which will be fateful for the euro’s closures in 2024

The Future of Germany’s Exit from the European Union

The leader of the second strongest party in opinion polls in Germany told Bloomberg television in Berlin: “What we need is free trade between European countries, but we don’t need all the bureaucracy.” She has “destroyed the socialist policymaking” in the European Union and “destroyed the market mechanism in Europe.” Alice Weidel, the candidate for chancellor from the far-right Alternative for Germany party, has criticized the European Union for destroying the country’s auto industry and proposed returning the bloc to a free trade area.

In its program for the early elections on February 23, the Alternative for Germany party calls for Germany’s exit from the European Union and the Eurozone. Obviously, this would represent a major shift in German politics and break decades of political and economic integration.

EUR/USD Analysis Today:

According to the performance on the daily chart above, the EUR/USD pair is still in its broader downward trend, and the current move towards the support level of 1.0350 will strengthen expectations for the future of parity between the euro and the dollar in the near future. Especially, as the economic and political problems of the Eurozone countries have worsened. The recent losses of the euro and dollar have pushed some technical indicators to oversold levels, led by the Relative Strength Index (RSI) and the MACD. Meanwhile, currency investors may not care as much about this as they focus on the continued weakness of the currency pair. Currently, the closest support levels for EUR/USD are 1.0330, 1.0250, and 1.0180, respectively. Finally, we still expect any gains for the EUR/USD to be subject to a rapid collapse.

Ready to trade our EUR/USD Forex analysis? We’ve made this forex brokers list for you to check out. 

Source link

20 12, 2024

Bangor Japanese Restaurant In Hot Water For 1700 Violations

By |2024-12-20T03:44:59+02:00December 20, 2024|Dietary Supplements News, News|0 Comments


A well-known Japanese restaurant that sits along Bangor Mall Boulevard is in hot water at the moment for breaking multiple labor laws in the state.

The Bangor Daily News reports that officials started investigating the Green Tea Asian Cuisine Restaurant this past March citing the business for upwards of 1,700 Maine state labor laws over the past few years.

“The citation came to light through a letter the labor department sent on March 20 to the U.S. Department of Homeland Security seeking to delay the potential deportation of any current and former employees of Green Tea who were not legally in the United States, so they could participate in the department’s case against their employer.”

“The state did not describe the violations in detail but said they fell under six state statutes related to the full and timely payment of wages, earned paid leave, minimum wages and the employment of minors.”

It’s unclear what will happen to the restaurant, which remains open for the time being. The violations are still being looked into, then the case will be made and either a ruling be set forth, or the parties will settle.

Just a few years ago, the owners of the Green Tea purchased the old Arby’s Restaurant nearby and there was talk of renovating that space and using it as another restaurant.

Read More: Green Tea Restaurant To Operate In Old Arby’s, Once Renovated

So far, no visible movement has been made on that front.

The Top Ten Restaurants Around Bangor According to Yelp

From the mouths of those who’ve eaten there…

Gallery Credit: Jason Stewart

8 Tasty Chain Restaurants That Could Be In Bangor Someday

Bangor needs something new! Any of these would fit in nicely.

Gallery Credit: Arlen Jameson

5 Places In Bangor Where Another Chick-fil-A Would Be Perfect

One Chick-fil-A in Bangor, just isn’t enough!


Source link

20 12, 2024

Bearish signal emerges as ADA eyes rebound to $1.20

By |2024-12-20T03:43:54+02:00December 20, 2024|Crypto News, News|0 Comments

  • Cardano price tumbled below $1 on Thursday as prospects of fewer Fed rate cuts in 2025 triggered a sharp market-wide sell-off.
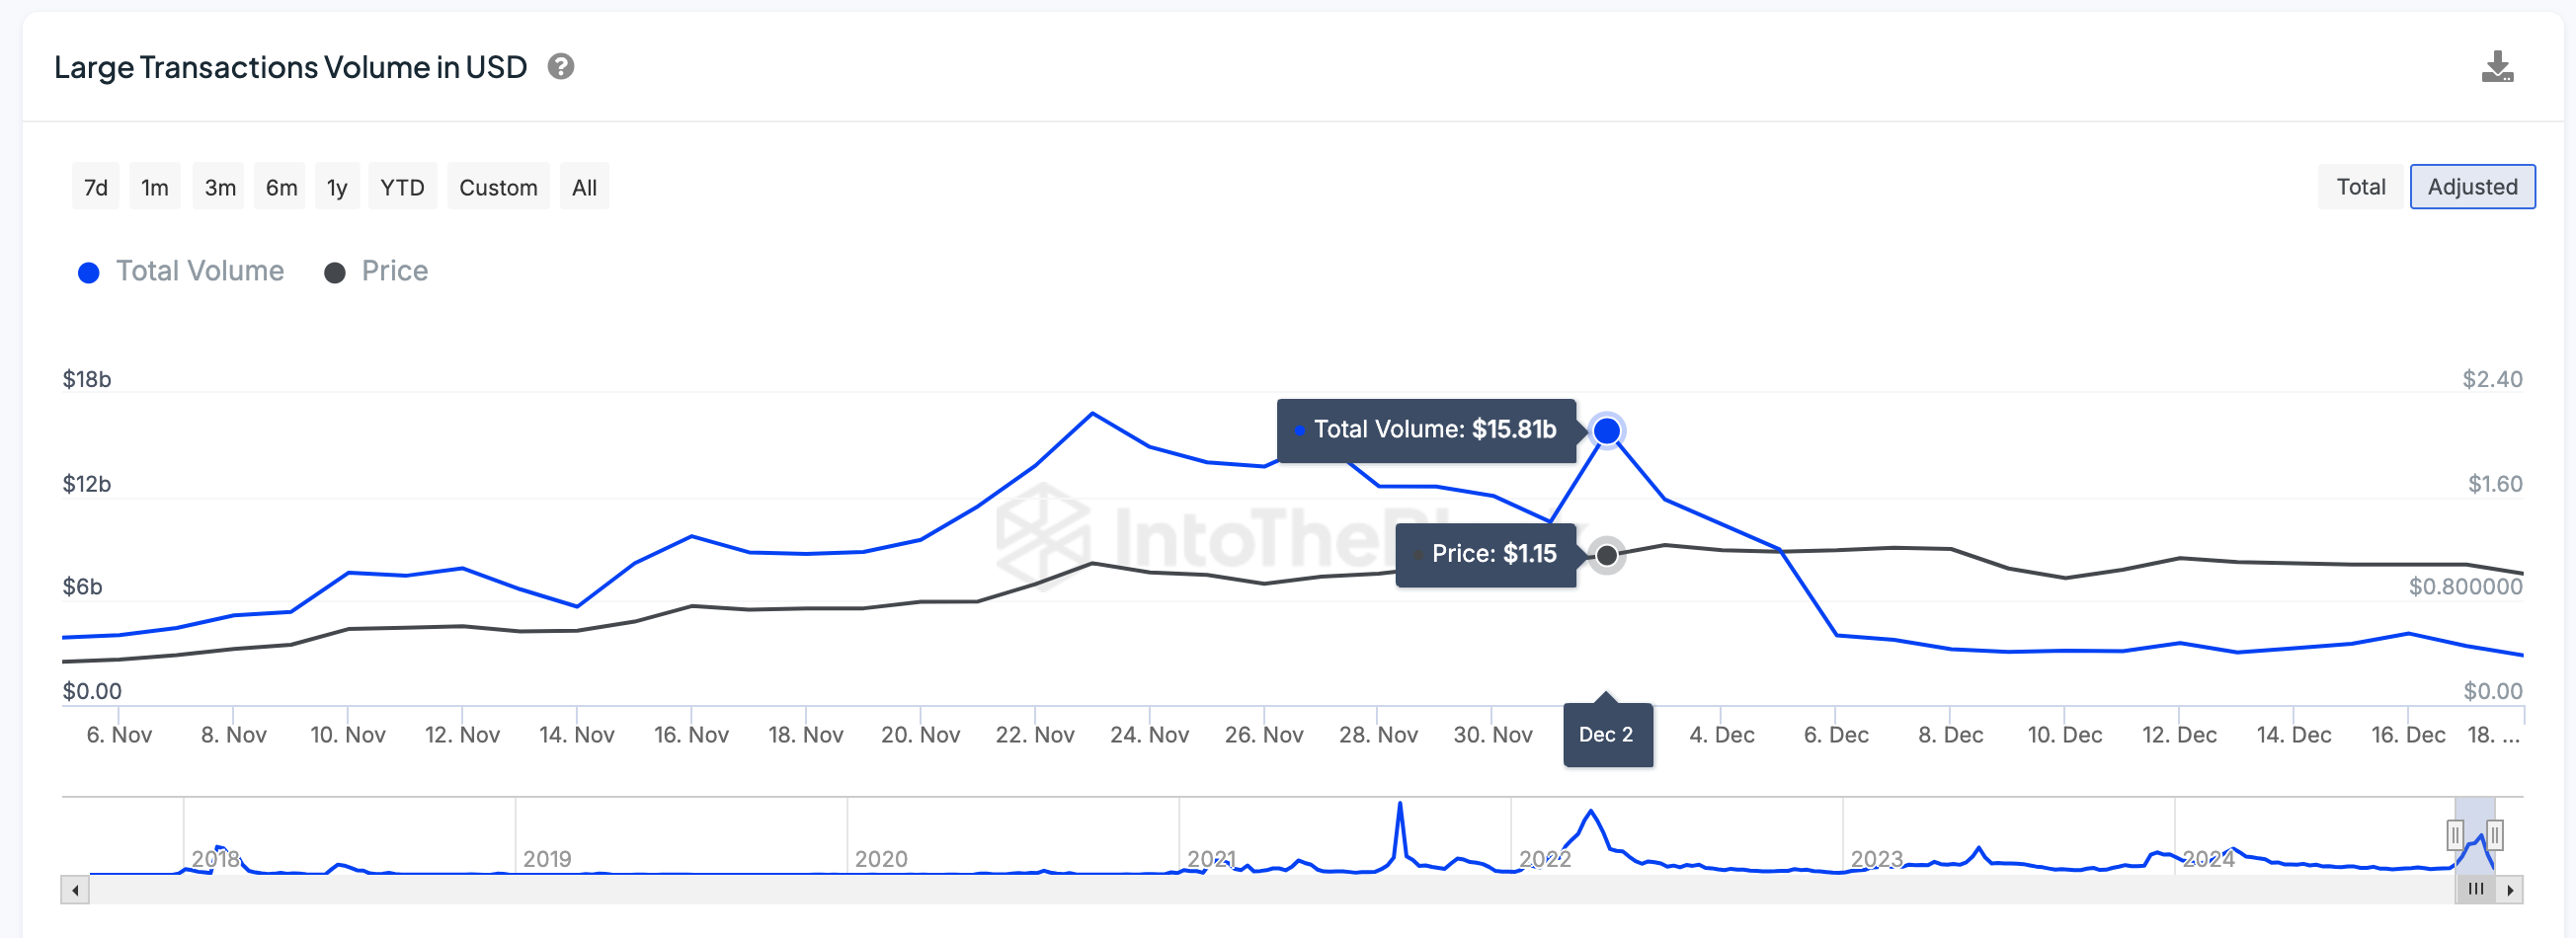
  • Large transaction volumes have declined by $13 billion between December 2 and December 18, signaling disinterest among whale investors.
  • Technical indicators highlight further downside risks ahead for ADA if the $0.9500 support fails.

Cardano price tumbled below $1 on Thursday as traders reacted to the US Fed hinting at fewer rate cuts in 2025. On-chain data shows a persistent decline in whale demand for ADA over the past two weeks. 

Cardano plunges below $1 amid post-FOMC sell-off

On Wednesday, the US Federal Reserve (Fed) concluded its December FOMC meeting with a 25-basis-point interest rate cut.

But despite matching analysts’ expectations with a third consecutive rate cut, the accompanying statement hinting at fewer cuts in 2025 sent bearish aftershocks across the crypto market. 

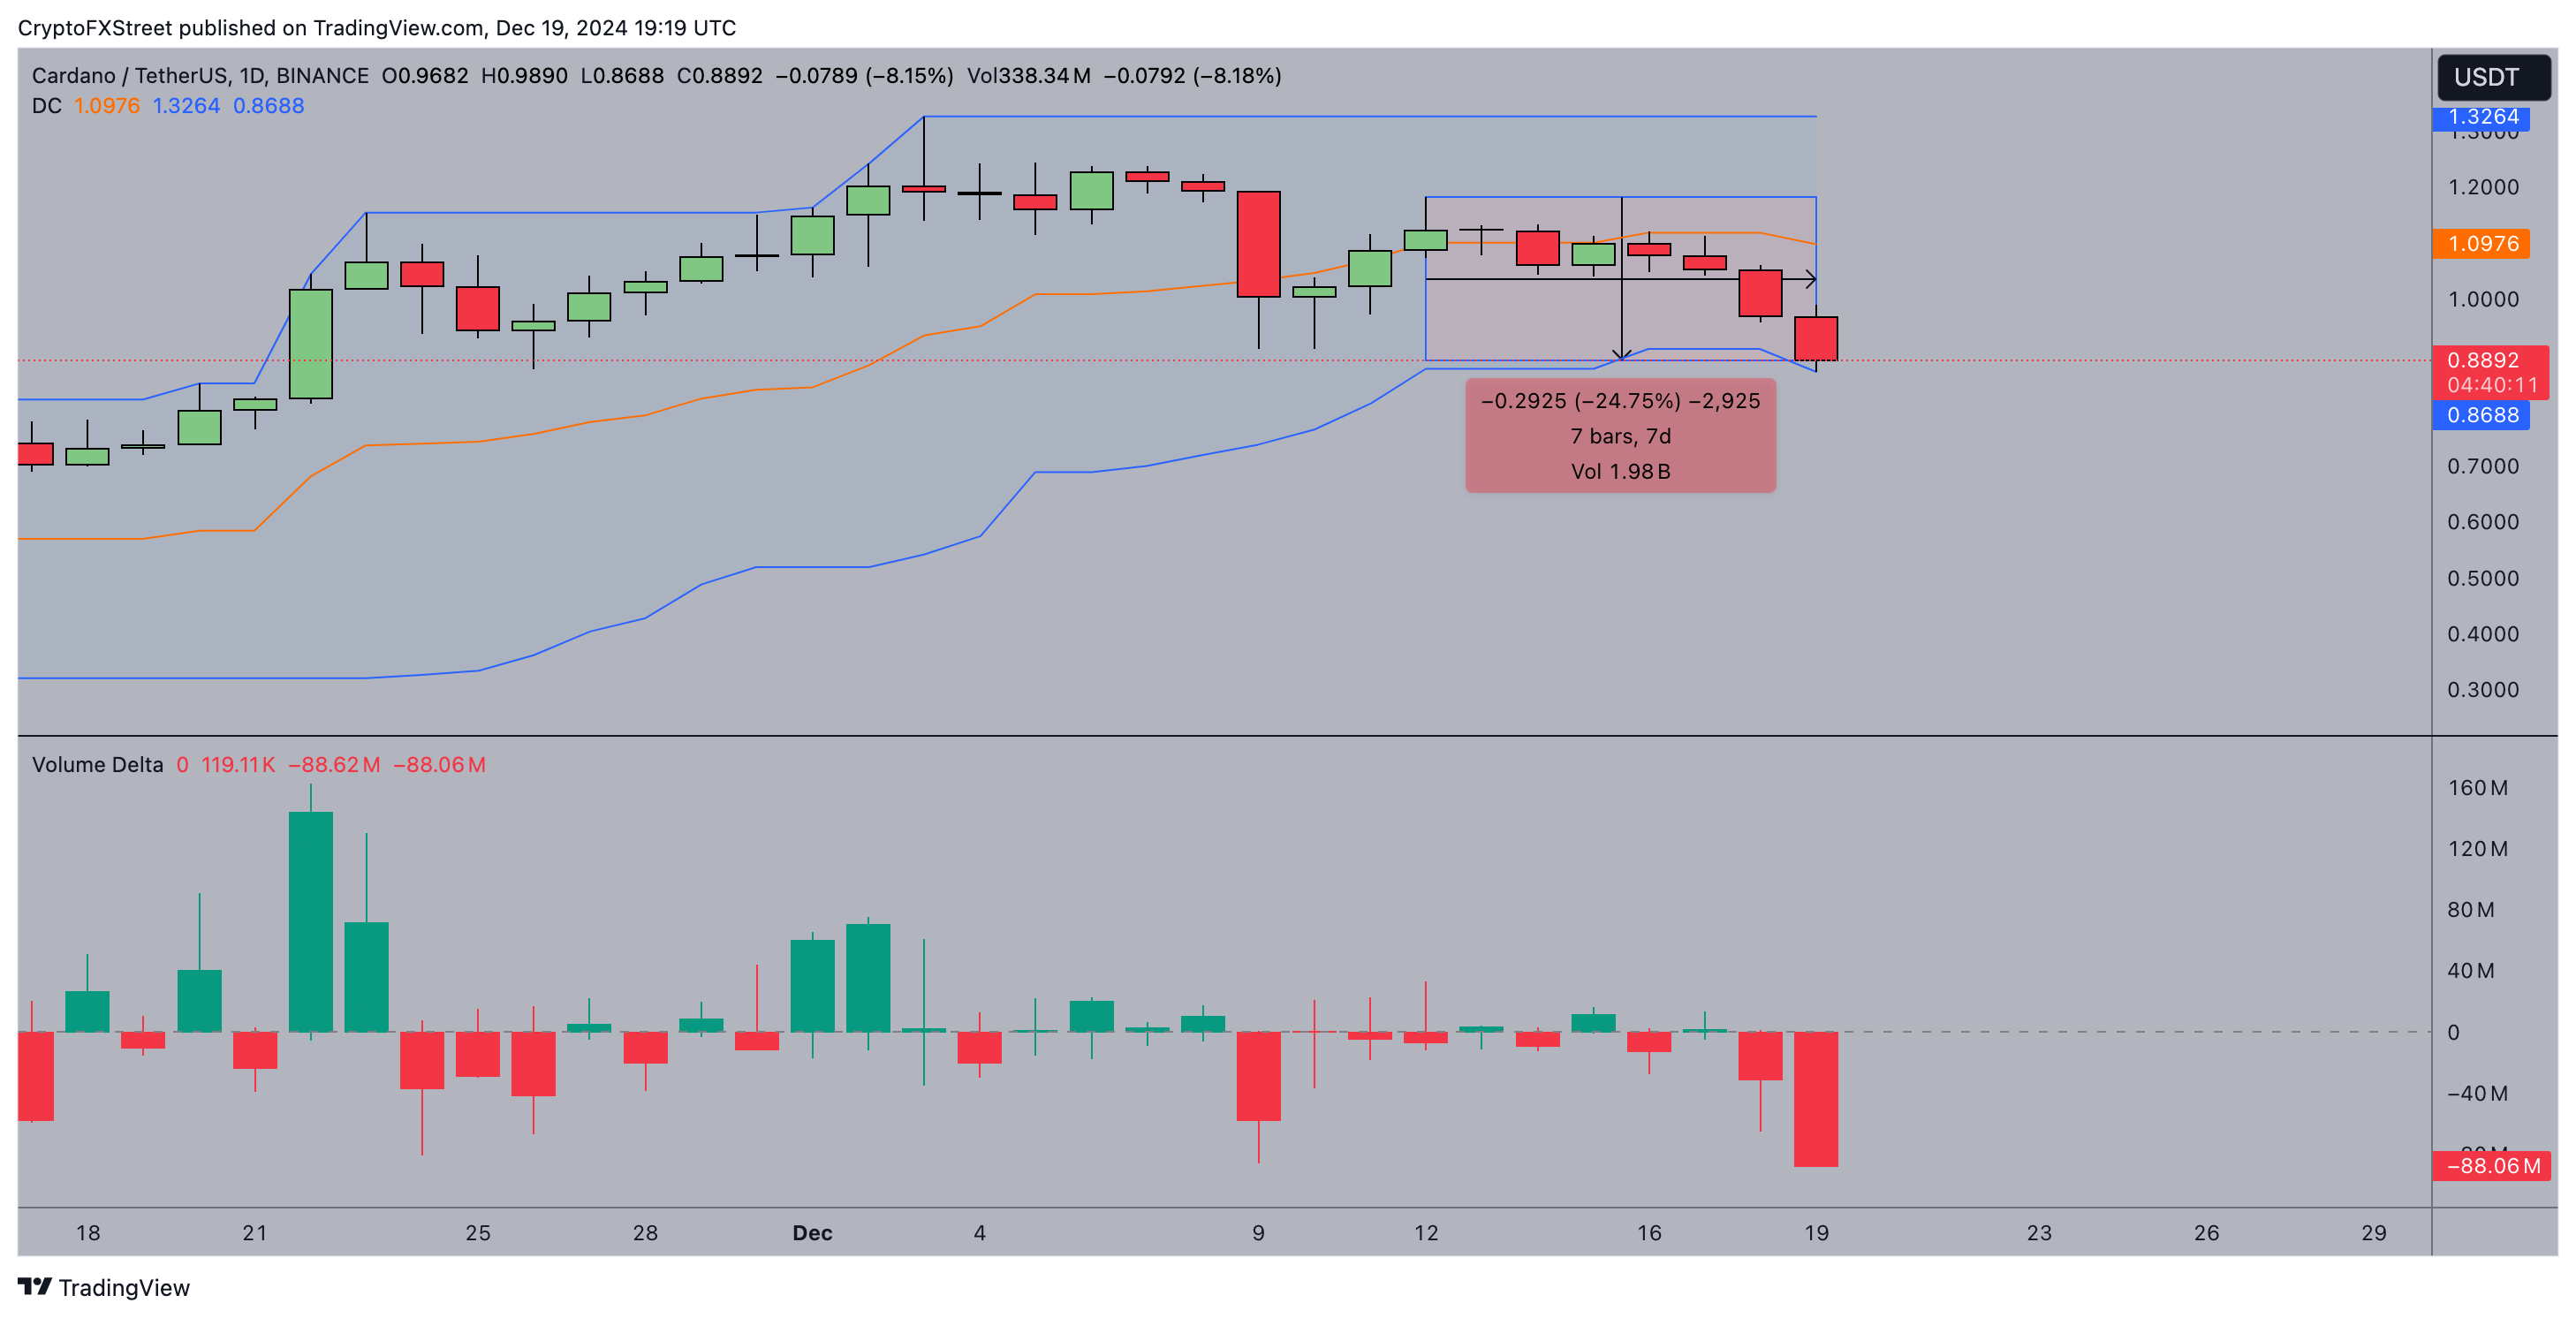
Cardano price action (ADAUSDT) | December 19 2024

The chart above shows how ADA prices plunged as low as $0.8800 on Thursday, bringing its weekly time frame losses to the 25% mark.

While Cardano’s ongoing downswing aligns with the global market dip in the aftermath of the Fed’s more hawkish outlook. The 25% loss has seen ADA fall behind rival Layer-1 coins like ETH, SOL and AVAX. 

ADA whale demand drops by $13B, intensifying downside risks 

When a mega cap asset like Cardano performs below the market average, it signals the presence of lingering internal bearish catalysts.

The on-chain data trends show that ADA has struggled to attract demand since December 2, two weeks before the FOMC meeting triggered a market-wide sell-off on Wednesday. 

In indication of this stance, the IntoTheBlock chart below tracks the daily volume of single transactions that exceed $100,000 in value.

This serves as a proxy for monitoring trading of whale investors on a blockchain network. 

Cardano Whale Transactions vs. ADA Price | Source: IntoTheBlock

Looking at the chart above, Cardano large transactions totalled $15.8 billion on December 2.

But since then, whale investors have progressively scaled down their demand for ADA.

The latest data shows that only $2.9 billion worth of large transactions were executed on December 18, reflecting a $13 billion decline from the monthly time frame peak.

Such a massive decline in whale transactions could be bearish for two key reasons. 

First, large transaction volumes often indicate significant market activity by institutional or high-net-worth investors.

A sharp reduction in such activity suggests waning confidence among Cardano’s largest stakeholders, potentially discouraging smaller retail investors and triggering further sell-offs. 

Second, reduced whale participation implies lower liquidity in the ADA market and heightened risk of rapid price downswings during a crypto sell-off.

This partly explains why ADA price has tumbled further than the likes of ETH, SOL and AVAX. 

Cardano price forecast: $0.8500 support at risk

After a 25% decline in the past week, the Donchian Channel (DC) and Volume Delta technical indicators now paint a bearish picture for Cardano’s short-term price action and market momentum.

The Donchian Channel reflects that ADA is currently testing its lower boundary at $0.8688, a critical level of support.

The upper boundary at $1.3264 highlights significant resistance, while the midline at $1.0976, corresponding to prior price consolidation, now serves as a strong resistance zone. The breach of the midline in recent sessions suggests a shift in sentiment from neutral to bearish, with sellers clearly dominating.

Price trading near the lower boundary implies heightened downside risks. If ADA fails to hold above the $0.8500-$0.8688 range, the next likely support zone lies near $0.8000.

Cardano Price Forecast 

The Volume Delta adds further confirmation of bearish momentum. The -88.06 million delta clearly shows that sell-side activity significantly outweighs buy-side interest. This overwhelming selling pressure is consistent with waning whale activity, as highlighted by the $13 billion drop in large transactions since December 2.

The lack of significant green volume bars signals weak buyer confidence, making it unlikely that bulls can mount a meaningful recovery in the near term. Combined with the Donchian Channel, this suggests that even if ADA bounces back towards the $1.00 psychological level, it would face strong resistance at the $1.0976 midline.

If sell-side dominance continues, ADA will likely break below $0.8500, with the next major support near $0.8000. 


Source link

20 12, 2024

USD/JPY Fed Breakout Testing Key Resistance

By |2024-12-20T01:45:16+02:00December 20, 2024|Forex News, News|0 Comments

Japanese Yen Technical Forecast: USD/JPY Weekly / Daily Trade Levels

  • USD/JPY post-FOMC breakout extends more than 6.1% off December low
  • USD/JPY bulls testing major pivot zone at uptrend resistance- US Core PCE on tap tomorrow
  • Resistance 157.16/89 (key), ~159.50s, 160.40/73- Support 151.90-152, ~151.16, 148.73-149.60 (key)

The Japanese Yen is poised to mark a third consecutive weekly decline against the US Dollar with USD/JPY surging to fresh multi-month highs on the back of the Fed rate decision. The rally takes price into a critical pivot zone and while the broader outlook remains constructive, we’re looking for possible inflection here in the days ahead. Battle lines drawn on the USD/JPY weekly technical chart into the close of the year.

Review my latest Weekly Strategy Webinar for an in-depth breakdown of this Yen setup and more. Join live on Monday’s at 8:30am EST.

Japanese Yen Price Chart – USD/JPY Weekly


Chart Prepared by Michael Boutros, Sr. Technical Strategist; USD/JPY on TradingView

Technical Outlook: In last month’s Japanese Yen Technical Forecast we highlighted potential for a larger correction within the September uptrend in USD/JPY while noting that, “From a trading standpoint, look to reduce short-exposure / lower protective stops on a stretch towards 150 IF reached. Ultimately, we are looking for an exhaustion low ahead of 148 for the September rally to remain viable with a breach / close above 154.34 needed to mark uptrend resumption.” Price plunged nearly 5.2% off the November highs with USD/JPY registering an intraday low at 148.64 into the monthly open before rebounding.

The US Dollar is now poised to mark a third consecutive weekly advance with the recovery extending more than 6.1% off the December low on the heels of the FOMC rate decision. The rally takes USD/JPY towards a major resistance hurdle just higher at 157.17/89– a region defined by the 78.6% retracement of the yearly range and the July breakdown close. Note that the 2020 parallel converges on this zone over the next few weeks and further highlight the technical significance of this threshold.

Initial weekly support now rests back at the 1986 low / 1998 & 2022 high at 151.90-152 and is backed closely by the 52-week moving average (currently ~151.16). Broader bullish invalidation now raised to the 2022 high-close / 2023 high-week close (HWC) at 148.73-149.60– a break / close below this threshold would suggest a more significant high is in place / a larger reversal is underway. Ultimately, a break below the 61.8% retracement at 146.29 would be needed to put the bears in control.

A topside breach / close above this key pivot zone exposes subsequent resistance objectives at the upper parallel (blue slope near 159.50s) and the 1990 high / 2024 HWC at 160.40/73. Ultimately, a close above the swing highs at 161.95 would be needed to fuel the next major leg of the multi-year uptrend in USD/JPY (look for a larger reaction there IF reached).

Get our exclusive guide to USD/JPY trading in Q4 2024

Bottom line: The USD/JPY rally is now approaching major technical resistance, and the focus is on possible inflection into this threshold. From a trading standpoint, look to reduce portions of long-exposure / raise protective stops on a test of 157.16/89- losses should be limited to 152 IF price is heading higher on this stretch with a close above this pivot zone needed to mark resumption of the September uptrend.

Keep in mind we get the release of key US inflation data tomorrow with the Consumer Price Expenditure (PCE) expected to show a slight uptick to 2.9% y/y in November. Stay nimble into the release watch the weekly close here for guidance. Review my latest Japanese Yen Short-term Outlook for a closer look at the near-term USD/JPY technical trade levels.

USD/JPY Key Economic Data Releases

Japan US Economic Calendar- USDJPY Data Releases-12-19-2024 

Economic Calendar – latest economic developments and upcoming event risk.

Active Weekly Technical Charts

— Written by Michael Boutros, Sr Technical Strategist

Follow Michael on X @MBForex



Source link

20 12, 2024

Bangor restaurant faces more than 1,700 labor law violations, report says

By |2024-12-20T01:43:15+02:00December 20, 2024|Dietary Supplements News, News|0 Comments


BANGOR, Maine (WABI) – A Bangor restaurant is facing more than 1,700 labor law violations, according to the Bangor Daily News.

The newspaper says it obtained a letter from the Maine Department of Labor to immigration officials regarding Green Tea Restaurant on Bangor Mall Boulevard.

According to the report, the state opened an investigation into Green Tea last January and in the spring issued a citation for 1,710 labor law violations over the previous three years.

The BDN reports the DOL did not detail the violations but said they fell under statutes related to the full and timely payment of wages, earned paid leave, minimum wages, and the employment of minors.

The newspaper says a lawyer for the owners of Green Tea declined to comment other than to say the restaurant is cooperating.


Source link

20 12, 2024

Lightchain AI (LCAI) Price Prediction: XRP to Smash $18 This Cycle While Under $0.003 Rival Eyes $10

By |2024-12-20T01:42:07+02:00December 20, 2024|Crypto News, News|0 Comments

Cryptocurrency enthusiasts are always on the lookout for the next big investment opportunity, and currently, XRP and Lightchain AI (LCAI) are two assets that have caught the attention of many. While XRP is known for its strong presence in cross-border payments and has recently seen a surge in trading volume, LCAI is making waves by integrating artificial intelligence with blockchain technology.

In this article, we will take a closer look at these two cryptocurrencies and their potential for growth. From predictions of XRP reaching $5 by the end of the year to LCAI’s unique value proposition and early investor opportunities, we will explore what makes these assets stand out in the competitive cryptocurrency market. So, buckle up and let’s dive into the world of XRP and LCAI.

The Unique Value Proposition of LCAI

Lightchain AI (LCAI) distinguishes itself in the cryptocurrency landscape through its innovative integration of artificial intelligence (AI) and blockchain technology. At its core is the Artificial Intelligence Virtual Machine (AIVM), a specialized engine designed to execute complex AI computations directly on the blockchain. This capability enables real-time analytics, decentralized AI model training, and a multitude of other applications, setting LCAI apart from traditional blockchain platforms.

Additionally, LCAI addresses critical challenges in AI, such as bias, data sovereignty, and energy inefficiency. By leveraging its Transparent AI Framework, the platform ensures that AI decision-making processes are auditable and explainable, fostering trust and reliability among users and developers.

Furthermore, LCAI’s deflationary token model enhances its value proposition. A portion of transaction fees is burned, reducing the token supply over time and potentially increasing its value.

The Rise of XRP

XRP is the m͏ain digital currency of Ripple’s payment sys͏tem and it has seen ͏big growth hitting a value of $͏2.58. This rise are connected to m͏ore large i͏nve͏stors taking part and the launch of Ripple’s RLUSD stablecoin w͏hic͏h h͏ave boosted da͏ily trading a͏mount by 163% ͏to $18.28 billion.͏ Experts are optimistic abou͏t XRP future performance ima͏g͏in͏ing an in͏crease to͏ ͏$5 by en͏d͏ of 202͏4 and even higher levels in 2025.

It is crucial to high͏light that XRP have encounter͏ed regulat͏or͏y ob͏stacles like ͏a legal disa͏greem͏ent with the U.S. Sec͏uriti͏es and Exchange Commission regardi͏ng its categorization as security. Despi͏te these challenge XRP’s c͏ollaboration with financial entities and emphasis on i͏nternational payments esta͏blish it a ͏major participant in the cryp͏tocurrency sector.

Price Predictions Of LCAI and XRP

With the unique value proposition of LCAI and the promising future of XRP, it’s no surprise that analysts and investors have high price predictions for both assets. Some experts predict a significant rise in XRP’s price this cycle, with targets ranging from $10 to as high as $18. On the other hand, LCAI is predicted to reach prices upwards of $3000 in the coming years.

And, Lightchain AI has just launched its presale, offering early investors an opportunity to purchase LCAI tokens at a discounted rate. With the platform’s innovative approach and potential for growth, this could be an enticing investment opportunity for those interested in the intersection of AI and blockchain. So, Lightchain AI’s early adopters could potentially see significant returns on their investment.

https://lightchain.ai

https://lightchain.ai/lightchain-whitepaper.pdf

https://x.com/LightchainAI

https://t.me/LightchainProtocol


Disclaimer: This is a paid release. The statements, views and opinions expressed in this column are solely those of the content provider and do not necessarily represent those of Bitcoinist. Bitcoinist does not guarantee the accuracy or timeliness of information available in such content. Do your research and invest at your own risk.

Source link

20 12, 2024

Natural Gas Price Forecast: Breakout Signals Bullish Momentum Toward Higher Targets

By |2024-12-20T01:05:08+02:00December 20, 2024|Forex News, News|0 Comments


First Pullback Following Breakout is Complete

The first pullback following the breakout of a large symmetrical triangle pattern completed at the December 4 swing low of 2.98. That was around the triangle breakout area of 3.02 and it sets the stage for a bullish continuation as prior resistance was tested as support. Today’s breakout occurred two days following a reversal day established on Tuesday, which also generated a higher swing low.

Support at Today’s Low of 3.39

Near-term support is at today’s low of 3.39. A decline below that price could lead to another retest of support around the 20-Day MA, currently at 3.27. As noted previously, the 20-Day line was successfully tested as support on several days recently. Support was indicated by the daily closes above the line, even though earlier the price of natural gas had traded below the 20-Day line. Of course, a key support area is the interim swing low from Tuesday at 3.09 because it generated a higher swing low and holds the second point of a rising trendline.

First 3.64, then 385

A daily close above 3.56 will confirm today’s breakout. There could be a clear pickup in momentum that takes natural gas straight to test resistance around the top of the triangle pattern at 3.64. But given strength indicated following the symmetrical triangle breakout, that price level is expected to be exceeded. Notice that following the November 20 breakout, natural gas quickly took out prior swing highs at 3.16 and 3.09.

That was a sign of strength that should return once the 3.56 high is exceeded. Initial higher targets would then be anchored around a 38.2% Fibonacci retracement level at 3.85. Higher up is an extended target from a rising ABCD pattern (purple) at 4.06, followed by an initial target from a smaller ascending ABCD pattern (red) at 4.33.

For a look at all of today’s economic events, check out our economic calendar.


Source link

Go to Top