About Editorial team of BIPNs

Main team of content of bipns.com. Any type of content should be approved by us.
19 12, 2024

Here’s Dogecoin Price If Bitcoin Hits $325K and Ethereum $22K as Predicted by VanEck

By |2024-12-19T13:34:58+02:00December 19, 2024|Crypto News, News|0 Comments

Dogecoin could exceed the $1 psychological mark if Bitcoin and Ethereum spike to $325,000 and $22,500, as projected by VanEck.

Crypto prices have soared tremendously since last month, with top assets like Bitcoin (BTC) and Ethereum (ETH) surging above $100,000 and $4,000, respectively. Although ETH has witnessed a pullback below the $4,000 mark, Bitcoin currently trades above $100,000.

Nonetheless, the premier crypto assets are preparing to clinch some audacious targets issued by top experts. Specifically, Matthew Sigel, Head of Digital Asset Research at VanEck, set a bullish price target of $325,000 for Bitcoin in June. Interestingly, he also projected that Ethereum will someday trade at $22,500.

Dogecoin Correlation with Bitcoin and Ethereum 

If VanEck’s prediction for Bitcoin and Ethereum comes true, other crypto assets like Dogecoin (DOGE) will also surge to unprecedented levels, given their correlation.

The price movements of Bitcoin and Ethereum usually determine the trajectory of other assets like Dogecoin. An increase in Bitcoin and Ethereum prices translates to a positive performance for DOGE and vice versa.

Data from IntoTheBlock shows that Dogecoin has a 97% correlation with Bitcoin over the past 30 days. Similarly, Dogecoin also boasts a strong correlation of 86% with Ethereum’s price action in the same timeframe.

Here’s Dogecoin Price If Bitcoin Hits 5K and Ethereum K as Predicted by VanEck
Dogecoins correlation with Bitcoin and Ethereum

Price of DOGE If VanEck Prediction for Bitcoin and Ethereum Materialize

Dogecoin’s strong correlation with Bitcoin and Ethereum over the past month means its price could soar tremendously if BTC clinches the $325,000 target and ETH hits the $22,500 level set by VanEck.

Achieving a target of $325,000 requires Bitcoin to soar by 219.86% from its current price of $101,604. Similarly, Ethereum must record a 476.48% rally to hit VanEck’s projected target of $22,500.

Meanwhile, we analyzed how much Dogecoin will be worth if it matches the average projected surge rate of VanEck’s forecast, which stands at 348.17%.

Applying this growth rate to Dogecoin’s current price of $0.3641 will see DOGE trade at $1.82, marking a new all-time high for the leading memecoin. This would potentially take Dogecoin’s market cap to $267.89 billion, surpassing Tether to become the third biggest crypto.

Potential Timeline for Dogecoin to Hit $1.82 

Interestingly, several market observers believe the $1.82 target is realistic for Dogecoin. According to experts at the crypto trading platform Changelly, Dogecoin will have reached its target by November 2031, seven years from now. 

However, top prediction platform Telegaon speculates that Dogecoin will hit the $1.82 target sooner, specifically in 2026, less than two years from now. 

Whether Dogecoin can soar to $1.82 within the next 2 – 7 years remains unclear. However, several factors, especially Elon Musk’s continuous endorsement and Dogecoin’s growing adoption for payment purposes, could pave the way for this surge. 

DisClamier: This content is informational and should not be considered financial advice. The views expressed in this article may include the author’s personal opinions and do not reflect The Crypto Basic opinion. Readers are encouraged to do thorough research before making any investment decisions. The Crypto Basic is not responsible for any financial losses.
Source link

19 12, 2024

Pound Sterling rebounds as focus shifts to BoE

By |2024-12-19T11:37:18+02:00December 19, 2024|Forex News, News|0 Comments

  • GBP/USD recovers toward 1.2650 following Wednesday’s sharp decline.
  • The hawkish twist in the Fed’s dot plot boosted the US Dollar in the American session.
  • Bank of England is forecast to leave the bank rate unchanged at 4.75%.

After suffering heavy losses in the American session on Wednesday, GBP/USD stages a decisive rebound early Thursday as investors reposition themselves ahead of the Bank of England’s (BoE) monetary policy announcements.

British Pound PRICE This week

The table below shows the percentage change of British Pound (GBP) against listed major currencies this week. British Pound was the weakest against the US Dollar.

  USD EUR GBP JPY CAD AUD NZD CHF
USD   0.78% -0.25% 2.13% 1.12% 1.94% 2.00% 0.39%
EUR -0.78%   -0.98% 1.44% 0.40% 1.32% 1.28% -0.33%
GBP 0.25% 0.98%   2.32% 1.38% 2.32% 2.26% 0.65%
JPY -2.13% -1.44% -2.32%   -1.01% -0.19% -0.12% -1.63%
CAD -1.12% -0.40% -1.38% 1.01%   0.87% 0.87% -0.73%
AUD -1.94% -1.32% -2.32% 0.19% -0.87%   -0.04% -1.63%
NZD -2.00% -1.28% -2.26% 0.12% -0.87% 0.04%   -1.60%
CHF -0.39% 0.33% -0.65% 1.63% 0.73% 1.63% 1.60%  

The heat map shows percentage changes of major currencies against each other. The base currency is picked from the left column, while the quote currency is picked from the top row. For example, if you pick the British Pound from the left column and move along the horizontal line to the US Dollar, the percentage change displayed in the box will represent GBP (base)/USD (quote).

The Federal Reserve (Fed) lowered the policy rate by 25 basis points after the December meeting, as expected. The revised Summary of Economic Projections (SEP), also known as the dot plot, showed that Fed officials’ median view of the policy rate at end-2025 stood at 3.9%, up from 3.4% in September’s SEP. According to the projections, one of 19 officials see no cuts in 2025, three see one cut, 10 see two cuts, three see three cuts, one sees four cuts and one sees five cuts.

Fed Chairman Jerome Powell explained in the post-meeting press conference that stronger economic growth and lower unemployment would put them on a slower rate-cut path, adding that they can be cautious going forward. US Treasury bond yields surged higher in the Fed aftermath and boosted the US Dollar (USD), forcing GBP/USD to decline sharply.

The improving risk mood limits the USD’s gains and helps GBP/USD rebound in the European session on Thursday.

The BoE is widely expected to leave the policy rate unchanged at 4.75%. Since there will not be a press conference, the vote split could influence Pound Sterling’s valuation. If the decision to maintain status quo turns out to be a close call, with several policymakers voting in favor of a 25 bps rate cut, GBP/USD could turn south once again.

GBP/USD Technical Analysis

The Relative Strength Index (RSI) indicator on the 4-hour chart rises toward 50, reflecting sellers’ hesitancy. On the upside, 1.2700-1.2710 (100-period Simple Moving Average (SMA), Fibonacci 38.2% retracement of the latest downtrend, 200-period SMA) aligns as immediate resistance ahead of 1.2750 (Fibonacci 50% retracement) and 1.2800 (static level).

Looking south, first support could be spotted at 1.2620 (Fibonacci 23.6% retracement) before 1.2570 (static level) and 1.2500 (round level, static level).


Source link

19 12, 2024

Cardano Weekend Price Prediction: Can ADA Reclaim $1.30?

By |2024-12-19T11:34:26+02:00December 19, 2024|Crypto News, News|0 Comments

Cardano (ADA) faced a rough few years since the 2021 bull run. The asset struggled to breach the $1 mark and slipped out of the top 10 projects by market cap. Despite the sluggish few years, ADA made quite a recovery over the last few months. The asset breached the $1 mark for the first time since April 2022. This price prediction article will discuss how high ADA’s price could go over the coming weekend.

Also Read: Microsoft: Why MSFT Is Bound for $500 All-Time High in 2025

Cardano’s Current Price Movements

Cardano Weekend Price Prediction: Can ADA Reclaim .30?
Source: CoinGecko

ADA has faced a significant price correction today. The asset is down 4.6% in the daily charts, 16.4% in the weekly charts, and 18.2% in the 14-day charts. The asset has maintained some gains in the monthly and yearly charts, rallying 29.8% and 59.9%, respectively.

The latest market correction could be due to the Federal Reserve announcing that 2025 will have only two interest rate cuts instead of three. The Fed also anticipates inflation in the US to stay for longer than expected. The Fed predicts inflation to hover between 2.1% to 2.5%. Inflation in the US may not fall under the Fed’s 2% target even by 2026.

Also Read: Cardano Up 77% in 2024 Amid Drop: What to Expect From ADA in January

Weekend Price Prediction

ADA price prediction CoinCodexADA price prediction CoinCodex
Source: CoinCodex

According to CoinCodex, ADA may continue to dip over the next few days. The platform anticipates the asset to trade at $0.96 on Sunday, Dec. 22, 2024. Hitting $0.96 from current price levels will entail a dip of about 1.03%.

Also Read: Amazon Stock Rises as AMZN Plans $10B AI Investment

Despite the bearish short-term outlook, CoinCodex anticipates ADA will pick up the pace by the end of the month. The platform expects ADA to reclaim the $1.30 mark by Jan. 19, 2025. The platform also predicts ADA to hit $2.55 on Feb. 10, 2025. Hitting $2.55 from current price levels will translate to a rally of about 162.89%.

Source link

19 12, 2024

Recovers past 194.00, traders eye 200-day SMA

By |2024-12-19T09:35:55+02:00December 19, 2024|Forex News, News|0 Comments

  • GBP/JPY rises over 0.20%, showing resilience ahead of key UK economic releases.
  • Technical indicators suggest bullish momentum, with the pair navigating inside the Ichimoku Cloud.
  • Key resistance at 200-day SMA of 194.74; support levels to watch include 193.95 and 100-day SMA at 192.53.

The Pound Sterling registered decent gains of over 0.20% against the Japanese Yen in early trading during Wednesday’s North American session despite the lack of a catalyst boosting the former. The GBP/JPY trades at 194.46 after bouncing off daily lows of 192.49.

Price action remains slightly muted. Traders are awaiting the release of Gross Domestic Product (GDP) figures in the UK on Friday, which are expected to show an improvement in October’s figures.

GBP/JPY Price Forecast: Technical outlook

The GBP/JPY recovered after falling over 4.58% in mid-November, hitting its lowest level since September at 188.06. However, buyers lifted the exchange rate well inside the Ichimoku Cloud (Kumo), clearing key technical resistance levels like the Tenkan-Sen and the Kijun-Sen.

Momentum picked up, showing that bulls are in charge, as depicted by the Relative Strength Index (RSI), which turned bullish, with the slope aiming higher.

If GBP/JPY clears the 200-day Simple Moving Average (SMA) at 194.74, further upside is seen. The 50-day SMA is next at 195.06. A breach of the latter exposes the top of the Kumo at 196.20-40.

Conversely, if GBP/JPY tumbles below the confluence of the Kijun-Sen and the Senkou Span B at around 193.95, the next support would be the 100-day SMA at 192.53 before testing the bottom of the Kumo at 191.75-95.

GBP/JPY Price Chart – Daily

British Pound PRICE Today

The table below shows the percentage change of British Pound (GBP) against listed major currencies today. British Pound was the strongest against the Japanese Yen.

  USD EUR GBP JPY CAD AUD NZD CHF
USD   0.12% 0.22% 0.43% -0.00% 0.27% 0.28% 0.00%
EUR -0.12%   0.09% 0.32% -0.12% 0.15% 0.16% -0.11%
GBP -0.22% -0.09%   0.19% -0.22% 0.06% 0.06% -0.21%
JPY -0.43% -0.32% -0.19%   -0.44% -0.16% -0.17% -0.42%
CAD 0.00% 0.12% 0.22% 0.44%   0.27% 0.28% 0.01%
AUD -0.27% -0.15% -0.06% 0.16% -0.27%   0.00% -0.26%
NZD -0.28% -0.16% -0.06% 0.17% -0.28% -0.01%   -0.27%
CHF -0.01% 0.11% 0.21% 0.42% -0.01% 0.26% 0.27%  

The heat map shows percentage changes of major currencies against each other. The base currency is picked from the left column, while the quote currency is picked from the top row. For example, if you pick the British Pound from the left column and move along the horizontal line to the US Dollar, the percentage change displayed in the box will represent GBP (base)/USD (quote).


Source link

19 12, 2024

XAG/USD falls to three-month lows near $29.50

By |2024-12-19T08:56:26+02:00December 19, 2024|Forex News, News|0 Comments


  • Silver price reached a three-month low at $29.26 on Thursday.
  • Non-yielding Silver depreciates as the Fed’s “dot plot,” anticipates only two rate cuts in 2025.
  • The BoJ kept the short-term rate target within the range of 0.15%-0.25%.

Silver price (XAG/USD) extends its losing streak for the sixth consecutive session, trading around $29.50 per troy ounce during the Asian hours on Thursday. The price of the grey metal depreciated more than 3% after the release of the Federal Reserve (Fed) interest rate decision on Wednesday.

The Federal Reserve (Fed) delivered a hawkish cut of 25 basis points (bps) at its December meeting, bringing its benchmark lending rate to a range of 4.25%-4.50%, a two-year low. Additionally, during the Press Conference, Fed Chair Jerome Powell made clear that the Fed will be cautious about further cuts as inflation remains stubbornly above the central bank’s 2% target.

The Summary of Economic Projections, often referred to as the “dot plot,” now anticipates only two rate cuts in 2025, a decrease from the four projected in September. This adjustment may be due to robust GDP growth and persistent inflation in the United States (US). Prolonged higher interest rates tend to negatively impact the demand for non-yielding assets like Silver.

Traders will likely observe the US weekly Initial Jobless Claims, Existing Home Sales, and final reading of Gross Domestic Product Annualized for the third quarter (Q3) due on Thursday. These data points could further shape the Fed’s monetary policy expectations.

Moreover, the Bank of Japan maintained its policy rate for the third consecutive meeting, keeping the short-term rate target within the range of 0.15%-0.25% after its two-day monetary policy review, in line with market expectations. Traders expect the Bank of England (BoE) to keep interest rates unchanged later in the day.

Additionally, the industrial outlook for Silver appears constrained due to overcapacity in China’s solar panel industry, prompting photovoltaic companies to join a government self-discipline program to regulate supply.

Silver FAQs

Silver is a precious metal highly traded among investors. It has been historically used as a store of value and a medium of exchange. Although less popular than Gold, traders may turn to Silver to diversify their investment portfolio, for its intrinsic value or as a potential hedge during high-inflation periods. Investors can buy physical Silver, in coins or in bars, or trade it through vehicles such as Exchange Traded Funds, which track its price on international markets.

Silver prices can move due to a wide range of factors. Geopolitical instability or fears of a deep recession can make Silver price escalate due to its safe-haven status, although to a lesser extent than Gold’s. As a yieldless asset, Silver tends to rise with lower interest rates. Its moves also depend on how the US Dollar (USD) behaves as the asset is priced in dollars (XAG/USD). A strong Dollar tends to keep the price of Silver at bay, whereas a weaker Dollar is likely to propel prices up. Other factors such as investment demand, mining supply – Silver is much more abundant than Gold – and recycling rates can also affect prices.

Silver is widely used in industry, particularly in sectors such as electronics or solar energy, as it has one of the highest electric conductivity of all metals – more than Copper and Gold. A surge in demand can increase prices, while a decline tends to lower them. Dynamics in the US, Chinese and Indian economies can also contribute to price swings: for the US and particularly China, their big industrial sectors use Silver in various processes; in India, consumers’ demand for the precious metal for jewellery also plays a key role in setting prices.

Silver prices tend to follow Gold’s moves. When Gold prices rise, Silver typically follows suit, as their status as safe-haven assets is similar. The Gold/Silver ratio, which shows the number of ounces of Silver needed to equal the value of one ounce of Gold, may help to determine the relative valuation between both metals. Some investors may consider a high ratio as an indicator that Silver is undervalued, or Gold is overvalued. On the contrary, a low ratio might suggest that Gold is undervalued relative to Silver.


Source link

19 12, 2024

XRP Price Prediction For December 19

By |2024-12-19T07:32:39+02:00December 19, 2024|Crypto News, News|0 Comments

XRP’s price is currently trading between two key levels: strong support around $2 and resistance between $2.90 and $3. This $3 level has been a tough barrier for XRP, and the price hasn’t yet broken down the overall bullish trend, despite some short-term pullbacks. Right now, XRP is in a sideways consolidation phase, and it appears to be staying within this range for the time being.

Key Fibonacci Levels

The key Fibonacci levels have been met, but there could still be a small dip before any further upward movement. The price has maintained an overall bullish trend, with the possibility that the price bottomed around $1.90 in 2020, and we’re now seeing an upward movement that could continue.

Bullish Flag Breakout

According to analyst Josh of Crypto World, XRP recently broke out from a bullish flag pattern, signaling short-term upward movement. Even with a small pullback, the price is still above the breakout point, meaning those who entered the trade are still in profit. The price target for this breakout is around $3.80, which suggests a potential 47-48% increase from current levels.

Resistance Levels to Watch

However, resistance levels remain important. If XRP hits the $2.90-$3 range, it could struggle to move higher. Therefore, while the bullish target is in play, other factors need to be considered.

Short-Term Support and Resistance

XRP is bouncing from short-term support around $2.50. If it falls below this level, the next support is around $2.38. The analyst said that a drop below $2.38 would invalidate the current bullish outlook. It is important to note that at the time of writing, XRP is trading at $2.36 level. Short-term resistance to watch includes levels around $2.70, $2.78, and $2.85. If XRP breaks these levels, it could face more resistance near $2.90-$3.

Conclusion

Overall, XRP is still stuck in its current price range, with no clear breakout yet. The price is likely consolidating before making another move upward, but we should wait for the market to stabilize before making any conclusions, especially after the recent Fed decision.

Source link

19 12, 2024

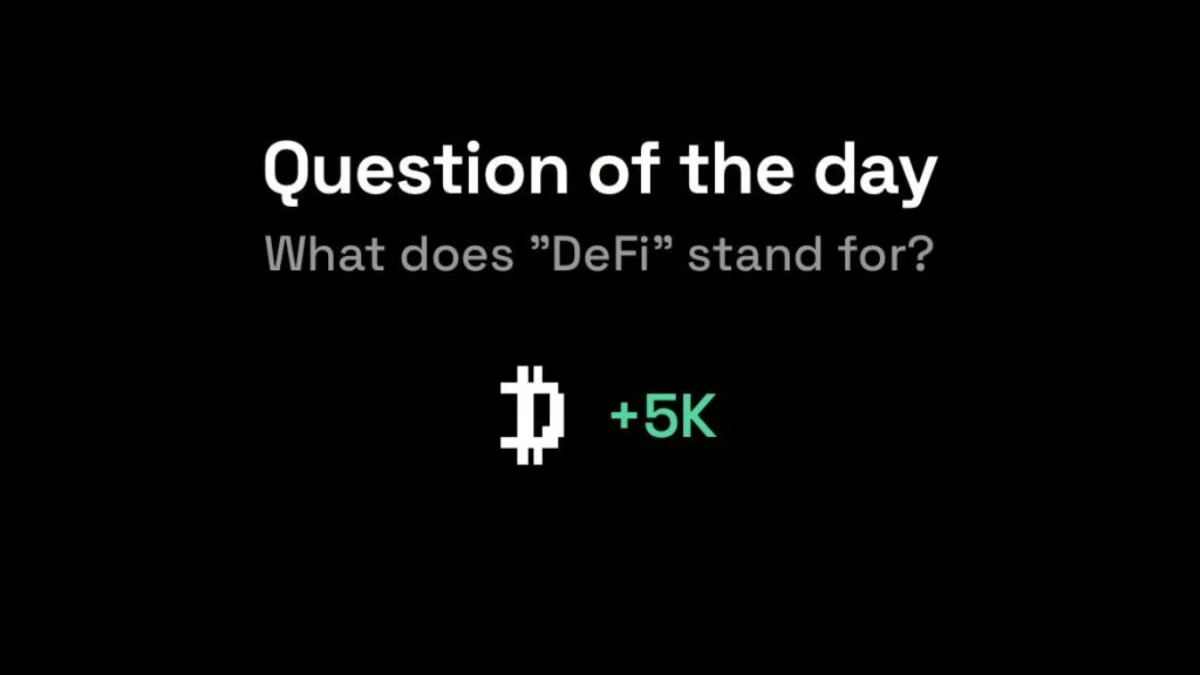
Dropee question of the day code 19 December What does “DeFi” stand for?

By |2024-12-19T07:23:02+02:00December 19, 2024|News, NFT News|0 Comments


Today’s Dropped Question of the Day Code 19 December 2024

We have the answer to Dropee Question of the Day Code December 19, 2024 puzzle. This answer will help you finish the puzzle you’re working on.

Article continues below advertisement

Here is the today’s dropee question of the day code Answers for 19 December.

QUESTION: What does “DeFi” stand for?

ANSWER: Decentralized Finance

Decentralized Finance, or DeFi, refers to a financial ecosystem built on blockchain technology that operates without relying on traditional centralized institutions such as banks or brokerages. Instead, DeFi uses smart contracts—self-executing agreements written in code—to facilitate transactions and manage financial services like lending, borrowing, trading, and investing.

This decentralized approach enables greater accessibility, transparency, and control for users, as they can interact directly with the system without intermediaries. By leveraging blockchain networks, DeFi platforms ensure security, immutability, and a global reach, making financial services available to anyone with an internet connection.

All Other Puzzle solutions for Today December 19, 2024

Our comprehensive guide provides answers to all other puzzles, helping you solve today’s challenges effortlessly. If you’re stuck, use our guide to find the solutions you need.


Source link

19 12, 2024

Expert warns of the common supplements that could give you cancer

By |2024-12-19T05:33:00+02:00December 19, 2024|Dietary Supplements News, News|0 Comments


A dietitian has revealed the common supplements that could increase the risk of cancers forming. 

Nichole Andrews, an oncology dietitian in Washington State, warned that while common supplements like vitamins C have been touted for boosting the immune system, the products are often over-dosed.

She said the irony was that ‘a lot of people will take high-dose supplements to try to reduce their risk of cancer or improve their health.’

However, the ‘more is better’ mindset is ‘incorrect.’ Ms Andrews explained that the body can’t get rid of excess vitamins and instead has to absorb them through the digestive system and into the bloodstream. 

When the body can’t process them fast enough, the supplements can attack healthy cells and stimulate the growth of cancerous tumors.    

Ms Andrews said: ‘It will harm your cells at high levels.’  

That’s a concern, given that over half of Americans report taking at least one dietary supplement. 

And experts believe that as many as nine in 10 of these pills are incorrectly labelled, with their true dosages unknown.  

Nichole Andrews, an oncology dietitian in Washington State, said that taking certain supplements like vitamin C at high doses could increase the risk of cancer

Dietary supplements are not strictly regulated by authorities like the FDA, so it's difficult to know how much of the daily value is actually in one pill (stock image)

Dietary supplements are not strictly regulated by authorities like the FDA, so it’s difficult to know how much of the daily value is actually in one pill (stock image)

In a recent TikTok video, which has more than 22,000 views, she advises people to focus on getting these nutrients from food and don’t overload on supplements if they don’t have any deficiencies. 

Ms Andrews said that when excess vitamins flood the bloodstream, they form free radicals. 

According to the National Cancer Institute, these are unstable molecules that attack DNA and disrupt normal cell function, causing cells to mutate and become cancerous. 

One study conducted last year found that when cancer patients and those at an increased risk of the disease took vitamin C and E supplements, new blood vessels formed within lung cancer tumors. 

This caused tumors to grow more quickly and spread to other areas of the body. 

Additionally, a study from The Ohio State University found that male smokers who took high doses of vitamins B6 and B12, which are meant to help red blood cells form, had a four-fold increased risk of lung cancer compared to men who didn’t take the supplements. 

The researchers said at the time: ‘These are doses that can only be obtained from taking high-dose B vitamin supplements, and these supplements are many times the US Recommended Dietary Allowance.’ 

However, studies on these effects have largely been observational, meaning they don’t show a direct cause. Other studies have also failed to show a link between high-dose supplements, but experts urge caution anyway.

However, when consumed through food and at normal quantities, nutrients like vitamin C act as antioxidants, which have been shown to neutralize free radicals. 

Citrus foods like lemons amd limes are high in vitamin C, with one orange containing nearly the recommended daily intake of 65 to 90 milligrams.

Citrus foods like lemons amd limes are high in vitamin C, with one orange containing nearly the recommended daily intake of 65 to 90 milligrams.

Dietary supplements are not strictly regulated by authorities like the FDA, so it’s difficult to know how much of the daily value is actually in one pill. 

However, Ms Andrews said that getting nutrients like vitamin C and B12 through food won’t put you at risk of consuming toxic doses.  

She said: ‘You’re never going to reach that high amount with food.’

Citrus foods are high in vitamin C, with one orange containing nearly the recommended daily intake of 65 to 90 milligrams. 

Meanwhile, animal proteins like red meat, eggs, and fish are rich in nutrients like vitamin B12.

Ms Andrews also cautioned that unless you are especially deficient in certain nutrients, you likely don’t need a supplement to begin with. 

She said: ‘Unless you have a prescription from your doctor, food is enough.’

Experts also suggest that while nutrients like calcium and fiber have been shown to reduce the risk of breast and colon cancer, it’s best to get them from food rather than supplements. 

Similar to food and drinks, the body absorbs supplements through the small intestine, where they travel directly to the bloodstream. 


Source link

19 12, 2024

XRP Price Breaks Out On The Daily Chart, Rise To $5.85 Is Possible If This Happens

By |2024-12-19T05:31:51+02:00December 19, 2024|Crypto News, News|0 Comments

The recent XRP price action has been highlighted by another notable surge that saw it reaching just above $2.7 briefly again after a 9% surge on December 17. Although the XRP price was rejected immediately after reaching this level, it continues to exhibit bullish momentum on the daily timeframe chart. Interestingly, popular crypto analyst and XRP advocate Dark Defender recently shared his insights on X, highlighting key price levels that could pave the way for an XRP price surge to $5.85.

Breakout Confirmed As XRP Price Hits $2.72

Dark Defender, known for his consistent bullish stance on XRP even during its prolonged bearish phase, pointed out the significance of the $2.72 price level, which has acted as a support and bounce point. In a recent price outlook, he noted that XRP has been so far following his predicted trajectory, citing the achievement of a $2.72 target he shared two days prior. This validation further strengthens his confidence in the token’s current trajectory.

The significance of $2.72 becomes clearer in light of XRP’s breakout on December 15 from a downward-sloping resistance trendline that has been in play since December 3 on the 4-hour chart. Following this breakout, the XRP price rallied to touch $2.72 before facing rejection and started a short-term decline that brings into focus other critical support levels to keep an eye on.

With this in mind, Dark Defender’s new technical analysis points to $2.42 and $2.52 as the next two notable support levels to watch. Should the price breach the $2.52 level, $2.42 is expected to act as the most crucial bounce point just above the downward sloping resistance trendline that could reignite bullish momentum. A rebound from $2.42 would, in the analyst’s view, set the stage for another upward surge towards higher resistance levels. 

Source: X

Projected Rise To $5.85: Key Price Levels To Watch

The next stages in XRP’s ascent, according to Dark Defender, lie in overcoming pivotal resistance levels. The first step would be to break above $2.72 and retest its current 2024 high of $2.92. A successful break above $2.92 would open up XRP to new price highs in over six years.

Should the XRP price successfully break through the $2.92 mark, the analyst predicts a sure climb toward $3.43 as an intermediate target, which is its current all-time high price that has stood for over seven years. From there, Dark Defender predicted continued bullish momentum that would drive the token to a long-term target of $5.85. 

At the time of writing, XRP is trading at $2.51 with a market cap of $144 billion. Reaching $5.85 would translate to a 133% increase in price and a market cap of $351 billion.

XRP price chart from Tradingview.com
Price shows strength despite bearish pressure | Source: XRPUSDT on Tradingview.com

Featured image created with Dall.E, chart from Tradingview.com

Source link

19 12, 2024

Meme Coins Propel Solana’s DApp Revenue to Unprecedented Heights: What You Need to Know

By |2024-12-19T05:19:58+02:00December 19, 2024|News, NFT News|0 Comments


The world of decentralized finance has been buzzing with the latest news that meme coins are significantly boosting Solana’s decentralized application (DApp) revenue. As the popularity of these coins continues to grow, they have sparked a substantial increase in revenue for Solana, marking a notable shift in the landscape of cryptocurrency transactions.

Solana’s Revenue Record Breakthrough

In November 2024, Solana’s DApp revenue reached a staggering $365 million, setting a new monthly record for the blockchain. A significant portion of this revenue spike is attributed to meme coin-related transactions, which have captivated a wide audience due to their viral nature and community-driven dynamics. According to a report from Syndica, the bulk of this revenue, a whopping 84%, was funneled through Solana’s decentralized finance (DeFi) ecosystem. This trend demonstrates the power and influence meme coins hold in today’s crypto market.

The Role of Meme Coins in Solana’s Ecosystem

The rise of meme coins has not only attracted individual investors but also invigorated various dApps on the Solana network. The leading platform in this surge is Pump.fun, a meme token launchpad that alone contributed $106 million in revenue, underscoring the economic potential of these novelty cryptocurrencies. This indicates a 305-fold increase in meme coin DApp revenue throughout 2024, highlighting the role of these playful, yet potent tokens in shaping Solana’s financial landscape.

Emerging Players and Tools

Beyond just the meme coins, the Solana ecosystem has seen growth in other innovative tools and platforms. Telegram bots, such as Trojan, Banana Gun, and BONKbot, have emerged as pivotal players, amassing significant revenue streams second only to meme coins. These bots facilitate seamless investments and transactions directly through messaging platforms, catering to meme traders who are looking to capitalize on new opportunities quickly.

Furthermore, the advent of decentralized physical infrastructure (DePIN) within Solana is opening new avenues for revenue generation. For example, protocols like Render, Nosana, Helium, and Hivemapper are in high demand, bolstering revenue with real-world services by utilizing blockchain resources.

Implications for the Crypto Market

The surge in Solana’s revenue fueled by meme coins suggests a broader trend in the decentralized finance space. As these coins continue to gain traction, they could drive further innovation and attract more developers to build unique applications on the Solana blockchain. Such growth is critical as it pushes the boundaries of what blockchain technology can achieve, making the space more enticing for both investors and developers.

In summary, the influence of meme coins on Solana’s DApp revenue cannot be understated. These tokens have shown that beyond their surface-level humor and novelty lies a potent economic force capable of reshaping financial ecosystems. As Solana continues to capitalize on this trend, it will be interesting to see how this narrative influences other cryptocurrencies and blockchains. For further insights into the impact of meme coins on the crypto world, you can explore the implications of recent meme coin scandals.

This dynamic evolution presents an exciting frontier for the cryptocurrency market, promising new developments that could redefine digital finance as we know it. As the popularity and impact of meme coins grow, keeping a close eye on their trajectory will be essential for understanding the future of blockchain technology. For those interested in diving deeper into this phenomenon, additional details and statistics are available at crypto.news.

Warning : This information is indicative and without guarantee of accuracy. Consult a professional before making any decision.


Source link

Go to Top