Notice that today’s pullback to the 20-Day line was the first test of a previous resistance area since last week’s bullish breakout. The 20-Day line was reclaimed on the same day the consolidation breakout triggered. Since a new lower swing high has been generated as of today, that high at 69.98 can be watched as a potential pivot.
A little further up is a more significant upswing high at 71.79. If crude can get above and stay above that price level, higher prices become more likely. Previous resistance shows around the 70.19 to 73.27 highs, which corresponds to the 50% retracement at 72.97.
Consolidation Breakout Could Trigger Momentum Spike
However, since a breakout of consolidation triggered there is the potential for a more aggressive move higher given the compression of the price range over recent months. In that case the 61.8% Fibonacci retracement is at 74.42 followed the 78.6% retracement at 76.47.
Also, notice that the lower boundary line of a large symmetrical triangle pattern cuts through the area between the two price levels. It also represents potential resistance. It will be interesting to see how crude oil relates to the line given that it represents the triangle.
Downward Pressure Remains
Overall, crude remains in a downtrend. The more significant swing low of the price structure of the trend is at the swing high of 73.27 from early-October. If that price level is exceeded, then a bullish long-term reversal is indicated and an upside breakout through the triangle would have also been triggered. Regardless of current technical indications, patterns evolve or fail if they don’t follow through on the initial distinction.
The Pound to Dollar exchange rate (GBP/USD) gained momentum on Monday following the release of UK’s and US’s preliminary PMI data for December.
On Monday, the Pound (GBP) edged higher against most of its major trading partners after the release of the UK’s preliminary PMI data for December.
The report showed that the UK’s manufacturing index continued to decline, falling from 48.0 to 47.3, which was below the expected increase to 48.2.
However, the UK’s vital services index exceeded market expectations, rising from 50.8 to 51.4, surpassing the modest forecast of 51.0.
This forecast-beating performance in the services sector provided a substantial boost to GBP exchange rates following the data release.
On Monday, the US Dollar (USD) experienced volatility following the release of the country’s preliminary S&P Global PMIs.
Much like the Pound, the US manufacturing index declined slightly, dropping from 49.7 to 48.3, which was below the anticipated rise to 49.8.
Advertisement
On a more positive note, the services index surpassed expectations, climbing from 56.1 to 58.5 instead of falling to 55.7. This marked the highest level in the services sector since October 2021.
Despite this strong economic performance, USD did not gain momentum following the release. Instead, it weakened against the Pound and remained relatively stable against other currencies.
GBP/USD Forecast: UK and US Data to Drive Movement
Looking ahead to Tuesday, the main driver of movement for the Pound US Dollar exchange rate will likely be the release of some high-impact economic data from both the UK and the US.
First up, the UK’s unemployment rate is expected to remain steady at 4.3%, while average earnings (excluding bonuses) are forecast to increase from 4.8% to 5%.
These economic indicators could significantly affect GBP exchange rates, particularly if there is any increased uncertainty regarding the UK’s labour market.
On the US side, the latest retail sales index will be released, and if the data meets expectations and rises from 0.4% to 0.5%, it could provide a boost to USD exchange rates.
Like this piece? Please share with your friends and colleagues:
International Money Transfer? Ask our resident FX expert a money transfer question or try John’s new, free, no-obligation personal service! ,where he helps every step of the way,
ensuring you get the best exchange rates on your currency requirements.
Cardano (ADA), the native cryptocurrency of the Cardano blockchain, is currently navigating through a period of price consolidation. Despite this, recent data reveals a surge in whale activity on the network, fueling optimism among investors and analysts alike. As of December 17, 2024, on-chain analytics firm Santiment reported a significant rise in high-value transactions, indicating that Cardano could be gearing up for a potential price rally.
Whale Transactions Surge on Cardano Network
The latest data from Santiment highlights a massive increase in whale activity on the Cardano network, with 687 transactions, each worth over $1 million, recorded within the past 24 hours. This surge in whale transactions is a strong indicator of growing institutional interest in Cardano, signaling that large investors are positioning themselves for a potential price rally. Whales are known to have a significant impact on the price of cryptocurrencies, and their increased activity on Cardano suggests that they foresee positive price movement in the near future.
Despite the rise in whale transactions, Cardano has remained relatively stagnant, trading within a narrow range. Over the past week, ADA has been consolidating between $1.07 and $1.14. This consolidation is crucial as it will determine the short-term direction of ADA’s price. While the whale activity is a bullish signal, the price action within this consolidation range will be key in determining whether Cardano can break upward or face a further decline.
Technical Analysis: Key Levels for ADA
In terms of technical analysis, Cardano’s price is currently facing a pivotal moment. ADA appears to have formed a bearish head and shoulders pattern, a chart formation typically indicative of a potential price decline. However, the pattern is not yet complete, and ADA continues to trade within the consolidation range of $1.07 to $1.14. This range is crucial for determining the next major move in ADA’s price.
If ADA breaks above the $1.14 level and closes a daily candle above this threshold, it would invalidate the bearish head and shoulders pattern. This could trigger a 43% rally, pushing ADA’s price toward the $1.63 mark. A breakout above this level would also signal a shift in momentum, with buyers gaining control and further bullish price action likely to follow.
On the other hand, if ADA fails to break upward and instead breaks below the $1.07 support level, it could confirm the bearish pattern. This would suggest a potential price decline of 24%, with ADA possibly reaching the $0.78 level. The bearish outlook would also be confirmed by the continuation of the descending trend, which would indicate increased selling pressure in the market.
ADA’s Relative Strength Index (RSI) and Market Sentiment
At the time of writing, ADA’s Relative Strength Index (RSI) stands at 52, which is well below the overbought zone. This indicates that there is still room for the asset to rise, as it is not yet showing signs of being overbought. A neutral RSI reading typically suggests that the asset could either rise or fall, depending on other market factors, such as whale activity and broader market sentiment.
Despite the consolidation phase, ADA’s trading volume has surged by 50% over the past 24 hours. This increase in trading volume suggests that market participants are becoming more active, and investor interest in ADA is growing. The rise in volume could also mean that the current consolidation phase is nearing an end, and a breakout could be imminent.
Conclusion: What’s Next for Cardano (ADA)?
Cardano (ADA) is currently at a crossroads. Whale activity, along with the rising trading volume, suggests that large investors are positioning themselves for potential upside, but the price action is still stuck in a consolidation phase. The key to ADA’s next move lies in breaking through the $1.14 resistance level, which could signal the beginning of a significant rally. However, if ADA fails to break upward and falls below the $1.07 support, the bearish outlook could lead to a price decline toward $0.78.
For now, investors should keep an eye on these critical levels and watch for any signs of a breakout or breakdown. If Cardano can break out of its consolidation range and invalidate the bearish head and shoulders pattern, it could see significant upside momentum. However, the market sentiment and whale activity will continue to play a crucial role in determining the future direction of ADA’s price.
Measured moves can be used from the nearby swings to identify an upside target from recent swings. On the chart it takes the form of an ABCD pattern. The pattern looks for price symmetry between the two advancing swings, AB and CD. Other larger patterns also identify other price target levels on the chart.
The pink ABCD pattern on the chart shows the closest swings. An initial target from this pattern is up at 4.33. That is a target well above the top of the recent symmetrical triangle at 3.64. It would align with the potential for a pickup in momentum following the triangle breakout.
Triangle Top at 3.64
Nonetheless, an initial upside breakout and bull trend continuation signal is triggered above the recent highs of 3.56. That would put natural gas well on its way to approaching the top of the triangle at 3.64. Certainly, bullish momentum has the potential to have natural gas bust right through that high and head towards higher targets. Higher targets, prior to reaching 4.33, would be around the 38.2% retracement at 3.85.
Potential Inside Week in Process
Although it continues to look like there is a good chance this week will end as an inside week, if it does it sets up for the potential of a weekly inside week breakout for next week. Further up from the 38.2% retracement is a extended target for a rising ABCD pattern (purple) at 4.06.
Also, let’s consider the 4.33 target along with other price levels. Looking at the chart can be seen that there is the confluence of several indicators starting from the 4.06 price level. The target price range goes to 4.39 and then 4.50, followed by 4.56. Resistance could be seen anywhere within that zone, if it is reached.
For a look at all of today’s economic events, check out our economic calendar.
The XRP price has recently gained attention, reaching new heights as it surged past $2.80 at the beginning of the month, marking its highest value in 6 years. As with other altcoins, the XRP price surge is triggered by the recent rise in Bitcoin price.
When Bitcoin price rises, it tends to pull along other altcoins, as seen in the current bull market. Similarly, analysts predict that as Bitcoin price surges towards the $120,000 mark by 2025, altcoins like XRP, XLM and RCOF could realize price increases, potentially doubling in value.
Bitcoin Price Surge: A Catalyst for XRP Price Growth
At press time, theXRP price is changing hands at $2.43, a decline of 5.7% in the last week and 3% in the past 24 hours. Analysts have predicted that if XRP price crosses the $2.65 resistance level, it could lead to a breakout that could see the price surge to $4.5 and even a possible $10 mark in the long run.
The XRP price growth for over four years plateaued until the recent election to the office of Trump, who is known for his pro-crypto stance. As the Bitcoin price surged, the XRP price rose to the $2.8 mark, a high in over 6 years.
The Bitcoin price potential to hit $120,000 by 2025 is a major catalyst for the overall crypto market, including a rise in XLM, RCOF, and the XRP price. Again, the growing role of XRP in cross-border payments and blockchain innovations will also have a long-term effect on the XRP price surge.
XLM: Prediction for Price to Surge 350% to $2
XLM, Stellar native token, is poised for a notable upward swing as experts predict the token could reach $2. At press time, XLM is trading at $0.4249, a decline of 4.5% in the past 24 hours. Despite this pullback, technical analysis indicates that XLM is demonstrating a bullish price action in its daily timeframe. If XLM closes the daily candle above the $0.47 level, it could rise to $0.63 and further to $3.04.
As the Bitcoin price surge nears the $120,000 mark, this could be a major catalyst in the growth of XLM, RCOF and the XRP price. XLM continues to gain traction due to its role in transaction fees and facilitating exchanges between different currencies.
XLM’s integration of anchors to easily convert fiat currencies into digital assets on its networks enables smooth and rapid exchange that could see the XLM price grow. Similarly, this aligns with the larger crypto market rally powered by the rise of Bitcoin price and demand for blockchain solutions globally.
RCOF: The AI-Powered Altcoin Poised for Exponential Growth
As Bitcoin price rises towards $120,000, its effects will be felt across the cryptocurrency market, with a keen interest in XLM, RCOF and the XRP price. At the same time, RCOF’s groundbreaking features and growth potential see the price double.
The RCOF token is unique as it offers a decentralized AI-powered Robo-advisor that provides investors with personalized investment strategies that resonate with a user’s financial goals and risk tolerance.
In addition, the Robo-advisor gives investors access to data-driven insights that offer guidance on buying and selling assets when the time is right for maximum gains.
With this tool, investors will no longer depend on guesswork or emotional bias when trading. Similarly, this makes the platform ideal for new and seasoned investors, as they don’t need to have brokers or financial advisors.
Again, the Robo-advisor monitors market conditions and adjusts an investor’s portfolio in real-time. Therefore, investors can enjoy a hands-free trading experience like having a personal financial advisor 24/7.
Finally, security is paramount for RCO Finance. SolidProof has rigorously audited the platform’s smart contract to confirm they are free from vulnerabilities. Similarly, investors can trade confidently as the platform adheres to high-security standards.
RCOF Presale: Seize the Opportunity Before the Big Surge
The ongoing RCOF presale is creating a buzz in the crypto market as investors anticipate gains once the Bitcoin price hits $120,000. Similarly, analysts predict that the XLM, RCOF and the XRP price could double as the Bitcoin price soars.
The RCOF presale is in stage 4, with tokens priced at $0.077, as investors flock to be part of this revolutionary project. Early investors can be part of explosive gains, as analysts predict a 45,000% ROI on RCOF. The tokens are selling out fast, with over 36% already sold out in this stage as investors await the big breakout.
Besides the financial gains, RCOF offers investors staking rewards and governance voting rights on key protocol upgrades. This gives investors direct influence over the growth and development of the platform.
Take advantage of this golden opportunity to ride on the effects of a Bitcoin price surge. Join the RCOF presale today.
For more information about the RCO Finance (RCOF) Presale:
Experts are projecting DeFi to be the fastest-growing sector in 2025. The top altcoins in this sector, Filecoin (FIL) and VeChain (VET), are already soaring into 2025. Rollblock’s (RBLK) crypto casino has also incorporated elements of DeFi with its signature gambling token. This crypto gambling juggernaut is expected to use DeFi to transform revenue into value that sends RBLK over 100x higher at the end of its crypto presale.
Filecoin Data Storage Essential to Expanding DeFi Sector
Filecoin’s data storage protocol is an essential element of the growing DeFi revolution. DeFi applications create an enormous volume of data in their transactions that must be securely and efficiently stored by Filecoin’s protocol.
The Filecoin price is already roaring into 2025 with an almost 3% rally for today alone. Today’s rally in the Filecoin price brings it to over 50% growth for the last month.
Experts project that Filecoin could go more than 100% higher in 2025 from its current price of $6.60.
VeChain was already a top destination for DeFi applications due to its specialized blockchain design which can manage the enormous transaction volumes involved. Now VeChain’s decentralized governance upgrade has made it the top altcoin in the DeFi sector.
The VeChain price was already rocketing higher this month before the upgrade, with almost 120% growth. A further 10% rally in the VeChain price has given it extra momentum heading into 2025.
Experts believe that this current price momentum could carry VeChain over 200% higher in 2025.
Rollblock’s Blend of DeFi and Crypto Gambling Drives Astronomical Growth
Rollblock’s incorporation of DeFi has it on course to vastly outperform even Filecoin and VeChain in 2025. This top altcoin is using DeFi to transform the enormous revenue potential of the $500 billion gambling industry into growth for its tokens.
Rollblock’s DeFi approach to crypto gambling works through a system of weekly buybacks that employ a maximum of 30% of the casino’s revenue for that period.
Rollblock turns this revenue into growth by burning the first 60% of these tokens each week. These weekly burn events create pressure on the market price that sets RBLK on an inexorable trajectory higher.
The remaining 40% of these tokens are awarded to holders who support the platform through staking. The income generated by these staking awards also encourages demand for the tokens by adding a market-beating yield for holding them.
Rollblock generates the revenue for this program through its platform of 7,000 premier casino games and world-beating sports betting. Rollblock has the fastest growing crypto-gambling platform, with thousands of new players signing up each week.
Rollblock’s innovative incorporation of DeFi into crypto gambling is expected to send RBLK rocketing over 100x higher from its crypto presale price of $0.0415. Investors are scrambling to get in on this crypto presale now because a handful of whales could buy out its final three stages in a matter of days.
Discover the Exciting Opportunities of the Rollblock (RBLK) Presale Today!
Silver price falls 0.28%, signaling potential further downside.
Technical indicators suggest fading bullish momentum, with a near-term focus on the 200-day SMA at $29.55.
Resistance levels include the 100-day SMA at $30.57 and the 50-day SMA at $31.54; support could extend to $27.69 if the downtrend continues.
Silver price drops below the 100-day Simple Moving Average (SMA) of $30.57, extending its losses to four consecutive days, as the Greenback remains firm. At the time of writing, the XAG/USD trades at $30.42 a troy ounce, down 0.28%.
XAG/USD Price Forecast: Technical outlook
Silver continues to consolidate within the $30.00-$31.00 range for the last three trading days, clearing on its way to the bottom of the range, the 50 and 100-day Simple Moving Averages (SMAs).
Although the grey metal continues to respect the trend of higher highs and higher lows, bullish momentum seems to be fading as the XAG/USD spot price approaches the 200-day Simple Moving Average (SMA) at $29.55.
If Silver clears the latter, the bias will shift bearish, paving the way for testing $27.69, the September 6 swing low, followed by the August 8 low of $26.44.
On the upside, the 100-day SMA at $30.57 must be cleared before facing key resistance at the 50-day SMA at $31.54. On further strength, the next resistance would be the December 12 peak at $32.32.
XAG/USD Price Chart – Daily
Silver FAQs
Silver is a precious metal highly traded among investors. It has been historically used as a store of value and a medium of exchange. Although less popular than Gold, traders may turn to Silver to diversify their investment portfolio, for its intrinsic value or as a potential hedge during high-inflation periods. Investors can buy physical Silver, in coins or in bars, or trade it through vehicles such as Exchange Traded Funds, which track its price on international markets.
Silver prices can move due to a wide range of factors. Geopolitical instability or fears of a deep recession can make Silver price escalate due to its safe-haven status, although to a lesser extent than Gold’s. As a yieldless asset, Silver tends to rise with lower interest rates. Its moves also depend on how the US Dollar (USD) behaves as the asset is priced in dollars (XAG/USD). A strong Dollar tends to keep the price of Silver at bay, whereas a weaker Dollar is likely to propel prices up. Other factors such as investment demand, mining supply – Silver is much more abundant than Gold – and recycling rates can also affect prices.
Silver is widely used in industry, particularly in sectors such as electronics or solar energy, as it has one of the highest electric conductivity of all metals – more than Copper and Gold. A surge in demand can increase prices, while a decline tends to lower them. Dynamics in the US, Chinese and Indian economies can also contribute to price swings: for the US and particularly China, their big industrial sectors use Silver in various processes; in India, consumers’ demand for the precious metal for jewellery also plays a key role in setting prices.
Silver prices tend to follow Gold’s moves. When Gold prices rise, Silver typically follows suit, as their status as safe-haven assets is similar. The Gold/Silver ratio, which shows the number of ounces of Silver needed to equal the value of one ounce of Gold, may help to determine the relative valuation between both metals. Some investors may consider a high ratio as an indicator that Silver is undervalued, or Gold is overvalued. On the contrary, a low ratio might suggest that Gold is undervalued relative to Silver.
Solana ($SOL) slowly regained its momentum, with optimistic projections noting its potential to double its all-time high of $260 by 2025.
This bullish outlook originates from increasing institutional adoption, major partnerships like Visa’s stablecoin integration, and robust technical indicators such as a bullish flag pattern.
On the other hand, some promising projects like PlutoChain ($PLUTO) could be worth a look in the coming weeks because of its useful features.
With its first hybrid Layer 2 solution that might expand Bitcoin’s capabilities in areas such as DeFi and more, this project could draw attention once it launches its mainnet.
Could Institutional Adoption Drive Solana Further by Year-End?
Solana ($SOL) seems poised for significant growth as analysts and whales remain optimistic about its future. Current projections from Coin Codex suggest that Solana could reach $256 by the end of 2024.
Among the most optimistic ones are projections that insinuate a doubling of Solana’s ATH!
Factors that contribute to this bullish outlook include rising institutional adoption, robust DeFi activity, and strategic partnerships like Visa’s integration of Solana for stablecoin settlements.
Technically, Solana exhibits a bullish flag pattern which signals strong buying momentum and potential for a breakout above current resistance levels.
Its ecosystem’s scalability, capable of processing thousands of transactions per second, positions it as a key player in blockchain technology.
Thinking of expanding into Africa?
Avoid the common mistakes businesses during expansion. Register to learn the common mistakes business make when expanding into Africa.
Written by seasoned experts, who have over 16 years of experience in Free Zones development. Learn more.
On the other hand, challenges like network congestion and market volatility persist, but ongoing advancements, including Layer-2 solutions, could address these issues and bolster investor confidence.
While some forecasts point to challenges that may limit dramatic price increases, other analysts argue that favorable market conditions could drive Solana to new all-time highs.
All in all, if Solana wants to double its price, first it must confirm $250 as a strong support level to avoid significant price corrections.
If, by any chance, Solana fails to hold $250, it could signal a reversal of its bullish trend, leading the price in a downward direction.
PlutoChain Could Unlock Bitcoin’s Potential for Decentralized Innovation
PlutoChain ($PLUTO) could reshape Bitcoin by addressing its long-standing limitations in supporting complex applications.
Traditionally, Bitcoin’s 10-minute block time has been a barrier to decentralized innovation, especially compared to emerging blockchains like Ethereum, Solana, and Cardano, which offer faster transactions and broader development opportunities.
PlutoChain could bridge this gap with an innovative Layer-2 blockchain that reduces the average block time to just 2 seconds.
This improvement may enable smart contracts to operate on Bitcoin’s secure infrastructure and pave the way for a new era of Bitcoin-based innovation.
Thanks to its hybrid Layer-2 blockchain for Bitcoin, PlutoChain could potentially support a wide range of applications, from DeFi and NFTs to AI and metaverse projects.
Additionally, its Ethereum Virtual Machine (EVM) compatibility allows developers to migrate Ethereum-based dApps seamlessly to Bitcoin. This might combine Ethereum’s flexibility with Bitcoin’s unmatched security.
Functionality such as this one could position PlutoChain as a unique platform that might deliver Ethereum and Solana-like applications within the Bitcoin ecosystem, possibly reducing reliance on other networks. Furthermore, PlutoChain’s features could include rapid scalability, low transaction costs, and strong security.
Another unique feature is community governance which could empower the users to influence the protocol’s evolution in the direction they choose using a special voting system.
This pioneering approach could position PlutoChain as a potential game-changer and draw attention from developers and whales around the world.
Solana’s journey to doubling its ATH is far from guaranteed, but the technical setup and market trends offer a promising outlook.
Meanwhile, PlutoChain could address Bitcoin’s limitations with a groundbreaking Layer-2 solution.
This feature might enable smart contracts and applications like DeFi and NFTs, possibly bringing Ethereum-style functionality to Bitcoin.
Not only that but its EVM compatibility and community governance might make it a project that could reshape Bitcoin’s role in the future.
Disclaimer: It’s important to note that participating in presales carries risks, including market volatility and potential project delays. Please conduct thorough research, understand the risks of market volatility, and seek professional advice before engaging with any blockchain project. Future-oriented statements are speculative and may not be modified.
Join Our Telegram channel to stay up to date on breaking news coverage
The non-fungible token market has surged again today, following the footprints of the broader crypto bear market, which is also skyrocketing. In a remarkable turn of events, the NFT market, spearheaded by Ethereum NFTs, has experienced a dramatic resurgence, with daily trading sales volume climbing past $50 million for the second consecutive day. This NFT surge signals renewed investor confidence and growing interest in NFT items.
NFTs Record $55M In Daily Sales Volume
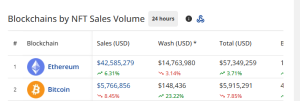
Data compiled by cryptoslam.io, an on-chain crypto market data aggregator and a multi-chain non-fungible token explorer, indicates that the non-fungible token market has surged again in daily trading sales volume. In the past 24 hours, the non-fungible token market has amassed a trading sales volume of $55 million, up 3.29% from the past days. The no of traders acquiring NFTs have surged by 18%.
The NFT market climbed past $50 million in sales volume after many blue-ship non-fungible token collections exploded in floor price value and trading sales volume. On December 16, the non-fungible token market recorded a trading sales volume of $52 million, the highest trading sales volume since April 2024. The NFT market saw more than 31,000 collectors buying NFTs.
Ethereum, the blockchain network powering Ether crypto and renowned in the NFT market for powering the majority of blue-chip non-fungible token collections, is today’s NFT market leader. In the past 24 hours, the Ethereum-based non-fungible token collections have amassed a trading sales volume of $42 million, taking over 70% of the total market sales. During this time, the Ethereum NFT trading sales volume has further increased by 6.31% from the past month.
Top NFT Gainer, Today December 17, 2024
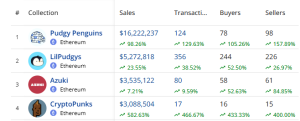
Pudgy Penguins, a non-fungible token created by the toy brand Pudgy Penguins featuring a fixed supply of 8,888 NFTs hosted on the Ethereum blockchain network, is the top gainer in the NFT market. In the past 24 hours, the Pudgy Penguins non-fungible token collection has raised a sales volume of $15 million. During this period, the Pudgy Penguins NFT sales volume has increased by 96% from the past month.
CryptoPunks, a non-fungible token featuring a fixed supply of 10,000 pixilated Ethereum NFTs previously from the digital asset firm Larva Labs but now managed by the Bored Ape creator Yuga Labs, is another top gainer today. In the past 24 hours, the CryptoPunks NFT collection has amassed a trading sales volume of $3 million. During this time, the CryptoPunks NFT sales have surged by 582% from the past day.
Related NFT News:
Newest Meme Coin ICO – Wall Street Pepe
Audited By Coinsult
Early Access Presale Round
Private Trading Alpha For $WEPE Army
Staking Pool – High Dynamic APY
Join Our Telegram channel to stay up to date on breaking news coverage
Canada’s inflation and the United Kingdom’s inflation hint at more central banks’ action.
The Federal Reserve will announce its decision on monetary policy on Wednesday.
XAU/USD posted a fresh weekly low, could soon revisit the $2,600 mark.
Spot Gold settled a fresh weekly low of $2,633.00 a troy ounce early in the American session, bouncing just modestly from the level in a risk-averse environment. Following a mixed performance of its overseas counterparts, Wall Street is firmly down, with the three major indexes trading in the red.
Investors got mixed macroeconomic headlines, as United States (US) Retail Sales were up a modest 0.7%, better than the 0.5% expected, yet not enough to boost the mood. The country also reported that November Capacity Utilization rose 76.8%, worse than the 77.3% expected, while Industrial Production in the same period fell 0.1%, missing the 0.3% advance anticipated by market analysts.
Meanwhile, the United Kingdom (UK) published its monthly employment figures, which showed that the ILO Unemployment Rate stayed unchanged at 4.3% in the three months to October, while the number of people claiming jobless benefits climbed by only 0.3K in November. Finally, the report showed an unexpected advance in wage pressures as Average Earnings excluding Bonus grew by 5.2% 3M YoY in October, while including bonuses were also up by 5.2%, both surpassing the market’s expectations.
Additionally, Canada reported that the Consumer Price Index (CPI) declined to 1.9% on a yearly basis in November, below the market expectation of 2%. On a monthly basis, the CPI matched the 0.4% increase recorded in October.
The US Dollar trades mixed across the FX board, firmer against commodity-linked currencies and barely down against European rivals, as the Federal Reserve (Fed) monetary policy announcement looms. The Fed will unveil its decision on monetary policy on Wednesday, and is widely anticipated to cut the benchmark interest rate by 25 basis points (bps). The focus will then be on the Summary of Economic Projections (SEP) and Chairman Jerome Powell’s words on what 2025 may bring.
XAU/USD short-term technical outlook
From a technical point of view, the daily chart for the XAU/USD pair suggests the pair may extend its slide. It met buyers around a now flat 20 Simple Moving Average (SMA), providing dynamic resistance at around $2,655. The 100 and 200 SMAs keep heading higher well below the current level, with the 100 SMA developing in the $2,602 region. Finally, technical indicators turned lower. The Momentum indicator remains within neutral levels, but the Relative Strength Index (RSI) indicator aims lower at 46, reflecting mounting selling pressure.
The near-term picture is bearish. The XAU/USD trades below all its moving averages in the 4-hour chart, with the 20 SMA accelerating south right above converging 100 and 200 SMAs. Technical indicators, in the meantime, turned marginally higher but remain within negative levels, falling short of supporting a recovery in the upcoming Asian session.