About Editorial team of BIPNs

Main team of content of bipns.com. Any type of content should be approved by us.
18 12, 2024

Artificial sweeteners and dyes in dietary supplements may not readily biodegrade

By |2024-12-18T11:23:24+02:00December 18, 2024|Dietary Supplements News, News|0 Comments


Writing in the Journal of Pharmaceutical and Biomedical Analysis, the researchers highlighted a “potential significant environmental concern” that extends “beyond dietary supplements to all Pharmaceutical and Personal Care Products (PPCP), including drugs and medical devices.”

The study is reportedly the first to examine the biodegradability of nine complex supplements using methods that detect persistent compounds even at low levels.

The researchers noted that the study underscores the importance of evaluating the environmental impact of excipients in dietary supplements rather than just the functional component on which the health benefits are marketed.

They noted that this approach aligns with the European Green Deal, the “field to fork” strategy for sustainable food production, and the new “European Union Strategic Approach to Pharmaceuticals in the Environment”.

“Promoting a regulatory framework with specific labelling rules to indicate whether each ingredient is natural or synthetic, along with biodegradation data, is crucial,” they wrote.

“This would enable consumers to make informed choices and help healthcare professionals, such as doctors and pharmacists, to tailor their advice considering these environmental aspects.”

Impact of synthetic additives

Experts advise that artificial substances such as sweeteners, preservatives and dyes only partially undergo a biotransformation in the human body when we consume them. Their metabolites get into sewage and water systems in unchanged form, accumulating as micropollutants in water, soil, air, plants and animals.

Studies indicate that more than 700 emerging pollutants are being added to the environment daily, with artificial sweeteners being recognized “as a new class of environmental contaminants due to their extreme persistence and ubiquitous nature.”

In addition to harming aquatic habitats and cyanobacteria, they can turn into even more toxic metabolites through their metabolic pathways, decreasing microbial populations and adversely affecting fish.

Study details

Scientists from Aboca SpA used the Organisation for Economic Cooperation and Development (OECD) 301 F ready biodegradation test (RBT) to evaluate the biodegradability of nine dietary supplement products, some of which were manufactured by Aboca Spa, and some purchased from a local pharmacy.

They developed and validated a chromatographic method to quantify the presence of acesulfame, sucralose, tartrazine and carmoisine in the RBT mineral medium.

Their methods reportedly improved the sensitivity and specificity of the analysis, effectively detecting the compounds at very low concentrations.

Although all the products were found to be readily biodegradable, the synthetic sweeteners and dyes were not. The analytical methods revealed that the compounds “remained almost entirely unchanged at the conclusion of the RBT.”

Source: Journal of Pharmaceutical and Biomedical Analysis,
Volume 255, 116575, doi: 10.1016/j.jpba.2024.116575
“Biodegradability of dietary supplements: Advanced analytical methods to study the environmental fate of artificial sweeteners and dyes”
Authors: L. Mattoli et al.


Source link

18 12, 2024

Bitcoin price prediction by AI

By |2024-12-18T11:22:08+02:00December 18, 2024|Crypto News, News|0 Comments

As Bitcoin continues to evolve as a major player in the digital asset space, savvy investors and traders remain keenly interested in the nuances of its intraday price behavior. Understanding the structure and key reference points—such as Value Areas and VWAP (Volume-Weighted Average Price)—can help market participants identify potential turning points, gauge short-term sentiment, and make more informed decisions. Whether you’re a long-term holder looking for opportune accumulation levels or a day trader seeking an edge, studying these metrics can provide valuable insights. Remember, however, that no analysis guarantees profits. Always invest and trade Bitcoin at your own risk.

Current Market Structure for Bitcoin Futures
As of the latest observations, Bitcoin Futures are trading near today’s VWAP, situated around $107,425. The market is comfortably contained within the day’s value area, which currently stretches from a Value Area Low (VAL) of $106,900 to a Value Area High (VAH) of $108,190. Being at VWAP and inside the day’s value area typically indicates a balanced environment, where buyers and sellers are reaching a level of agreement on price.

In addition to these intraday markers, a few historically significant reference points linger just outside the current trading range:

  • Yesterday’s Closing VWAP: ~106,200
  • Yesterday’s VAH: 107,865
  • Yesterday’s Naked VAL: 105,405

These levels represent areas where trading previously found a fair balance or, in the case of the naked VAL, a level that hasn’t been revisited since it was established. Such points can become magnets for price, as future activity may gravitate toward them to test whether previous balances still hold relevance.

Why These Levels Matter to Bitcoin Investors and Traders

  1. Identifying Support and Resistance:
    Traders often look for price responses at known value areas. For instance, if Bitcoin Futures approach yesterday’s VAH (107,865) and fail to break above, it could signal that buyers are not strong enough to push the market higher, potentially offering a bearish cue. Conversely, breaking above that level might indicate buyers taking control.

  2. Spotting Potential Ranges and Breakouts:
    Currently, Bitcoin Futures remain confined within a fairly well-defined range of roughly 105,400 to 108,200. Trading within this band suggests range-bound activity—something both short-term traders (scalpers, day traders) and swing traders can exploit, buying near lower value references and selling near higher ones, until a decisive breakout occurs.

  3. Mean Reversion and Fair Value:
    The VWAP, which is near the current price, acts as a “fair value” indicator. When price sits at VWAP, it suggests a balanced auction. Move significantly above VWAP and watch for potential mean-reversion opportunities if buyers can’t maintain momentum. Drop below VWAP and, if bulls fail to reclaim it, it could hint at building bearish pressure.

  4. Guiding Future Projections:
    Levels such as yesterday’s naked VAL at 105,405 remain key markers below the current market. If price heads south, traders know where they might find a structural stopping point or a place where aggressive buyers could re-emerge.

Bitcoin Futures vs. Spot BTC
It’s important to note that this analysis focuses on Bitcoin Futures. While Bitcoin Futures often lead or closely mirror the spot market, their prices and levels can differ from BTC/USD pairs on various exchanges. Differences in liquidity, funding, and market participants can cause futures to trade at premiums or discounts relative to spot prices. Traders should always be aware of these discrepancies and adjust their strategies accordingly.

Slightly Bullish Bias, but Exercise Caution
The AI-derived directional bias score for Bitcoin is currently +1, indicating a slightly bullish tilt. However, this is far from a clear directional mandate. Until Bitcoin Futures break firmly above the key overhead levels (such as today’s VAH at 108,190 or yesterday’s VAH at 107,865) and sustain gains, the market may continue to oscillate within the established range. Should price fail to hold support near the VAL of 106,900, it might slide toward deeper references like 105,405, testing the market’s resolve.

Conclusion and Risk Advisory
Today’s balanced trading environment in Bitcoin Futures suggests that neither buyers nor sellers have a decisive upper hand. For investors and traders, this can mean waiting patiently for clearer signals before committing to a larger position, or cautiously engaging in range-based strategies.

Always remember to visit ForexLive.com for different views, and that investing and trading in Bitcoin—whether through spot markets or futures—is inherently risky. Price movements can be swift and unpredictable, and no level or indicator is foolproof. The analytical frameworks described here are tools to aid decision-making, not guarantees of success. Trade and invest at your own risk, and be prepared for the possibility of losses.

Source link

18 12, 2024

Is protein powder a scam?

By |2024-12-18T09:22:36+02:00December 18, 2024|Dietary Supplements News, News|0 Comments


On TikTok, influencers tout protein powder as key to building muscle and nourishing their bodies – all in a quick, convenient scoop added to coffee or a smoothie.

There’s no question that protein is essential for making muscles, strengthening bones and maintaining your immune system, digestion and hormone levels.

But most protein powders are considered dietary supplements, which raises the question: Do you really need a supplement to get enough protein? And if you do, what kind is best? We asked experts for advice.

Are protein powders necessary?

The “vast majority” of people in the US already get enough protein from the foods they eat and don’t need to take it in supplement form, said Colleen Tewksbury, an assistant professor of nutrition science at the University of Pennsylvania.

Federal guidelines recommend that adults 19 and older consume 0.8g of protein per kilogram of body weight per day. That comes out to 54 grams for a 68kg adult, or 72 grams for a person weighing 91kg. Research suggests, however, that older adults may benefit from adding about 50 per cent more protein, and those who are pregnant, breastfeeding or do regular strength or endurance training may want to double the recommended amount or more.

Whole foods – like chicken, fish, lean meats, yoghurt, cottage cheese, eggs, nuts, beans and lentils – are the best sources of protein, experts said. They offer a variety of other valuable nutrients, like vitamins, minerals, fiber, healthy fats and plant-based compounds, said Wayne Campbell, a professor of nutrition science at Purdue University.

If you’re “just slugging down a supplement” instead of eating real food, “you’ve got your protein, but you’re missing out on a lot of nutrition,” he added.

Most protein powders contain about 20g of protein per serving. That’s roughly equivalent to the amount found in a half-cup of diced chicken breast; two cups of brown rice and beans; three-quarters of a cup of nonfat Greek yoghurt topped with 28g of walnuts; and three tablespoons of peanut butter on two medium slices of whole wheat bread.

And once you’ve met your body’s protein needs, more is not necessarily better, Asst Prof Tewksbury said, since you can’t store extra protein.

Instead, your liver will break it down to be used as calories or stored as fat. Because the kidneys have to eliminate the waste from that process, people with kidney disease should not consume too much protein, she said.

Who might benefit from protein powder?

Protein powder can be useful for certain people, Tewksbury said.

These include those who need to get enough protein with smaller amounts of food – such as cancer patients with limited appetites, or those recovering from major gastrointestinal surgeries who can only consume liquids or small portions of food.

Similarly, older adults who need fewer calories and often have reduced appetites may find that stirring protein powder into oatmeal or yogurt can help them get enough, said Nancy Rodriguez, a professor emerita of nutritional sciences at the University of Connecticut.

About half of women and a third of men 71 and older in the US aren’t meeting federal recommendations for protein. That may increase their risk of muscle loss, which can lead to falls, bone fractures and hospitalization.

If you are trying to build muscle size and strength, research suggests that using a protein powder can help you meet your goals, Prof Rodriguez said. Consuming protein from regular foods can work just as well, she said, but busy athletes often choose to use protein powders for their convenience.

Just keep in mind, Prof Rodriguez said, that “eating protein does not mean you’re going to convert the protein to muscle.” You need a well-designed strength training program and extra calories to put on muscle, she said.

And your body can’t use more than 20 to 40g of protein per meal to make muscle, Asst Prof Tewksbury said. That’s no more than a serving or two of protein powder.

Are there downsides to protein powders?

Because most protein powders are classified as dietary supplements, they aren’t tightly regulated by the federal government, Prof Rodriguez said. They may not contain the amount of protein they claim, and researchers have detected small amounts of heavy metals and in rare cases, anabolic steroids in some protein supplements.

Most protein powders are likely safe, said Dr Stefan Pasiakos, the director of the Office of Dietary Supplements at the National Institutes of Health. But it’s best to choose one marked with a seal from a third party lab, like NSF or US Pharmacopeia, which independently test supplements to ensure they contain what’s on the label and nothing more, he said.

Protein powders are also ultraprocessed foods, and health concerns are associated with certain ingredients used in them.

They can contain added sugars like high fructose corn syrup; or they may be sweetened with artificial sweeteners or other sugar substitutes, like stevia or erythritol, which limited studies have linked to cardiovascular problems, Type 2 diabetes and microbiome changes.

They may also contain emulsifiers, such as lecithin or xanthan gum, which some research suggests can increase gut inflammation.

If you have a medical reason for using a protein supplement, the benefits likely outweigh the potential risks, Asst Prof Tewksbury said. For everyone else, she added, we don’t know enough about their long-term health effects to say if they might increase the risk of chronic conditions.

What should you look for in a protein powder?

Among the many types of protein powders available, whey protein is backed by the most research, Dr Pasiakos said. Made from milk, whey is rapidly digested and is a “complete” protein – meaning it contains enough of the nine essential amino acids, or building blocks to create new proteins in your body.

Most plants are low in at least one essential amino acid, so many powders contain blends of several plant sources to provide a balance of amino acids, Dr Pasiakos said.

“In the grand scheme of things,” he said, the type of protein you choose likely won’t matter much in terms of your ability to build muscle or meet your protein needs, he said. Pea, soy and rice protein powders, for example, have been shown to support muscle building, similar to whey protein in small trials.

More important, Prof Rodriguez said, is to choose one that doesn’t have a lot of extra ingredients, like added sugars, additives or vitamins and minerals in excess of the recommended daily value.

“The simpler, the better,” Dr Pasiakos agreed. NYTIMES

Join ST’s Telegram channel and get the latest breaking news delivered to you.


Source link

18 12, 2024

Will ADA Hit $7 by the End of 2025?

By |2024-12-18T09:20:58+02:00December 18, 2024|Crypto News, News|0 Comments

Cardano (ADA) stands out for its scalable and eco-friendly blockchain design, which makes it one of the most favorite options among developers.

Some Binance analysts believe ADA could reach $7 by 2025, thanks to upgrades like Hydra, increased real-world adoption, and strong staking support. 

Of course, challenges like competition and market swings could play a role too. 

At the same time, PlutoChain ($PLUTO) could be interesting to watch because it aims to integrate advanced features like DeFi and NFTs into Bitcoin’s ecosystem.

This innovation could significantly enhance Bitcoin’s capabilities, potentially transforming it into a more versatile and dynamic platform.

First, let’s take a closer look at Cardano’s potential below.

Can Cardano (ADA) Reach $7 by the End of 2025?

Cardano’s road to $7 depends on some exciting developments and market trends that could boost its value. 

AD 4nXfhETkYB qr 86ZRfzWIkyUGPNvjyBJAJ60DBrAr7zuuQCIwcVcYfOAZqPtLEXG2QgwKVDoknAfMPWvoykKJkpAJLOM30Ured mesP23x29aGLYrZX3vgORYBsIRLlrAZH33ITfYg?key=rb4u4PR

One of the biggest factors is Hydra, its scalability solution. Hydra could improve transaction speed and reduce costs by handling thousands of transactions per second. 

This upgrade might attract more developers and users, especially in the growing world of decentralized applications (dApps) and decentralized finance (DeFi).

Thinking of expanding into Africa?

Avoid the common mistakes businesses during expansion. Register to learn the common mistakes business make when expanding into Africa.

Written by seasoned experts, who have over 16 years of experience in Free Zones development. Learn more.

Metrics also tell a promising story. Total Value Locked (TVL) on Cardano’s network has been climbing steadily, which likely signals the increasing use of its smart contracts. 

More than 70% of ADA is staked, which also shows strong community confidence and consistent rewards for holders. These metrics reflect not just growth but also a committed ecosystem that is willing to back the platform long-term.

Real-world partnerships are another major driver. Cardano is known for its collaborations with governments and enterprises, such as its work with Ethiopia to bring blockchain solutions to education. 

These use cases give Cardano a practical edge and demonstrate how blockchain can solve real problems in everyday life.

Then, there’s the eco-friendly angle. As the blockchain industry focuses more on sustainability, Cardano’s proof-of-stake (PoS) model positions it as a green alternative to energy-heavy networks like Bitcoin. 

This green label could appeal to developers, users, and regulators who are looking for climate-conscious solutions.

Binance analysts remain cautiously optimistic. Many point to Cardano’s steady upgrades and consistent development as indicators of long-term potential. 

Technical analysis also shows positive signs. Indicators like the Relative Strength Index (RSI), trading momentum, and support/resistance levels suggest ADA could break out if market conditions align.

While a $7 target isn’t guaranteed, Cardano’s robust fundamentals, growing partnerships, and eco-friendly ethos position it as a strong contender. If Hydra delivers and adoption keeps rising, this milestone could be within reach.

PlutoChain ($PLUTO) Might Bring DeFi, NFTs, and Unmatched Scalability to Bitcoin’s Ecosystem

PlutoChain ($PLUTO) could change how we see Bitcoin by potentially bringing advanced features like DeFi, NFTs, and AI-driven applications into its ecosystem. 

AD 4nXfVgyo RahzEk1U2cmGuuPmkRjHZDippyr7HjS8m9959bBWovY 4 9UqVJFedwOaLMi3W0zWvQOqDoZJrO5E 9CKkc5l lbePt8CmRdNgYelcj9xKv4 kcDceAOhP4EfO 3SZn?key=rb4u4PRAD 4nXfVgyo RahzEk1U2cmGuuPmkRjHZDippyr7HjS8m9959bBWovY 4 9UqVJFedwOaLMi3W0zWvQOqDoZJrO5E 9CKkc5l lbePt8CmRdNgYelcj9xKv4 kcDceAOhP4EfO 3SZn?key=rb4u4PR

Traditionally, Bitcoin has been limited to being a store of value, but PlutoChain might change that by enabling functionalities that have thrived on Ethereum.

A standout feature of PlutoChain is its EVM compatibility, which could allow Ethereum-based applications to integrate with Bitcoin seamlessly. This may open up new opportunities for developers to leverage Bitcoin’s security while utilizing Ethereum’s flexibility. 

For instance, decentralized applications (dApps) and smart contracts could now bridge the gap between these two leading blockchain networks, which might create new possibilities for decentralized finance (DeFi) and non-fungible tokens (NFTs).

AD 4nXcPiJR2dXYxtylzKN9 Qo6gV2Ec3UyrrVZTeouk PllzzNOfeC8Ro60lwq2xUXRwhs84L3ZYMHK4dYQf0WAm6oWXWyYn8R9KWPPH8fIM1UD7fxZWftrUUHGtjeqfdpXRgOmpTStjw?key=rb4u4PRAD 4nXcPiJR2dXYxtylzKN9 Qo6gV2Ec3UyrrVZTeouk PllzzNOfeC8Ro60lwq2xUXRwhs84L3ZYMHK4dYQf0WAm6oWXWyYn8R9KWPPH8fIM1UD7fxZWftrUUHGtjeqfdpXRgOmpTStjw?key=rb4u4PR

Unlike Bitcoin’s 10-minute block time, PlutoChain operates its own Layer-2 blockchain with a 2-second block time. 

This dramatically improves transaction speed and efficiency, which could make Bitcoin-based applications more practical for everyday use. PlutoChain’s testnet processes over 43,000 daily transactions, which showcases its ability to scale without compromising performance.

Security is a top priority for PlutoChain. The platform has passed rigorous audits by SolidProof, AssureDeFi, and QuillAudits, which ensure a trustworthy environment for developers and users. 

This multi-audit approval potentially gives PlutoChain credibility in an industry where security is non-negotiable.

PlutoChain also aims to empower its community through governance. Holders can vote on major decisions, such as protocol upgrades and new features, which could ensure the platform remains decentralized and user-focused. 

This participatory approach might promote trust and innovation.

PlutoChain’s mix of speed, scalability, and developer-friendly features could position it as a key player in potentially reshaping Bitcoin’s network.

AD 4nXeHtdQAygJ Vnxdt6GfFWn1hgGrRKZYuid3eE9Wey64orz1INgj1n6cu6buTxBj7KB4biBrA7vVF vzGeGhblYpByN7ONjFL 1 A1Hq9C2hb9A U8mt6rhq2LKiixjfcJfoAalxFw?key=rb4u4PRAD 4nXeHtdQAygJ Vnxdt6GfFWn1hgGrRKZYuid3eE9Wey64orz1INgj1n6cu6buTxBj7KB4biBrA7vVF vzGeGhblYpByN7ONjFL 1 A1Hq9C2hb9A U8mt6rhq2LKiixjfcJfoAalxFw?key=rb4u4PR

Cardano’s path to $7 by 2025 looks promising and is likely fueled by its focus on scalability through innovations like Hydra, growing ecosystem adoption, and increasing real-world integrations. 

These advancements position it as a strong contender in the blockchain space, especially with the rising demand for eco-friendly solutions.

At the same time, PlutoChain might potentially redefine Bitcoin’s possibilities by introducing Ethereum-level features like DeFi and NFTs. 

With its fast, secure Layer-2 blockchain and community-driven approach, PlutoChain could continue to gain attention as it approaches mainnet launch.

Stay updated on PlutoChain’s journey by following them on Twitter, Discord, and Telegram.

This article is purely informational and should not be interpreted as financial advice. Readers are encouraged to carry out their own due diligence. Predictions involve risk and may not undergo updates.


Source link

18 12, 2024

XAG/USD hovers around $30.50 within a horizontal channel

By |2024-12-18T08:44:27+02:00December 18, 2024|Forex News, News|0 Comments


  • Silver price consolidates within the horizontal channel pattern.
  • The alignment of the nine- and 14-day EMAs indicates an absence of clear directional momentum.
  • The 14-day RSI consolidates below the 50 mark, suggesting an emergence of the bearish bias.

Silver price (XAG/USD) remains subdued for the fifth successive day, trading around $30.50 per troy ounce during the Asian hours on Wednesday. Analysis of the daily chart indicates a period of market consolidation as the pair is confined within the horizontal channel pattern.

Additionally, the alignment of the nine- and 14-day Exponential Moving Averages (EMAs) suggests that the short-term price movement is experiencing a period of consolidation, lacking a strong directional momentum. However, the 14-day Relative Strength Index (RSI) consolidates below the 50 mark, suggesting an emergence of the bearish bias.

On the downside, the XAG/USD pair may find its primary support around the lower boundary of the horizontal channel at $29.90, followed by a “throwback support” level at its three-month low of $29.65, which was recorded on November 28.

Regarding its resistance, the XAG/USD may test the nine- and 14-day EMAs at $30.82 and $30.90, respectively. A break above these levels could cause the bullish bias to re-emerge and help the Silver price to retest its six-week high of $32.28, reached on December 9, followed by the horizontal channel’s upper boundary at $32.50.

XAG/USD: Daily Chart

Silver FAQs

Silver is a precious metal highly traded among investors. It has been historically used as a store of value and a medium of exchange. Although less popular than Gold, traders may turn to Silver to diversify their investment portfolio, for its intrinsic value or as a potential hedge during high-inflation periods. Investors can buy physical Silver, in coins or in bars, or trade it through vehicles such as Exchange Traded Funds, which track its price on international markets.

Silver prices can move due to a wide range of factors. Geopolitical instability or fears of a deep recession can make Silver price escalate due to its safe-haven status, although to a lesser extent than Gold’s. As a yieldless asset, Silver tends to rise with lower interest rates. Its moves also depend on how the US Dollar (USD) behaves as the asset is priced in dollars (XAG/USD). A strong Dollar tends to keep the price of Silver at bay, whereas a weaker Dollar is likely to propel prices up. Other factors such as investment demand, mining supply – Silver is much more abundant than Gold – and recycling rates can also affect prices.

Silver is widely used in industry, particularly in sectors such as electronics or solar energy, as it has one of the highest electric conductivity of all metals – more than Copper and Gold. A surge in demand can increase prices, while a decline tends to lower them. Dynamics in the US, Chinese and Indian economies can also contribute to price swings: for the US and particularly China, their big industrial sectors use Silver in various processes; in India, consumers’ demand for the precious metal for jewellery also plays a key role in setting prices.

Silver prices tend to follow Gold’s moves. When Gold prices rise, Silver typically follows suit, as their status as safe-haven assets is similar. The Gold/Silver ratio, which shows the number of ounces of Silver needed to equal the value of one ounce of Gold, may help to determine the relative valuation between both metals. Some investors may consider a high ratio as an indicator that Silver is undervalued, or Gold is overvalued. On the contrary, a low ratio might suggest that Gold is undervalued relative to Silver.


Source link

18 12, 2024

BTC, ETH and XRP show signs of short-term correction

By |2024-12-18T07:20:12+02:00December 18, 2024|Crypto News, News|0 Comments

  • Bitcoin price edges slightly down on Wednesday after hitting a new all-time high of $108,353 the previous day.
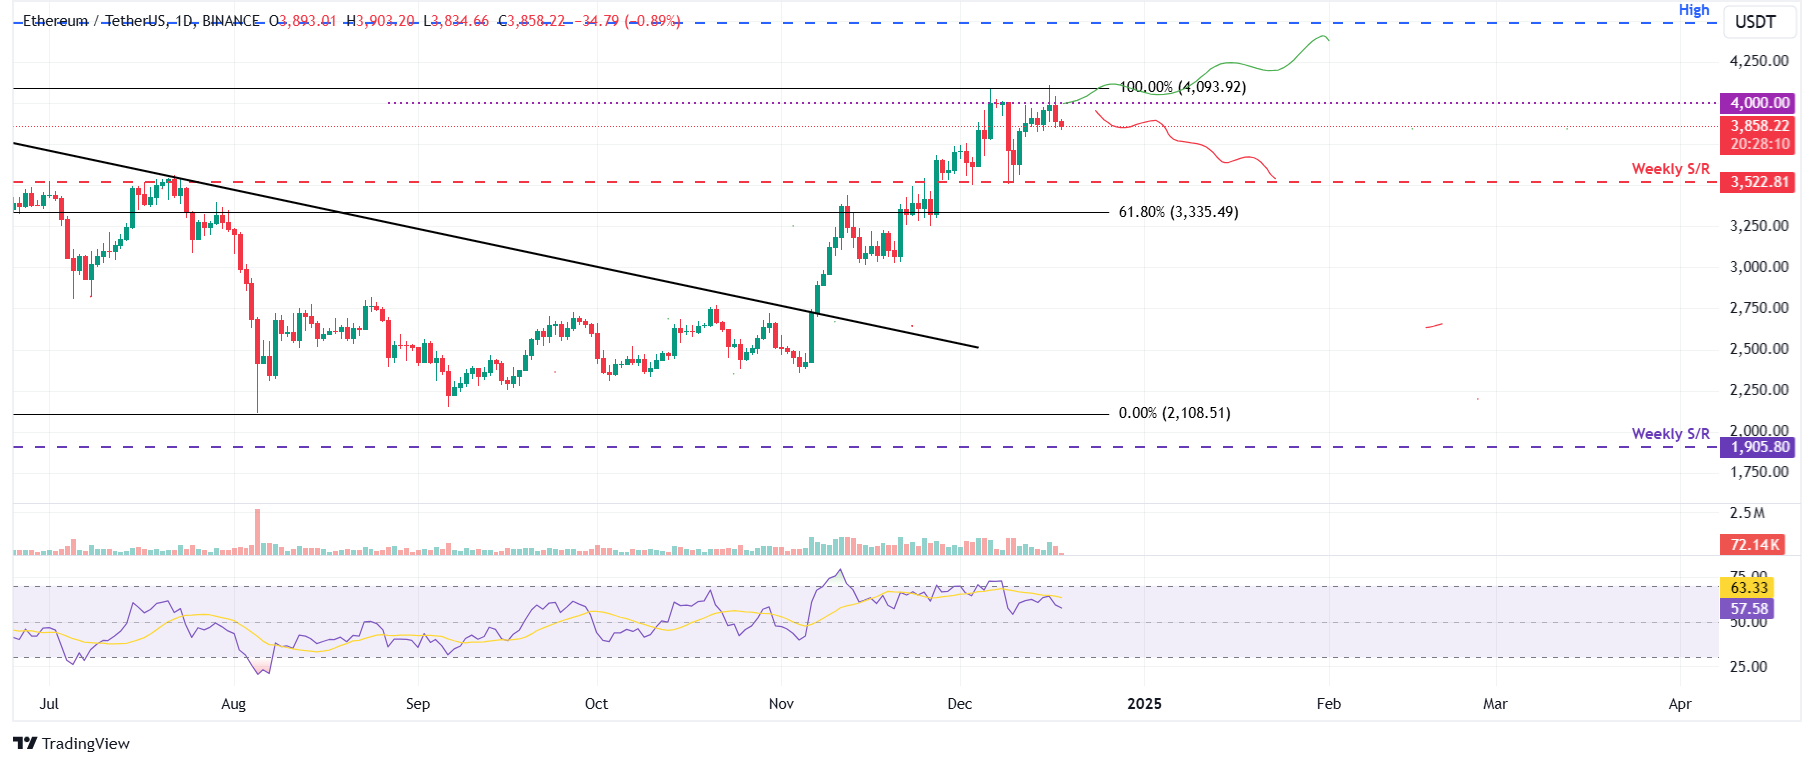
  • Ethereum price faces rejection from the $4,000 level, hinting at a correction in the short term.
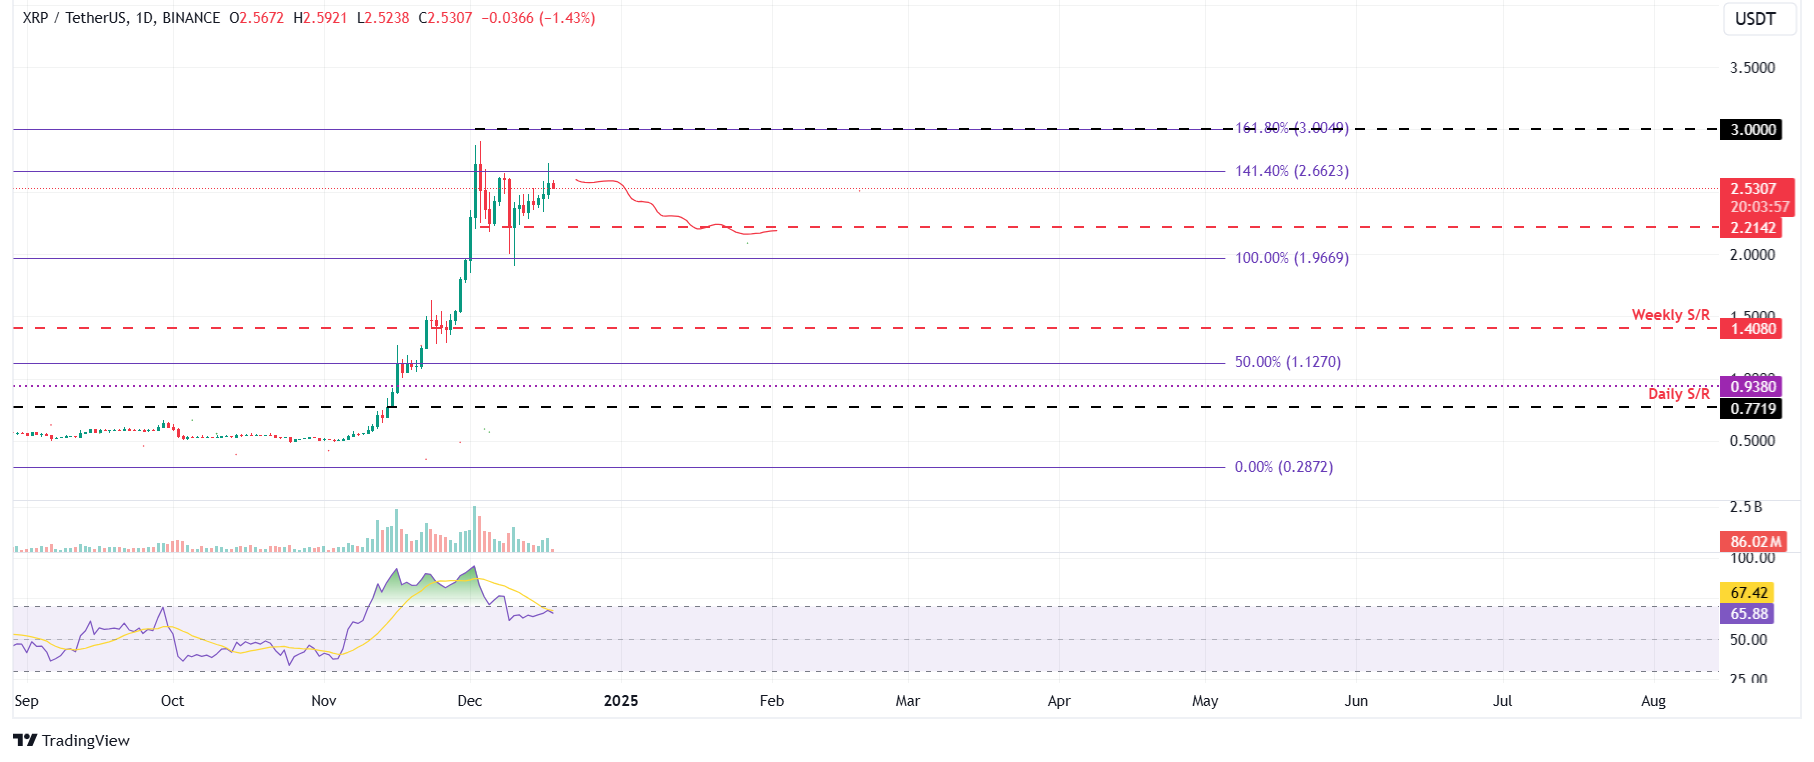
  • Ripple price trades slightly down after retesting its $2.66 level, suggesting a pullback on the cards.

Bitcoin (BTC) price edges slightly down during the Asian session on Wednesday. Ethereum (ETH) and Ripple (XRP) followed BTC’s footsteps and declined slightly; all coins’ technical indicators and price action suggest a possible short-term correction on the cards.

Bitcoin bulls show signs of exhaustion

Bitcoin price reached a new all-time high of $108,353 on Tuesday after rallying 3.32% in the previous week. At the time of writing on Wednesday, it trades slightly down around $105,019.

If BTC faces a correction and closes below the $101,109 support level, it would extend the decline to retest its next support level at $90,000.

The Relative Strength Index (RSI) on the daily chart reads 66 after rejecting the overbought level of 70 on Tuesday and points downwards, indicating a decrease in bullish momentum. If the RSI continues to edge down and close below its neutral level of 50, the price of Bitcoin will fall sharply.

BTC/USDT daily chart

However, if Bitcoin continues its upward trend and closes above its ATH of $108,353, it would extend the rally to test a new ATH of $119,510. This level aligns with the 141.4% Fibonacci extension drawn from the November 4 low of $66,835 to the December 5 high of $104,088.

Ethereum price is set for a downturn as it faces rejection around $4,000

Ethereum price faced rejection around the $4,000 level on Monday and declined 2.34% the next day. At the time of writing on Wednesday, it continues to trade down around $3,858.

If the $4,000 level continues as resistance, ETH will extend the pullback to retest its weekly support at $3,522.

The RSI on the daily chart reads 57, pointing downwards towards its neutral level of 50, indicating early signs of bearish momentum. If the RSI closes below 50 on a daily basis, Ethereum’s price would fall sharply.

ETH/USDT daily chart

ETH/USDT daily chart

If ETH breaks and closes above the $4,000 level, it could extend the rally by 12% to retest its December 9, 2021, high of $4,488.

Ripple shows signs of indecisiveness

Ripple price found support around the $1.96 level on December 10, rallied 16% until Tuesday, and faced slight rejection around the $2.66 level. At the time of writing on Wednesday, it trades slightly down around $2.53.

If the $2.66 level continues as resistance, XRP could extend the decline to retest its next support level at $2.21.

The RSI on the daily chart reads 65 after rejecting the overbought level of 70, suggesting indecisiveness among the traders.

XRP/USDT daily chart

XRP/USDT daily chart

If XRP continues to rise and closes above $2.66, it could extend the rally to retest the psychologically important level of $3.00.

Bitcoin, altcoins, stablecoins FAQs

Bitcoin is the largest cryptocurrency by market capitalization, a virtual currency designed to serve as money. This form of payment cannot be controlled by any one person, group, or entity, which eliminates the need for third-party participation during financial transactions.

Altcoins are any cryptocurrency apart from Bitcoin, but some also regard Ethereum as a non-altcoin because it is from these two cryptocurrencies that forking happens. If this is true, then Litecoin is the first altcoin, forked from the Bitcoin protocol and, therefore, an “improved” version of it.

Stablecoins are cryptocurrencies designed to have a stable price, with their value backed by a reserve of the asset it represents. To achieve this, the value of any one stablecoin is pegged to a commodity or financial instrument, such as the US Dollar (USD), with its supply regulated by an algorithm or demand. The main goal of stablecoins is to provide an on/off-ramp for investors willing to trade and invest in cryptocurrencies. Stablecoins also allow investors to store value since cryptocurrencies, in general, are subject to volatility.

Bitcoin dominance is the ratio of Bitcoin’s market capitalization to the total market capitalization of all cryptocurrencies combined. It provides a clear picture of Bitcoin’s interest among investors. A high BTC dominance typically happens before and during a bull run, in which investors resort to investing in relatively stable and high market capitalization cryptocurrency like Bitcoin. A drop in BTC dominance usually means that investors are moving their capital and/or profits to altcoins in a quest for higher returns, which usually triggers an explosion of altcoin rallies.


Source link

18 12, 2024

XAU/USD extends range play around $2,650 as Fed verdict looms

By |2024-12-18T06:43:44+02:00December 18, 2024|Forex News, News|0 Comments


  • Gold price recovers from weekly lows, struggling near $2,650 ahead of the Fed policy verdict.        
  • The US Dollar stays defensive as Treasury bond yields pause amid market caution.  
  • The daily technical setup suggests that Gold price remains exposed to downside risks.

Despite the latest uptick, Gold price remains in a familiar range near $2,650 early Wednesday. Gold price appears to lack bullish commitment in the lead-up to the US Federal Reserve (Fed) showdown.

Gold price looks to Fed decision and Powell’s presser

Gold price has failed to sustain the upside attempts so far this week, giving into the bearish pressures on Tuesday to hit the lowest level in six days at $2,633. The unabated buying interest in US Treasury bond yields mainly sponsored the downturn in Gold price. Markets continued to believe that the Fed could pause its easing cycle early next year, especially after robust US Retail Sales data.

US Retail Sales increased 0.7% in November, outpacing expectations of a 0.5% growth in the reported period. However, the US Treasury bond yields quickly pulled back due to worsening risk sentiment on global markets. Traders turned cautious and refrained from placing bets on risk assets ahead of the critical Fed interest rate decision. This helped Gold price to limit losses and regain $2,640 at the close.

Markets remain risk-averse early Wednesday, with traders non-committal on their US Dollar positions, leaving Gold price gyrating in a narrow band. The next direction in Gold price now remains at the mercy of the language in the Fed’s policy statements, its economic projections and Chairman Jerome Powell’s press conference.

If the Summary of Economic Projections (SEP), the so-called ‘Dot-plot’ chart, points to fewer rate cuts next year than previously forecast, the US Dollar will likely see a fresh leg higher at the expense of the non-interest-bearing Gold price. Powell’s comments will also be closely scrutinised for the timing of the next rate cut if he expresses caution about inflation under Donald Trump’s presidency.

Risks appears skewed to the downside in Gold price, justified by the hawkish Fed expectations and the daily technical setup.

Gold price technical analysis: Daily chart

The daily chart shows that Gold price surrendered the 21-day Simple Moving Average (SMA) at $2,655 once again.

The 14-day Relative Strength Index (RSI) is trading flat but below the 50 level, suggesting that sellers could retain control going forward.

The immediate resistance aligns at the 21-day SMA at $2,655. However, Gold buyers need to find acceptance above the 50-day SMA at $2,672 to initiate a meaningful upside toward the $2,700 level.

Further up,  Gold price could revisit the multi-week high of $2,726.

On the downside, the weekly low of $2,633 could offer some support, below which the December 6 low of $2,613 will be tested.

Gold sellers will then target the $2,600 area, where the 100-day SMA coincides with the November 26 low.

Gold FAQs

Gold has played a key role in human’s history as it has been widely used as a store of value and medium of exchange. Currently, apart from its shine and usage for jewelry, the precious metal is widely seen as a safe-haven asset, meaning that it is considered a good investment during turbulent times. Gold is also widely seen as a hedge against inflation and against depreciating currencies as it doesn’t rely on any specific issuer or government.

Central banks are the biggest Gold holders. In their aim to support their currencies in turbulent times, central banks tend to diversify their reserves and buy Gold to improve the perceived strength of the economy and the currency. High Gold reserves can be a source of trust for a country’s solvency. Central banks added 1,136 tonnes of Gold worth around $70 billion to their reserves in 2022, according to data from the World Gold Council. This is the highest yearly purchase since records began. Central banks from emerging economies such as China, India and Turkey are quickly increasing their Gold reserves.

Gold has an inverse correlation with the US Dollar and US Treasuries, which are both major reserve and safe-haven assets. When the Dollar depreciates, Gold tends to rise, enabling investors and central banks to diversify their assets in turbulent times. Gold is also inversely correlated with risk assets. A rally in the stock market tends to weaken Gold price, while sell-offs in riskier markets tend to favor the precious metal.

The price can move due to a wide range of factors. Geopolitical instability or fears of a deep recession can quickly make Gold price escalate due to its safe-haven status. As a yield-less asset, Gold tends to rise with lower interest rates, while higher cost of money usually weighs down on the yellow metal. Still, most moves depend on how the US Dollar (USD) behaves as the asset is priced in dollars (XAU/USD). A strong Dollar tends to keep the price of Gold controlled, whereas a weaker Dollar is likely to push Gold prices up.


Source link

18 12, 2024

Dogecoin Price Prediction: Market Expert Says DOGE Will Rebound To New $1.2 ATH, Setting This AI Rival For 36,700% Jump To $4

By |2024-12-18T05:18:51+02:00December 18, 2024|Crypto News, News|0 Comments

A market expert has shared his sentiments on the Dogecoin price in a recent price overview. The seasoned expert insists that the Dogecoin price will rebound to $1.2, a new all-time high (ATH), in the coming days. This price surge will impact the AI rival, WallitIQ (WLTQ), pushing its price from $0.0243 to an astounding $4.

Dogecoin Price To Hit New ATH Soon

A seasoned market expert predicts the Dogecoin price will soon surge from its current value of $0.4047 to a new ATH of $1.2. This report comes as the bulls are trying to push the price back into the channel. If the bulls successfully push the Dogecoin price, it could rebound and rise to $0.84 and, after that, to a new ATH of $1.2.

Data on CoinGecko shows that the Dogecoin price declined by 6.9% in the last 7 days. However, in the last 24 hours, the price slightly increased by 3.8%. If the bulls can sustain the upward trend, the expert’s prediction could come to reality sooner than expected. This development is a positive for the Dogecoin community, as the Dogecoin price has been hugely characterized by spikes and dips.

Expert Claims Forthcoming Dogecoin Price Surge Will Push AI Rival WallitIQ (WLTQ) To $4

WallitIQ (WLTQ) is tipped to benefit enormously from the forthcoming Dogecoin price surge. In his analysis, a market expert claims that the Dogecoin price reaching a new ATH will push AI rival WallitIQ (WLTQ) from $0.0243 to $4. This would reflect a massive 36,700% surge in its value. Also, WallitIQ (WLTQ) token holders will gain 36,700% returns, a higher return than the returns the Dogecoin price surge will yield.

Selling for just $0.0243 per token in its ongoing presale, investors who have yet to hold the AI rival WallitIQ (WLTQ) can buy it for this low price now. Purchasing the token in its early stages is imperative as only early investors will maximize the forthcoming thrilling 36,700% returns. Besides, when the current presale price sells out, the WallitIQ (WLTQ) token price will surge by up to 72.2%.

As a decentralized AI crypto wallet, WallitIQ (WLTQ) offers investors a safe and innovative infrastructure to deal with over 1,000 cryptocurrencies. It prioritizes asset security, efficiency, and user experience. Maximizing AI technology, the AI rival boasts several groundbreaking tools aimed at granting crypto investors an overall worthwhile experience. 

The WallitIQ (WLTQ) wallet is developed with a robust intelligent security system that includes anomaly detection, biometric authentication, and behavioral analysis. These cutting-edge security features help create a safe environment for WallitIQ (WLTQ) investors, making unauthorized access almost impossible. 

SolidProof, a giant auditing firm, has audited WallitIQ’s (WLTQ) smart contracts during a meticulous security assessment, and no vulnerabilities or bugs were detected. This has further strengthened WallitIQ’s (WLTQ) reliability, earning it a listing on CoinMarketCap. 

Additionally, WallitIQ (WLTQ) incorporates a groundbreaking Scan & Pay QR tool to end the stressful manual transaction process. With a QR code scan, investors can initiate and complete transactions within seconds. This also eliminates the risk of manually inputting incorrect wallet addresses, making the AI rival WallitIQ (WLTQ) a safer and more efficient choice.

Final Thoughts 

A market expert has claimed that the Dogecoin price is on its way to a new ATH of 1.2% and the AI rival, WallitIQ (WLTQ), to $4. This prediction has generated excitement, especially in the WallitIQ (WLTQ) community, as a surge to $4 indicates an ROI of 36,700% for investors. 

This has resulted in FOMO, with the demand for the WallitIQ (WLTQ) token tripling. Do not worry; investors who have yet to buy the WallitIQ (WLTQ) token still have the opportunity to do so at a cheap price of $0.0243. Notably, only token holders will partake of the 36,700% profit.

Take advantage of this timely information and buy the WallitIQ (WLTQ) token now!

Source link

18 12, 2024

Crude Oil Price Forecast: Pullback Sets Stage for Potential Upside Continuation

By |2024-12-18T04:42:48+02:00December 18, 2024|Forex News, News|0 Comments


Finds Support at 20-Day Line

Notice that today’s pullback to the 20-Day line was the first test of a previous resistance area since last week’s bullish breakout. The 20-Day line was reclaimed on the same day the consolidation breakout triggered. Since a new lower swing high has been generated as of today, that high at 69.98 can be watched as a potential pivot.

A little further up is a more significant upswing high at 71.79. If crude can get above and stay above that price level, higher prices become more likely. Previous resistance shows around the 70.19 to 73.27 highs, which corresponds to the 50% retracement at 72.97.

Consolidation Breakout Could Trigger Momentum Spike

However, since a breakout of consolidation triggered there is the potential for a more aggressive move higher given the compression of the price range over recent months. In that case the 61.8% Fibonacci retracement is at 74.42 followed the 78.6% retracement at 76.47.

Also, notice that the lower boundary line of a large symmetrical triangle pattern cuts through the area between the two price levels. It also represents potential resistance. It will be interesting to see how crude oil relates to the line given that it represents the triangle.

Downward Pressure Remains

Overall, crude remains in a downtrend. The more significant swing low of the price structure of the trend is at the swing high of 73.27 from early-October. If that price level is exceeded, then a bullish long-term reversal is indicated and an upside breakout through the triangle would have also been triggered. Regardless of current technical indications, patterns evolve or fail if they don’t follow through on the initial distinction.


Source link

18 12, 2024

Pound US Dollar (GBP/USD) Exchange Rate Climbs

By |2024-12-18T03:22:01+02:00December 18, 2024|Forex News, News|0 Comments

December 17, 2024 – Written by Tim Boyer

The Pound to Dollar exchange rate (GBP/USD) gained momentum on Monday following the release of UK’s and US’s preliminary PMI data for December.

On Monday, the Pound (GBP) edged higher against most of its major trading partners after the release of the UK’s preliminary PMI data for December.

The report showed that the UK’s manufacturing index continued to decline, falling from 48.0 to 47.3, which was below the expected increase to 48.2.

However, the UK’s vital services index exceeded market expectations, rising from 50.8 to 51.4, surpassing the modest forecast of 51.0.

This forecast-beating performance in the services sector provided a substantial boost to GBP exchange rates following the data release.

On Monday, the US Dollar (USD) experienced volatility following the release of the country’s preliminary S&P Global PMIs.

Much like the Pound, the US manufacturing index declined slightly, dropping from 49.7 to 48.3, which was below the anticipated rise to 49.8.

Advertisement


On a more positive note, the services index surpassed expectations, climbing from 56.1 to 58.5 instead of falling to 55.7. This marked the highest level in the services sector since October 2021.

Despite this strong economic performance, USD did not gain momentum following the release. Instead, it weakened against the Pound and remained relatively stable against other currencies.

GBP/USD Forecast: UK and US Data to Drive Movement

Looking ahead to Tuesday, the main driver of movement for the Pound US Dollar exchange rate will likely be the release of some high-impact economic data from both the UK and the US.

First up, the UK’s unemployment rate is expected to remain steady at 4.3%, while average earnings (excluding bonuses) are forecast to increase from 4.8% to 5%.

These economic indicators could significantly affect GBP exchange rates, particularly if there is any increased uncertainty regarding the UK’s labour market.

On the US side, the latest retail sales index will be released, and if the data meets expectations and rises from 0.4% to 0.5%, it could provide a boost to USD exchange rates.

Like this piece? Please share with your friends and colleagues:


International Money Transfer? Ask our resident FX expert a money transfer question or try John’s new, free, no-obligation personal service! ,where he helps every step of the way,
ensuring you get the best exchange rates on your currency requirements.

TAGS: Pound Dollar Forecasts

Source link

Go to Top