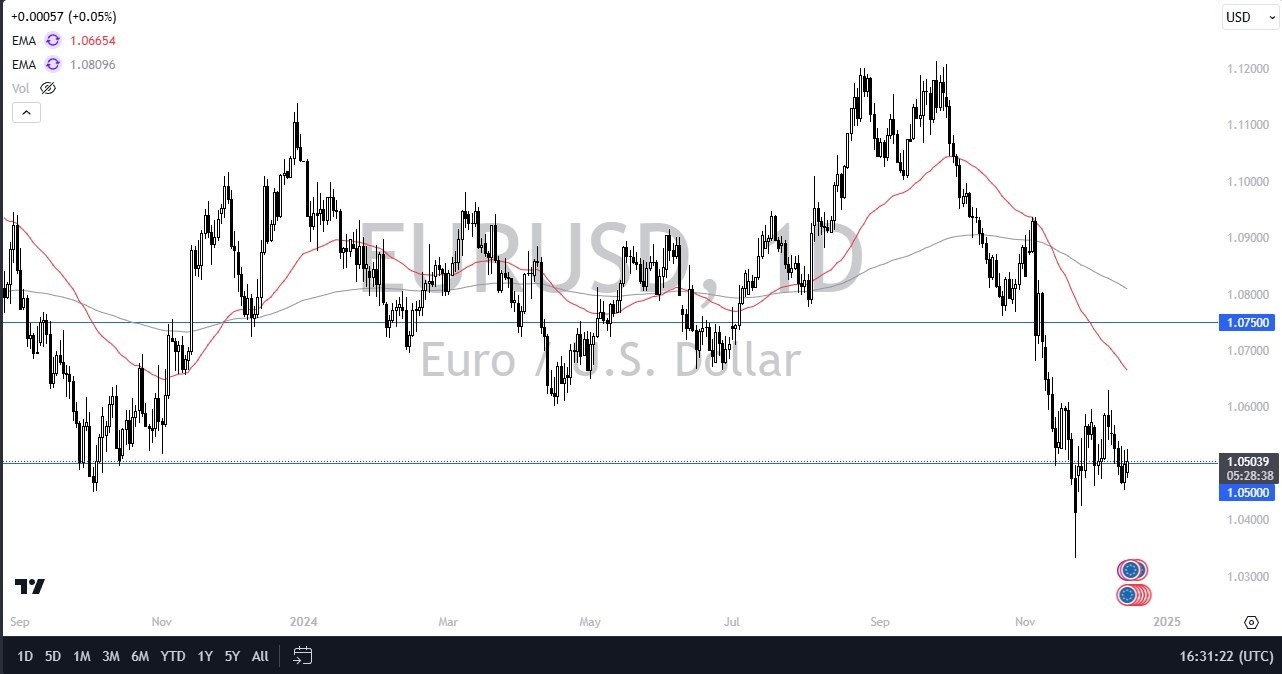
The daily analysis of the Euro at this point remains negative overall, and in the EUR/USD pair, I see this market as hanging around the 1.05 level, so this is a market that is going to continue to pay close attention to the area as a magnet for price in general.
This market has been bouncing around in the same area for a minute, and I think we are simply waiting for the Federal Reserve on Thursday.
The Federal Reserve meeting is expected to present a 25 basis point cut, but the real action will be the press conference and the statement, and what they make traders think the Fed will do going forward. The January meeting is expected to be a “wait and see approach”, so this is going to keep the US dollar strong against many other currencies, but the Euro will be especially weak, as the French had their debt downgraded yet again over the weekend.
Technical Analysis
The technical analysis the EUR/USD currency pair is of course negative from a longer-term standpoint, but recently has been a somewhat neutral situation. The market seems to have a lot of resistance near the 1.06 level, and as a result, I am a seller of signs of exhaustion after rallies, especially near that level. If the market were to fall from here, the 1.04 level should be a support level. Anything below there could bring in another 50 pip drop. Anything below there would be a wipeout. The Thursday meeting reaction will be crucial to tell us where we are going in the future, but between now and then I suspect we see more or less a sideways market.
This market continues to be a sideways one, and I think we have a situation where short-term traders are going to be attracted to this situation, as it has been somewhat predictable for traders to participate in a rangebound environment.
CryptoInsightUK, a crypto market educator, presents his XRP price prediction by Christmas, suggesting a bullish uptick.
The market analyst revealed this in a recent disclosure after seeking community opinions on XRP price outlook. CryptoInsightUK set up a poll on X, asking community members to vote on what they believe XRP price could be this Christmas, Dec. 25.
For context, XRP currently changes hands at $2.51, having increased 0.64% this morning. The altcoin is currently building on a gradual bullish momentum that began on Dec. 15, up 4.21% since then as it battles to transcend the $2.4 psychological mark.
Community Opinions
Amid this battle, CryptoInsightUK asked community members to choose if XRP price will collapse below $2 by Christmas day, trade between $2 and $3.30, or change hands at a range of $3.30 and $5. The market analyst also highlighted an option of a price above $5 by Dec. 25.
Interestingly, of the 2,033 respondents, most of them, about 36%, revealed that they believe XRP is likely to trade within a range of $2 and $3.30 by Christmas day. Further, 30% of the participants expect XRP to trade between $3.30 and $5. Meanwhile, 26% see the altcoin changing hands above $5.
It bears mentioning that these options are all bullish, suggesting XRP could either hold above the $2 price mark by Christmas day or trade above it. Essentially, 92% of the respondents are bullish on XRP. However, only 8% believe the altcoin could slip below $2 by Christmas day.
Analyst Predicts XRP Price by Christmas
Following the poll, CryptoInsightUK disclosed his own target for XRP, predicting that the asset could rally to a new ATH of $5 between now and the new year. However, he expects XRP to transcend this level as the new year progresses, projecting an upward surge to a double-digit price from January to March 2025.
CryptoInsightUK then sought the opinion of fellow market analyst BobbyA, who is also bullish on XRP’s price outlook. BobbyA noted that he believes XRP price could trade between $4.5 and $5.25 by Christmas day.
However, he suggested that XRP could face a major selloff after this top but failed to provide insights on the possible support level. Nonetheless, BobbyA sees a rebound to a range of $8 to $13, and then a run toward the $20s after another exhaustive wick.
It bears mentioning that, in a previous analysis, CryptoInsightUK predicted a possible XRP price surge to $8 by Christmas day. As a result, the recent $5 target has triggered questions from investors. The analyst confirmed that the $8 target remains valid but noted that the $5 price is his base case outlook for XRP.
Other market observers have also projected an XRP price rally to $5. For instance, Vincent Van Code expects XRP to reach this level, but believes this target would only materialize in February 2025, not this year.
Currently, XRP trades for $2.51, up 4.75% over the last 24 hours. The asset would need to soar 99% to claim the $5 price. It bears mentioning that last Christmas, on Dec. 25, 2023, XRP changed hands at the $0.60 level.
DisClamier: This content is informational and should not be considered financial advice. The views expressed in this article may include the author’s personal opinions and do not reflect The Crypto Basic opinion. Readers are encouraged to do thorough research before making any investment decisions. The Crypto Basic is not responsible for any financial losses.
Silver price extends its losing streak as short-term price momentum weakens.
The alignment of the nine- and 14-day EMAs suggests a lack of strong directional momentum.
The initial support appears at a psychological $30.00 level, followed by a “throwback support” at its three-month low of $29.65.
Silver price (XAG/USD) continues its losing streak for the fourth successive day, trading around $30.50 per troy ounce during the Asian hours on Tuesday. Analysis of the daily chart indicates a momentum shift to bearish from bullish bias as the pair has broken below the ascending channel pattern.
The XAG/USD pair moves below both of these EMAs, indicating a bearish outlook and signaling to weakening short-term price momentum. This points to increasing selling interest and raises the likelihood of further price depreciation. Additionally, the 14-day Relative Strength Index (RSI) is positioned below the 50 mark, further confirming the emergence of the bearish bias.
However, the alignment of the nine- and 14-day Exponential Moving Averages (EMAs) suggests that the market is experiencing a period of consolidation, lacking a strong directional momentum. Traders may interpret this as a signal that the market is waiting for a catalyst to determine its next move, whether upward or downward.
The XAG/USD pair may test its primary support at the psychological level of $30.00, followed by a “throwback support” level at its three-month low of $29.65, which was recorded on November 28.
On the upside, the immediate barriers appear at the nine- and 14-day EMAs at $30.91 and $30.96, respectively. A break above these levels could cause the bullish bias to re-emerge and help the Silver price to retest its six-week high of $32.28, reached on December 9.
XAG/USD: Daily Chart
Silver FAQs
Silver is a precious metal highly traded among investors. It has been historically used as a store of value and a medium of exchange. Although less popular than Gold, traders may turn to Silver to diversify their investment portfolio, for its intrinsic value or as a potential hedge during high-inflation periods. Investors can buy physical Silver, in coins or in bars, or trade it through vehicles such as Exchange Traded Funds, which track its price on international markets.
Silver prices can move due to a wide range of factors. Geopolitical instability or fears of a deep recession can make Silver price escalate due to its safe-haven status, although to a lesser extent than Gold’s. As a yieldless asset, Silver tends to rise with lower interest rates. Its moves also depend on how the US Dollar (USD) behaves as the asset is priced in dollars (XAG/USD). A strong Dollar tends to keep the price of Silver at bay, whereas a weaker Dollar is likely to propel prices up. Other factors such as investment demand, mining supply – Silver is much more abundant than Gold – and recycling rates can also affect prices.
Silver is widely used in industry, particularly in sectors such as electronics or solar energy, as it has one of the highest electric conductivity of all metals – more than Copper and Gold. A surge in demand can increase prices, while a decline tends to lower them. Dynamics in the US, Chinese and Indian economies can also contribute to price swings: for the US and particularly China, their big industrial sectors use Silver in various processes; in India, consumers’ demand for the precious metal for jewellery also plays a key role in setting prices.
Silver prices tend to follow Gold’s moves. When Gold prices rise, Silver typically follows suit, as their status as safe-haven assets is similar. The Gold/Silver ratio, which shows the number of ounces of Silver needed to equal the value of one ounce of Gold, may help to determine the relative valuation between both metals. Some investors may consider a high ratio as an indicator that Silver is undervalued, or Gold is overvalued. On the contrary, a low ratio might suggest that Gold is undervalued relative to Silver.
There has been extensive debate in India on whether the drug authority should take over the regulatory control of nutraceuticals since February this year.
The debate was sparked by the government’s formation of a five-member panel in examining the possibility of shifting nutraceutical regulatory control from the Food Safety and Standards Authority of India (FSSAI) to the Central Drugs Standard Control Organisation (CDSCO).
One of the concerns that the industry had, was their worries of how the arrangement could stifle the development of the nutraceutical sector.
Australia’s Therapeutic Goods Administration (TGA) released a safety advisory in February warning the risk of gastrointestinal symptoms linked to ashwagandha (Withania somnifera) supplements bought online from overseas.
Sixteen cases were hospitalisation as a result of severe gastrointestinal side effects. There were also 12 reports of liver problems related to ashwagandha supplements consumption.
Ashwagandha is widely used as a Ayurvedic medicine and can be bought in Australia’s supermarkets, health food shops and pharmacies without a prescription or health professional’s advice.
Thailand has enforced new maximum levels for the Recommended Daily Intakes (RDIs) of nine vitamins and minerals from July 2 this year.
The RDI of vitamin C, for example, has been raised from 60mg to 1,000mg, while that of vitamin D was increased from 5 µg to 15 µg.
Meanwhile, food supplements produced prior to the date of enforcement can still be sold in the market – but no more than three years from the date of notification, which is on July 1, 2027.
The Food and Drug Administration (FDA) of Philippines said in January that it would be reclassifying vitamins and minerals either as food or dietary supplement, instead of the existing arrangement where it is categorised as either food or drug.
Known as the “Guidelines for the Classification of Vitamins and Minerals for Food/Dietary Supplements under Processed Food Product”, the new framework will replace the existing “Guidelines for the Classification of Vitamins and Minerals as Drug or as Food” set in 1991.
The new guidelines would also set maximum levels for a total of 26 vitamins and minerals. For example, the daily maximum level for vitamin C would be set at 1,000mg, vitamin D at 25mcg, and calcium at 1,200mg.
From China, Taiwan, South Korea, Australia, to Japan, we summed up the need-to-know nutraceutical related regulations that were put in place across Asia-Pacific this year.
Taiwan, for instance, has required health foods, including fish oil and red yeast rice products to comply with new labelling rules since January 1st this year.
Australia, on the other hand, has implemented new warning statements to ingredients that are deemed as having “low-negligible risk changes”, such as green tea extract and curcumin.
There were robust discussions between India’s food and drug regulators, as well as the industry, on whether vitamins and minerals with dosage levels higher than one recommended dietary allowance (RDA) and upper limits should be regulated by the drug regulator instead.
At the moment, vitamins and minerals higher than one RDA or upper limit will be considered as pharmaceuticals, except for Foods for Special Medical Purpose and Foods for Special Dietary Use (FSDU) – which are both regulated by the food authority.
The discussions were sparked by the formation of a five-member panel by the government to examine the possibility of shifting nutraceutical regulatory control from the Food Safety and Standards Authority of India (FSSAI) to the Central Drugs Standard Control Organisation (CDSCO).
China had approved nearly 600 infant formulas based on the new GuoBiao (GB) or national standards last year, following the implementation of new regulations.
China’s State Administration of Market Regulation (SAMR) implemented new regulatory requirements for infant formulas last February.
It said in June this year that a total of 592 infant formulas and 97 companies were approved when the country fully transited to the new regulations last year.
The introduction of a new ‘modern claims’ system in Malaysia has been welcomed by industry players as it could drive more clinical research, expand new product options for consumers, and open local and international market opportunities.
Companies can apply for modern claims on natural products since April 4 this year.
A modern claim is one that is made “based on scientific evidence which is limited to supporting and enhancing health, risk reduction or aiding / assisting in the management of a disease / condition or symptoms that are expected to naturally resolve within a timely manner (self-limiting),” according to the National Pharmaceutical Regulatory Agency (NPRA).
The Hong Kong Consumer Council has urged the government to set up legislations to regulate dietary supplements, including probiotics.
The Council made the announcement when releasing the findings of its review of 40 commercially available probiotics products back in January.
The review found that out of the 40 products assessed, two contained Enterococcus faecalis. This isa strain which the Council said was not recommended by the Joint FAO / WHO Working Group for use as a probiotic, due to safety concerns.
Manufacturers of Foods with Function Claims (FFC) in Japan are legally bound to four new requirements since September 1st.
The move came as the authorities sought to tighten regulations on FFC after Kobayashi Pharmaceutical’s red yeast rice scandal broke out in March.
One of the new requirements is that manufacturers are required to report cases of health hazards related to their products to Japan’s Consumer Affairs Agency (CAA).
The Months of November and December have been a good one for crypto assets.
November witnessed one of the biggest surges in the crypto market in a while following Donald Trump’s election win.
Bitcoin surpassed its all-time high hitting 103,679 USDT.
Altcoins like Solana, XRP, and Tron also reacted to the Bull run.
XRP flipped Tether to become the third-largest crypto asset by market capitalization. Tron surpassed a 7-year all-time high and Solana surged from 205 USDT on Nov 13 to a new all-time high of 263 USDT on Nov 23.
The November Bull run has cooled off a bit on the side of most of the Altcoins especially Solana which is down 6.8% in the last 7 days and down 4.5% on a two-week scale.
Solana’s surge could be attributed to the versatility of its blockchain. The Solana blockchain is known to be one of the busiest blockchain in the industry. Memecoins generation, Telegram-powered Web 3 games, and other projects saturate the blockchain making it an important pillar of the industry.
Solana Price prediction: Can the token hit 1700 USDT?
At the time of this report, Solana is exchanging hands for $220 16.1% down from its all-time high.
Despite this retracement, bullish predictions for Solana have remained strong with various experts speculating on its future price trajectory.
CoinCodex Analysts predict Solana could hit as high as $505 by August next year. This target is not far-fetched given that SOL has nearly tripled in over a year.
Going by this surge range, the 5th largest crypto asset could go as high as $1405 in the coming years.
Analysts at Benzinga predict this target could take as far as 2031 to materialize.
Price Analysis
Solana is currently exchanging hands for $220 surging by 0.6% in the past 24 hours. The crypto asset is 16.1% down from its all-time high of $263.
Solana has been one of the busiest blockchains this year hosting a series of Tap to Earn crypto projects powered by Telegram.
SOL has also become the default crypto asset for memecoin trading in addition to its existing utility. These factors drive up the demand for Sol adding to its real-world use.
What to Know
Solana is the fifth-largest crypto asset in the industry by market capitalization and has been predicted in the past to one-day flip the Ethereum market cap.
It is also one of the fastest blockchains with the capacity to process thousands of transactions in seconds.
Follow us for Breaking News and Market Intelligence.
Join Our Telegram channel to stay up to date on breaking news coverage
Binance, the largest cryptocurrency exchange by trading volume, is set to list Pudgy Penguins’ native token $PENGU today, December 17, 2024. The Pudgy Penguins NFT team announced plans to launch their native token “PENGU’ earlier last week. In this article, we shall exclusively explore all that you need to know starting from $PENGU’s official launching time, airdrop, and tokenomics.
By description, $PENGU is the official token of the Pudgy Penguins, the globally acknowledged non-fungible token collection, which features a limited edition of 8,888 unique cartoons of cute penguins. The Pudgy Penguins NFT collection was launched in July 2021 exclusively on the Ethereum blockchain and has grown into one of the biggest NFT projects in the NFT market.
The Pudgy Penguins team announced their native token on December 06, 2024. In a blog post on X (formerly Twitter), the Pudgy Penguins stated that the native token would offer millions of its fans the chance to align with the brand’s vision. The introduction of the PENGU token is part of Pudgy Penguins’ broader strategy to grow its ecosystem. PENGU is set to launch today Dec 17, at 14:00 UTC on the Solana blockchain network.
Though the $PENGU token will first launch on the Solana blockchain network, it will eventually expand to Ethereum and Abstract, the consumer-focused Ethereum layer-2 scaling network being built by Igloo Inc. Unveiled in June 2024, Igloo is the parent company for the Pudgy Penguins. By launching PENGU on the Solana blockchain network, the Pudgy Penguins NFT team aims to reach an entirely new audience.
$PENGU Tokenomics
Based on the Pudgy Penguins tokenomics table, the $PENGU token will feature a limited supply of 88 billion. The Pudgy Penguin team has allocated 25.9% of the Pengu tokens for the Pudgy Penguins community, which is likely to include Pudgy Penguins and Lil Pudgy holders, and potentially holders of other pudgy digital assets like Pengu Pins (commemoration soulbound tokens) and Pudgy Rods.
PENGU will have a total supply of 88,888,888,888 and will launch on Solana.
The Pudgy Penguins team has allocated It has also allocated 24.12% of the total supply to other communities to expand the size of the Pudgy Penguins community, bringing an estimated five million new huddle members on board. It has also reserved 12.35% of the total supply to create liquidity pairs on decentralized exchanges and grow a thriving market for PENGU after launch.
Furthermore, the Pudgy Penguins team has also reserved 17.8% of the total supply to the project team and subject, at a 1-year cliff and 3 years vesting. It has also reserved 11.48% of the total supply for the company, which will be used for development and marketing ventures. Lastly, the team has reserved 0.35% to the FTX exchange token holders and 4% of the token supply to the public good, in line with the Pudgy Penguins’ motto of “Spreading good vibes across the meta.”
Related NFT News:
Newest Meme Coin ICO – Wall Street Pepe
Audited By Coinsult
Early Access Presale Round
Private Trading Alpha For $WEPE Army
Staking Pool – High Dynamic APY
Join Our Telegram channel to stay up to date on breaking news coverage
Gold price clings to the previous rebound above $2,650 ahead of US Retail Sales data.
The US Dollar stays defensive with Treasury bond yields despite hopes of a hawkish Fed in 2025.
Gold price looks for a fresh impetus amid neutral daily RSI while below 50-day SMA at $2,671.
Gold price holds the previous rebound above $2,650 early Tuesday as buyers remain in control amid sustained weakness in the US Dollar (USD) and sluggish US Treasury bond yields. The focus now remains on the US Retail Sales data as the US Federal Reserve (Fed) begins its two-day monetary policy meeting later on Tuesday.
Gold price awaits US data ahead of Wednesday’s Fed event risk
Traders continue to adjust their USD positions, closing in on the Fed policy announcements, with US Treasury bond yields witnessing a choppy action, unperturbed by the mixed US S&P Global preliminary Manufacturing and Services PMI data released on Tuesday. Data showed that the US manufacturing sector contraction deepened to 48.3 in December, missing the forecast of 49.4. Meanwhile, the US Services PMI jumped to 58.5 in the same period from November’s 56.1. The market consensus was 55.7.
The CME Group’s FedWatch Tool shows that markets continue to fully price in the probability that the Fed will lower the interest rate by 25 basis points on Wednesday. This continues to underpin the sentiment around the non-yielding Gold price alongside looming geopolitical risks.
However, growing expectations that the Fed could opt for fewer rate cuts in 2025 and likely pause its easing cycle in January act as a headwind to the Gold price turnaround. Markets eagerly await the Fed’s quarterly economic projections and Chairman Jerome Powell’s comments to gauge the US central bank’s path forward on interest rates next year, which could significantly impact the Gold price.
On the geopolitical front, the US imposed new sanctions on North Korea and Russia on Monday, targeting Pyongyang’s financial activities and military support to Moscow. The political instability in South Korea and Israel-Gaza tensions also support the Gold price.
In the lead-up to the Fed event risks, Gold traders look forward to US November Retail Sales for some fresh trading incentives. The consumer spending data, however, is unlikely to alter the market’s expectations of the Fed’s move this week.
Gold price technical analysis: Daily chart
As observed on the daily chart, Gold price extends its struggles with the 21-day Simple Moving Average (SMA) support at $2,655 after having closed above it on Monday.
The 14-day Relative Strength Index (RSI) is trading flat at around the 50 level, suggesting a lack of clear directional bias.
Gold buyers must scale the 50-day SMA at $2,671 to offer extra legs to the recent rebound. The next upside target is at the $2,700 level.
Further up, Gold price could revisit the multi-week high of $2,726.
Conversely, a daily candlestick close below the 21-day SMA at $2,655 could initiate a fresh downtrend toward the December 6 low of $2,613.
The line in the sand for Gold buyers is seen at the $2,600 area, where the 100-day SMA coincides with the November 26 low.
Economic Indicator
Retail Sales (MoM)
The Retail Sales data, released by the US Census Bureau on a monthly basis, measures the value in total receipts of retail and food stores in the United States. Monthly percent changes reflect the rate of changes in such sales. A stratified random sampling method is used to select approximately 4,800 retail and food services firms whose sales are then weighted and benchmarked to represent the complete universe of over three million retail and food services firms across the country. The data is adjusted for seasonal variations as well as holiday and trading-day differences, but not for price changes. Retail Sales data is widely followed as an indicator of consumer spending, which is a major driver of the US economy. Generally, a high reading is seen as bullish for the US Dollar (USD), while a low reading is seen as bearish.
While the European Central Bank and Swiss National Bank both cut interest rates last week, UK’s sticky services inflation is likely to prevent the Bank of England from following its European counterparts. However, the pound could still fall because of the potential that we could see a more aggressive easing stance by spring of 2025. The GBP/USD will find additional pressure in the event the US dollar extends its rally. Investors are eagerly anticipating what could be the final hurrah for volatility in 2024, with the Federal Reserve, Bank of Japan, as well as the BoE, all poised to reveal their rate decisions and provide outlook for the upcoming year. The GBP/USD forecast remains bearish.
UK PMI data underscores challenges facing the BoE
The UK’s Composite PMI was unchanged in December, although the UK private sector employment showed the fastest decline for nearly four years. The services PMI climbed to a two-month high of 51.4 from 50.4, beating estimates, while the manufacturing PMI hit an 11-month low of 47.3 compared to 48.0 in November. A similar story was also evident for the Eurozone, where the services PMI expanded at a faster pace than expected while the manufacturing once again declined more than forecast.
In the UK, new orders decreased for the first time in 13 months amid widespread reports of weaker business and consumer spending patterns, according the report by S&P Global. This is in part because of the still-strong inflationary pressures in the UK compared to other economic regions – the precise reason why the BoE may well decide cutting rates this week.
The report noted that “Rising salary payments and elevated domestic inflationary pressures continued to push up cost burdens across the private sector in December… the rate of input price inflation accelerated for the second month running to its strongest since April. Manufacturers recorded the steepest rise in purchasing prices since January 2023.”
The latest PMI data comes after Friday’s soft UK growth data, which caused the GBP/USD to slide towards 1.26 handle as the EUR/GBP jumped back up from near 0.82 to above 0.83 and in the process turned positive on the week. The recovery in the EUR/GBP helped to push the EUR/USD back up to $1.05 ahead of this week’s central bank bonanza.
US dollar support ahead of potential hawkish FOMC cut
Last week’s US CPI data brought no unexpected surprises, though the hotter-than-expected PPI did raise a few eyebrows. Even so, traders seem confident in their expectations of a rate cut at the Federal Reserve’s final meeting of the year on Wednesday. With a 25-basis-point reduction now almost fully priced in, the Fed has little room to diverge without causing notable market disruption. The real question is whether the Fed will pause rate cuts in early 2025 or stick to the current pace of 25-basis-point reductions at upcoming meetings.
Jerome Powell’s comments last month – noting that risks to the labour market had diminished while inflation remained more persistent than anticipated – have fuelled speculation of a hawkish cut. As a result, Powell’s remarks at the post-meeting press conference and the Fed’s updated economic and rate projections will be pivotal in shaping market sentiment.
For my part, I expect the Fed to deliver a hawkish cut. President-elect Trump’s policy plans – featuring immigration controls, tariffs, and both personal and corporate tax cuts – are likely to push the Fed towards signalling a more cautious and measured path of easing through 2025. This should keep the dollar well-supported, leaving the GBP/USD outlook forecast bearish.
Looking ahead to the week: BoE and Fed could influence GBP/USD forecast meaningfully
In the week ahead, we will hear from the US Federal Reserve (Wednesday), Bank of England and Bank of Japan (both on Thursday) among others. Of particular importance for the GBP/USD forecast, traders will want to pay close attention to the rate statement and comments from the heads of the BoE and FOMC.
Ahead of Thursday’s Bank of England rate decision, we will have already heard from the Fed and BoJ, both expected to have trimmed rates. Last week, the ECB delivered an expected 25 basis point cut while the SNB surprised with 50.
As mentioned, the BoE is not expected to cut rates even after Friday’s release of poor UK GDP and other macro data. But could we see a surprise cut anyway? That is the key risk that is not priced in. Influencing the BoE’s decision, we will still have UK wages and CPI data on Tuesday and Wednesday, respectively.
For now, key short-term resistance lies around the 1.2715/20 level after we broke decisively below this point last week. This may well have opened the door for a drop below the 1.2600 zone. Beneath that, the psychologically significant 1.25 level comes into focus, which previously acted as support after a brief dip to November’s low of 1.2487.
As before, the next big resistance above the 1.2715/20 area to watch is in the 1.2800–1.2870 range. This area has served as both support and resistance in the past and coincides with the 200-day moving average, making it a critical level to monitor the cable were to make a recovery in the week ahead.
Every year, on World Tea Day, which occurs on December 15th, tea lovers around the world unite to celebrate this humble, yet extraordinary, beverage. Now, if you ask someone from Pakistan about tea, their eyes will light up like they’ve just been asked about their first love. Because in this corner of the world, tea isn’t just a drink – it’s a cultural obsession. And I promise you won’t find a Pakistani who doesn’t have a ‘chai story’.
It all starts with the comforting chaiwala bustling on every corner of the city, brewing up that sweet, milky tea that Pakistanis swear by. It’s not just about the taste – oh no, it’s about the ritual, the feeling of anticipation as the tea is poured into your glass with that satisfying shlupp sound, steam rising in delicate swirls.
In Pakistan, tea is the ultimate multitasker. It’s there for the morning chai to kick-start the day. It’s there for midday chai to act as the official break time signal. It’s there for the evening chai when the workday ends, and, of course, it’s there for the night-time chai, because let’s be real – no visit to a relative’s house is complete without one. You enter, and within moments – sometimes even before a proper greeting – you’ll be offered chai and find yourself sipping a steaming cup, being told, “Thora aur piyen,” (Have some more). There’s no escaping it. Even at 10 PM, if you’re at a relative’s house, they’ll serve you tea like a ritual. The best part? The tea is never served solo. It’s always accompanied by delectable samosas, pakoras, or mithai – all of which are equally important to the experience.
But let’s talk about the tea itself. Now, the process of making tea in Pakistan is an art form. It’s not just about boiling water and adding tea leaves – oh no, that’s amateur hour. It’s a carefully curated ritual. You begin with the chai patti, a blend of rich tea leaves. Add some milk, because, let’s be honest, if it’s not a shade of beige, it’s not tea. Then comes the all-important sugar (you don’t want to risk any grumpy faces here). The tea must be brewed just long enough to get that deep, satisfying colour but not too long that you offend your mother with the burnt taste.
And let’s not forget the chai debates: Is doodh patti better than kali patti? What about elaichi chai? No one ever reaches a conclusion, and that’s okay – because with tea, you don’t need to agree, you just need to sip and smile. On this On World Tea Day, let’s raise our cups and toast to the timeless charm of tea.
The global sip: Teas and their health benefits
Tea is one of the most consumed beverages worldwide, but did you know it comes in all shapes, colours, and benefits? From boosting energy to calming your nerves, tea does it all. So grab your favourite mug as we dive into the wonderful world of teas…
Green Tea – The glow getter
Green tea is the wellness queen of the tea world. It’s packed with antioxidants called catechins, which have been shown to boost metabolism and help in weight management. But that’s not all. It also promotes healthy skin, fights inflammation, and gives your immune system a nice little upgrade. And for those who need a pick-me-up, green tea has just the right amount of caffeine to keep you feeling energised without the jittery feeling of a coffee overdose.
Black Tea – The classic
If you’re looking for bold flavour and a stronger caffeine kick, black tea is your go-to. Not only does it get you through those sluggish mornings, but it also improves heart health and lowers cholesterol levels. The tannins in black tea are packed with benefits that help with digestion, and it’s perfect for those mid-afternoon slumps. Plus, black tea blends wonderfully with spices, making it a key ingredient in masala chai – a true fan favourite.
Herbal Teas – Calming comfort
Herbal teas like chamomile, peppermint, and ginger have been trusted for centuries for their calming and medicinal properties. Chamomile is perfect for winding down before bed, helping with insomnia and stress relief. Peppermint tea is a go-to for those who want to ease stomach discomfort or freshen their breath naturally. And let’s not forget ginger tea, which is known for its ability to boost immunity, fight inflammation, and soothe a sore throat.
White Tea – Light and luxurious
If you’re the type who enjoys the lighter side of life, white tea is where it’s at. With its delicate flavour and high levels of antioxidants, this tea helps with skin hydration and anti-aging. It also packs a punch when it comes to promoting healthy digestion and detoxifying the body. Its subtlety makes it a perfect tea for moments when you need a calm, refreshing break from the chaos of life.
Oolong Tea – Best of both worlds
Not too strong, not too weak, oolong tea is a perfect balance between black and green tea. It’s known for aiding weight loss, boosting brain function, and improving fat metabolism. Whether you’re sipping it for the health benefits or just enjoying its rich, floral notes, oolong tea is a lovely middle ground in the world of teas.
Bitcoin price reaches a new all-time high of $106,648 on Monday but retreats afterward.
The US Federal Reserve is widely expected to cut interest rates on Wednesday, but the outlook for 2025 is uncertain.
US Bitcoin Spot ETFs recorded a total inflow of $2.17 billion last week, in a sign of continued strong demand.
Technical indicators show signs of early bearish divergence in RSI and AO, suggesting weakness in bullish momentum.
Bitcoin (BTC) price retreats on Monday after reaching a new all-time high (ATH) of $106,648 in the early Asian session. The main factor impacting BTC price this week is likely to be the decision of the US Federal Reserve (Fed) on interest rates on Wednesday. The US central bank is expected to slash rates (a positive for risk assets such as BTC) but also signal fewer-than-previously-anticipated cuts for 2025.
The recent rally to a new ATH has been supported by continued strong inflows to the US Bitcoin Spot Exchange Traded Funds (EFTs) of $2.17 billion last week. Still, traders should remain cautious as technical indicators such as the Relative Strength Index (RSI) and Awesome Oscillator (AO) show early bearish divergence, suggesting that bullish momentum is weakening.
Bitcoin reaches all-time high of $106,600 ahead of Fed decision
Bitcoin price reached a new all-time high of $106,648 at the start of this week on Monday after rallying 3.2% the previous week. A further rise in Bitcoin price could be fueled by the upcoming decision of the Fed on interest rates on Wednesday.
According to the CME’s Fed watch tool, which tracks the probabilities of changes to the Fed rate as implied by Fed Funds future prices, there is a 97.1% likelihood of a 25 basis point cut, while the remaining 2.9% points for the rate to remain stable.
An interest-rate cut tends to favor risky assets like Bitcoin because lower rates tend to stimulate the economy. However, markets’ reaction to Wednesday’s Fed decision isn’t likely to be driven by the rate decision itself (unless there was a huge surprise) but rather the Fed projections about how interest rates will head in 2025.
If these projections reflect slower or fewer rate cuts next year, Treasury yields and the US Dollar will likely be stronger, making it harder for risk assets, including BTC, to be more attractive to investors.
ETFs provide continued support
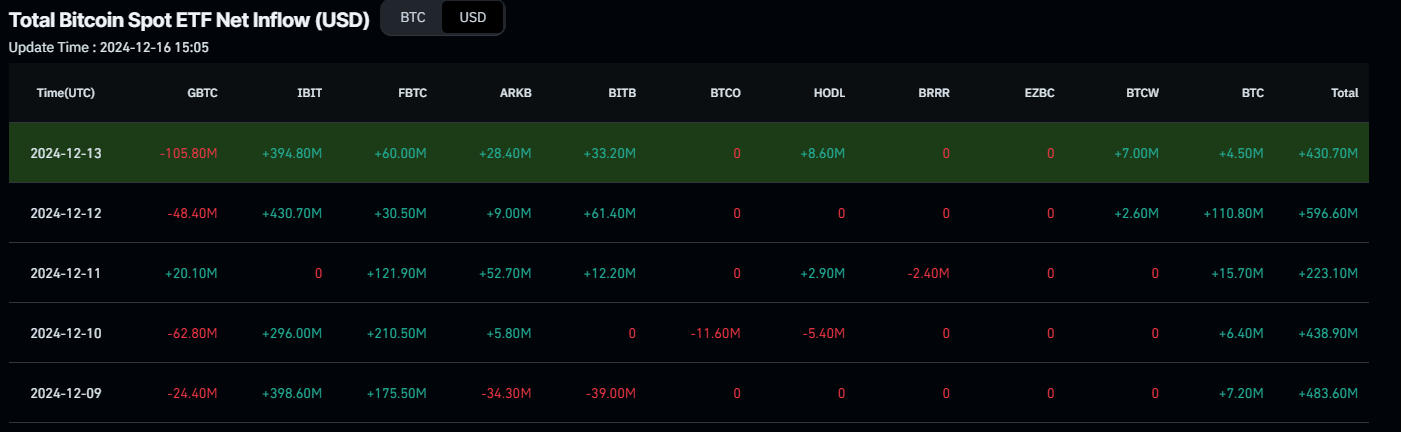
Looking into Bitcoin’s institutional flows, these remained strong last week. According to Coinglass, Bitcoin Spot ETF data recorded a total net inflow of $2.17 billion last week. Bitcoin could rally further in the coming days if this inflow trend persists or accelerates.
Total Bitcoin Spot ETF Net Inflow chart. Source: Coinglass
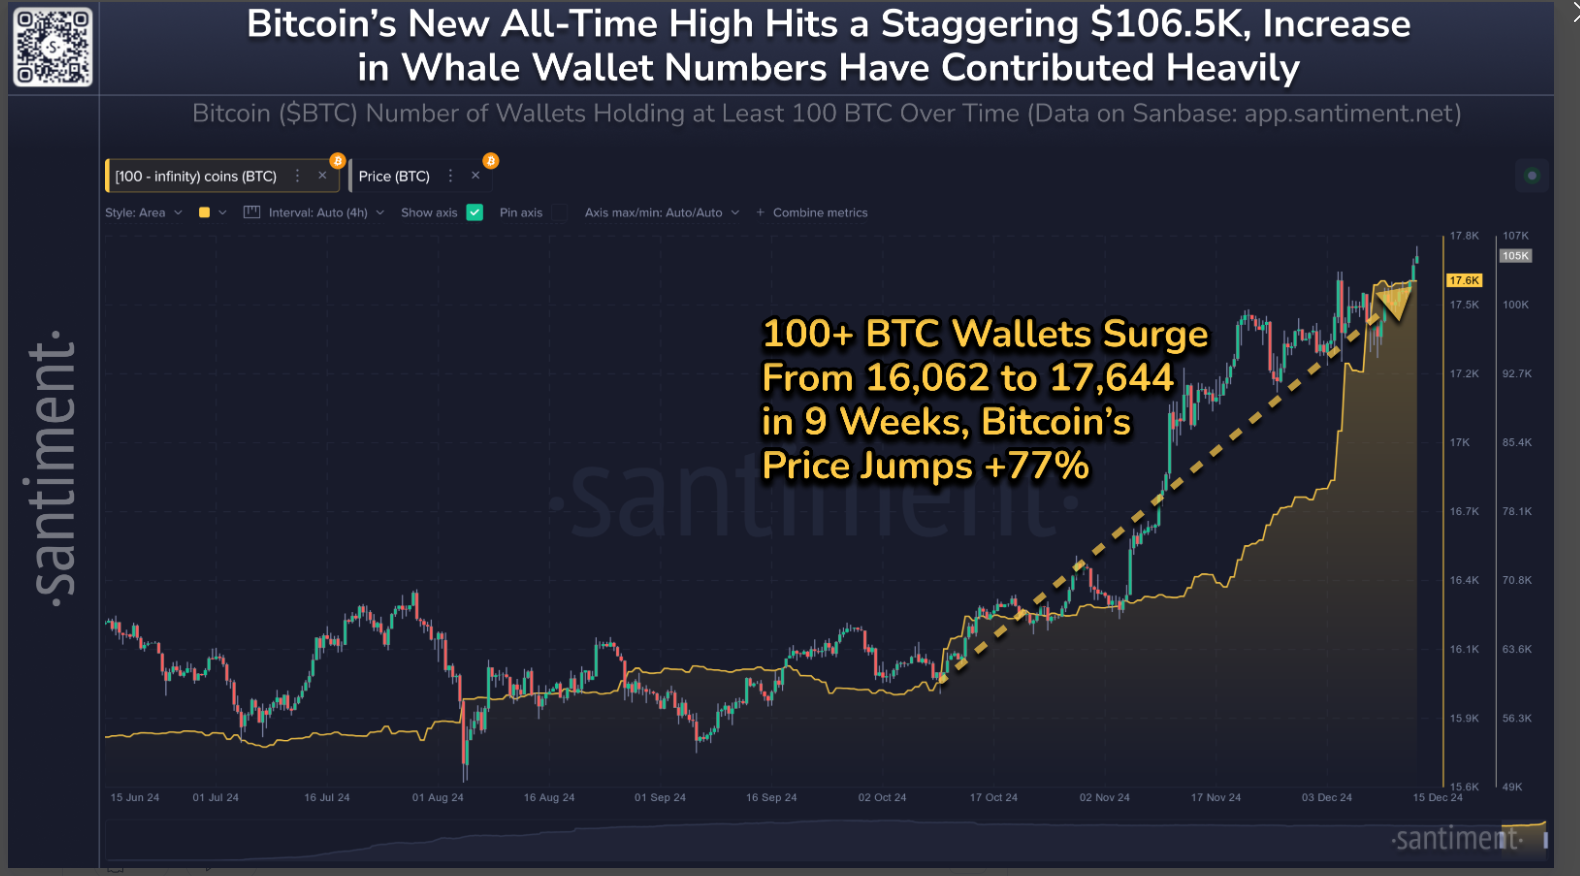
According to Santiment’s data, since the start of the bull rally on October 10, the wallets holding at least 100 BTC have increased almost 10% from 16,062 to 17,644 in 9 weeks. This rise in BTC wallets shows investors’ confidence and contributed heavily to its current rise.
Wallets holding at least 100 BTC chart. Source: Santiment
In an exclusive interview, Darius Sit, Founder & Chief Investment Officer of QCP Singapore’s digital assets firm, told FXStreet that he has never been more bullish on Bitcoin. Darius explained that his bullish outlook was mainly because of the liquidity rush into Bitcoin.
“This year, crypto or bitcoin is being brought into traditional markets, infrastructure, and traditional market liquidity,” Darius said to FxStreet.
“I think now it’s starting to impact debt financing; equity financing is starting to impact how everything from individuals to corporates to countries think about their future and how they think about, you know, raising money, how they think about their treasuries,” Darius explain
Darius said the signs the traders should watch for are “One possibly volatile possible downside from deleveraging but at the same time increasing influence and increasing impact that it’s having with real institutions, quasi-sovereigns and sovereigns having it on their balance sheet.”
Despite Bitcoin reaching new highs, traders should be cautious as CryptoQuant data shows that the Estimated Leverage Ratio (ELR) reached annual highs, indicating a chance of a correction is likely due to leverage overheating.
Bitcoin Estimated Leverage Ratio chart. Source: Santiment
Bitcoin Price Forecast: Rise towards $119K or pullback to $90K?
Bitcoin price reaches a new all-time high (ATH) of $106,648 in the early Asian trading session but retraces to around $103,600 during the Europen session on Monday.
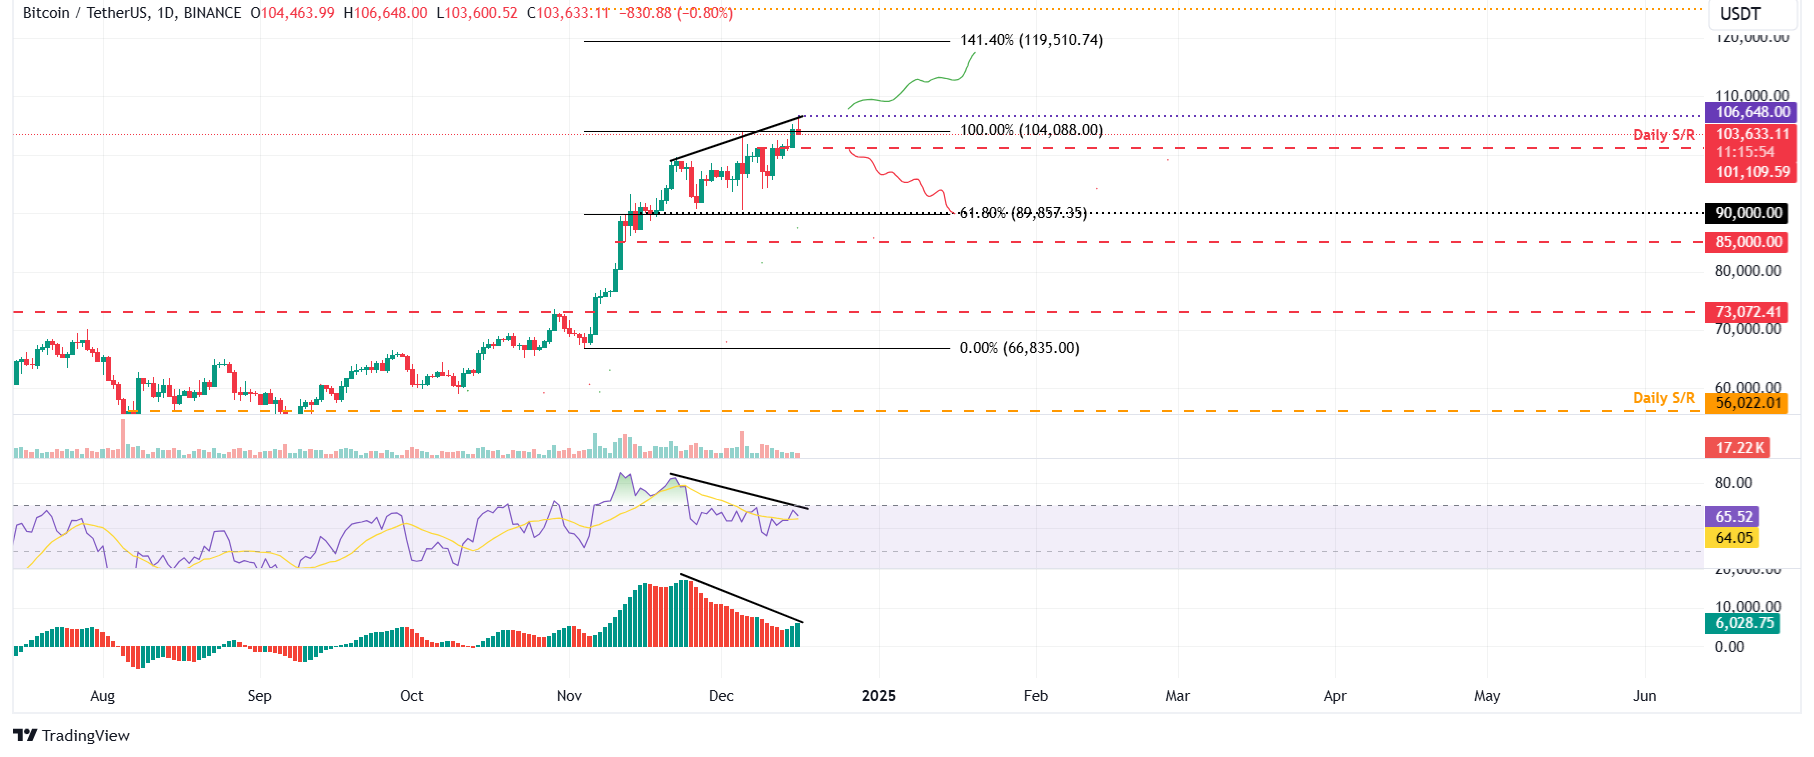
Despite reaching new highs, traders should remain cautious as the chances of a pullback are likely high, as shown by the momentum indicators. The Relative Strength Index (RSI) and the Awesome Oscillator (AO) indicators on the daily chart show signs of an early bearish divergence, where the higher high in the prices are not reflected in higher highs in RSI and AO, indicating signs of weakness in bullish momentum.
If BTC faces a pullback and closes below $100,000, it could extend the decline to retest its $90,000 support level.
BTC/USDT daily chart
However, if BTC continues its upward momentum, it could extend the rally to test a new ATH of $119,510. This level aligns with the 141.4% Fibonacci extension line drawn from the November 4 low of $66,835 to the December 5 high of $104,088.
Bitcoin, altcoins, stablecoins FAQs
Bitcoin is the largest cryptocurrency by market capitalization, a virtual currency designed to serve as money. This form of payment cannot be controlled by any one person, group, or entity, which eliminates the need for third-party participation during financial transactions.
Altcoins are any cryptocurrency apart from Bitcoin, but some also regard Ethereum as a non-altcoin because it is from these two cryptocurrencies that forking happens. If this is true, then Litecoin is the first altcoin, forked from the Bitcoin protocol and, therefore, an “improved” version of it.
Stablecoins are cryptocurrencies designed to have a stable price, with their value backed by a reserve of the asset it represents. To achieve this, the value of any one stablecoin is pegged to a commodity or financial instrument, such as the US Dollar (USD), with its supply regulated by an algorithm or demand. The main goal of stablecoins is to provide an on/off-ramp for investors willing to trade and invest in cryptocurrencies. Stablecoins also allow investors to store value since cryptocurrencies, in general, are subject to volatility.
Bitcoin dominance is the ratio of Bitcoin’s market capitalization to the total market capitalization of all cryptocurrencies combined. It provides a clear picture of Bitcoin’s interest among investors. A high BTC dominance typically happens before and during a bull run, in which investors resort to investing in relatively stable and high market capitalization cryptocurrency like Bitcoin. A drop in BTC dominance usually means that investors are moving their capital and/or profits to altcoins in a quest for higher returns, which usually triggers an explosion of altcoin rallies.













-638699504613782039.png)