About Editorial team of BIPNs

Main team of content of bipns.com. Any type of content should be approved by us.
14 12, 2024

USD/JPY Stages Five-Day Rally for First Time Since June

By |2024-12-14T06:32:01+02:00December 14, 2024|Forex News, News|0 Comments

US Dollar Outlook: USD/JPY

USD/JPY climbs to a fresh monthly high (153.75) as it stages a five-day rally for the first time since June, but the Federal Reserve interest rate decision may sway the exchange rate as the central bank is expected to further unwind its restrictive policy.

USD/JPY Stages Five-Day Rally for First Time Since June

USD/JPY appears to be mirroring the rise in long-term US Treasury yields as it extends the advance from the start of the week, and the exchange rate may continue to retrace the decline from the November high (156.75) on the back of US Dollar strength.

Join David Song for the Weekly Fundamental Market Outlook webinar.

David provides a market overview and takes questions in real-time. Register Here


US Economic Calendar


Looking ahead, the Federal Open Market Committee (FOMC) is expected to deliver another 25bp rate-cut at its last meeting for 2024, and more of the same from the Fed may produce headwinds for the US Dollar as the central bank continues to move toward a neutral stance.

At the same time, the FOMC may adjust the forward guidance for monetary policy as Chairman Jerome Powell and Co. are slated to update the Summary of Economic Projections (SEP), and the central bank may project a more gradual path in unwinding its restrictive policy should the SEP reveal an upward revision in the Fed’s interest rate dot-plot.

With that said, a hawkish Fed rate-cut may keep USD/JPY afloat as the central bank insists that ‘monetary policy decisions were not on a preset course,’ but a further shift in the carry trade may curb the recent in the exchange rate as major central banks continue to switch gears.

USD/JPY Price Chart – Daily

USDJPY Daily Chart 12132024

Chart Prepared by David Song, Strategist; USD/JPY on TradingView

  • USD/JPY extends the advance from the start of the week to register a fresh monthly high (153.75), and a close above 153.80 (23.6% Fibonacci retracement) may push the exchange rate towards 156.50 (78.6% Fibonacci extension).
  • A breach above the November high (156.75) opens up 160.40 (1990 high), but USD/JPY may struggle to retain the advance from the monthly low (148.65) should if fail to trade back above 156.50 (78.6% Fibonacci extension).
  • A breach below 151.95 (2022 high) may push USD/JPY back towards the 148.70 (38.2% Fibonacci retracement) to 150.30 (61.8% Fibonacci extension) zone, with the next area of interest coming in around 144.60 (50% Fibonacci retracement) to 145.90 (50% Fibonacci extension).

Additional Market Outlooks

Gold Price Forecast: Bullion Remains Below Pre-US Election Prices

Canadian Dollar Forecast: USD/CAD Climbs to Fresh Yearly High

GBP/USD Outlook Hinges on Break of December Opening Range

Australian Dollar Forecast: AUD/USD Falls to Fresh Yearly Low

— Written by David Song, Senior Strategist

Follow on Twitter at @DavidJSong

Get our guide to central banks and interest rates in Q4 2024


Source link

14 12, 2024

Bullish reversal expected if $230 resistance caves

By |2024-12-14T06:29:50+02:00December 14, 2024|Crypto News, News|0 Comments

  • Solana price fell 4% in 48 hours to hit $225 on Friday, decoupling from the broader altcoin market resurgence.  
  • The $3 billion SOL market cap decline coincided with Trump-backed WLFI’s latest crypto acquisitions, drawing investor attention toward the Ethereum ecosystem. 
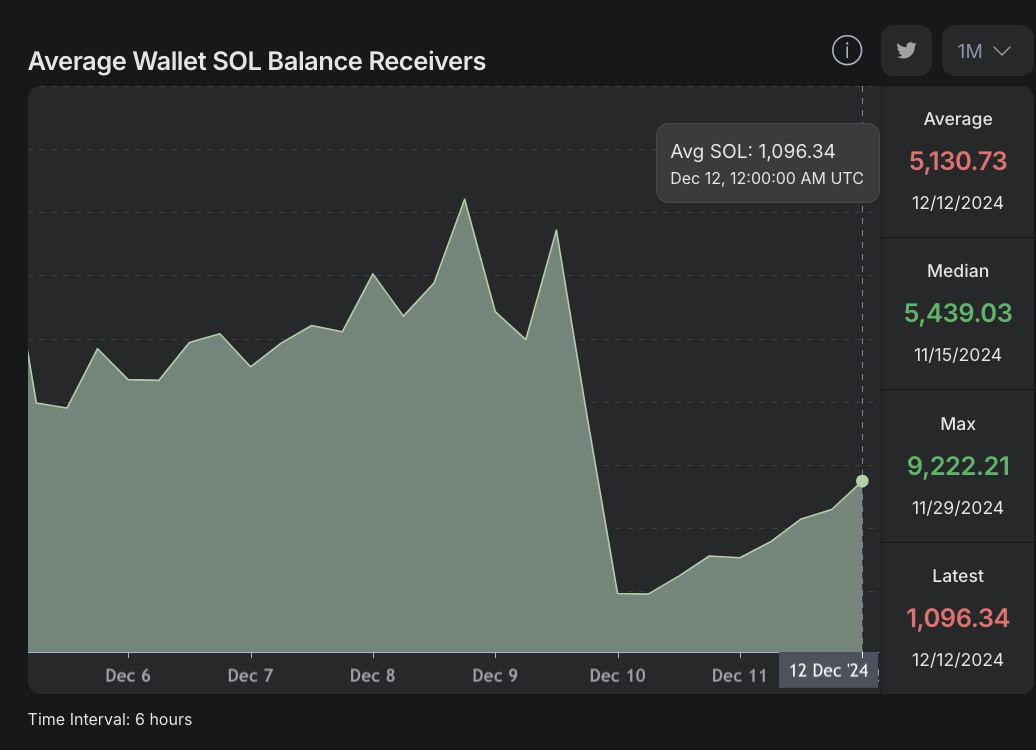
  • Average balance in buying addresses increased from 383 SOL to 1,096 SOL, signalling a 186% rise in Solana whale demand over the last three days.

Solana price fell 4% in 48 hours to hit $225 on Friday, decoupling from the broader altcoin market resurgence. While Trump-backed WLFI’s latest crypto acquisitions drew retail mass market attention toward the Ethereum ecosystem, on-chain data shows Solana whales increasingly buying the dip. 

Solana price tumbles 4% as traders shift focus to ETH, LINK, AAVE amid Trump’s latest buys 

Following a lagging start to the week, steeper inflation on the US CPI report triggered a crypto market rebound on Wednesday.

However, while the likes of Bitcoin, Ethereum and XRP rebound above key psychological support, Solana, the fourth largest crypto asset, has struggled for traction. 

Recent market reports suggest recent purchases made by World Liberty Financial (WLFI), a crypto firm backed by US President-elect Donald Trump, momentarily drew investor attention toward the Ethereum ecosystem, while Solana lost nearly $3 billion in market capitalization.  

Solana price action vs TOTAL3 (Total Altcoin Market Capitalization)

On December 11, WLFI acquired millions worth of ETH, Chainlink and AAVE, which saw all three Ethereum-hosted assets enter double-digit gains within the last 48 hours.

Meanwhile, the chart above shows that while the global altcoin market rose 10%, Solana price tumbled 4.6% on Wednesday to hit the $224 level at press time on Friday. 

This validates the stance that Trump’s indirect endorsement of the Ethereum ecosystem may have influenced the retail mass market to shift capital away from Solana, arguably its biggest rival Layer-1 chain.  

Whale demand spikes 186% amid SOL price dip

The 4.6% SOL price dip over the last 48 hours has seen it decouple from the broader altcoin market rebound.

However, vital on-chain metrics show Solana whales capitalizing on the falling prices to buy the dip, a move that could potentially trigger a bullish reversal in the days ahead. 

The Hellomoon chart below tracks the balances held in wallets that acquired SOL over the past week. This serves as a proxy for measuring real-time changes in whale trading activity. 

Average balance in Solana (SOL) buying addresses | Source: Hellomoon 

The chart above shows how the average balance in buying addresses increased from 383 SOL on Tuesday  to hit 1,096 SOL on Thursday.

This signals a 186% increase in demand from large investors over the last three days, reflecting growing anticipation of a bullish reversal.

When large holders buy during a market dip, the resulting surge in market liquidity enables panic sellers to exit with minimal downward pressure on prices.

This could help SOL hold relatively high support levels, while bulls regroup for the next rebound phase.

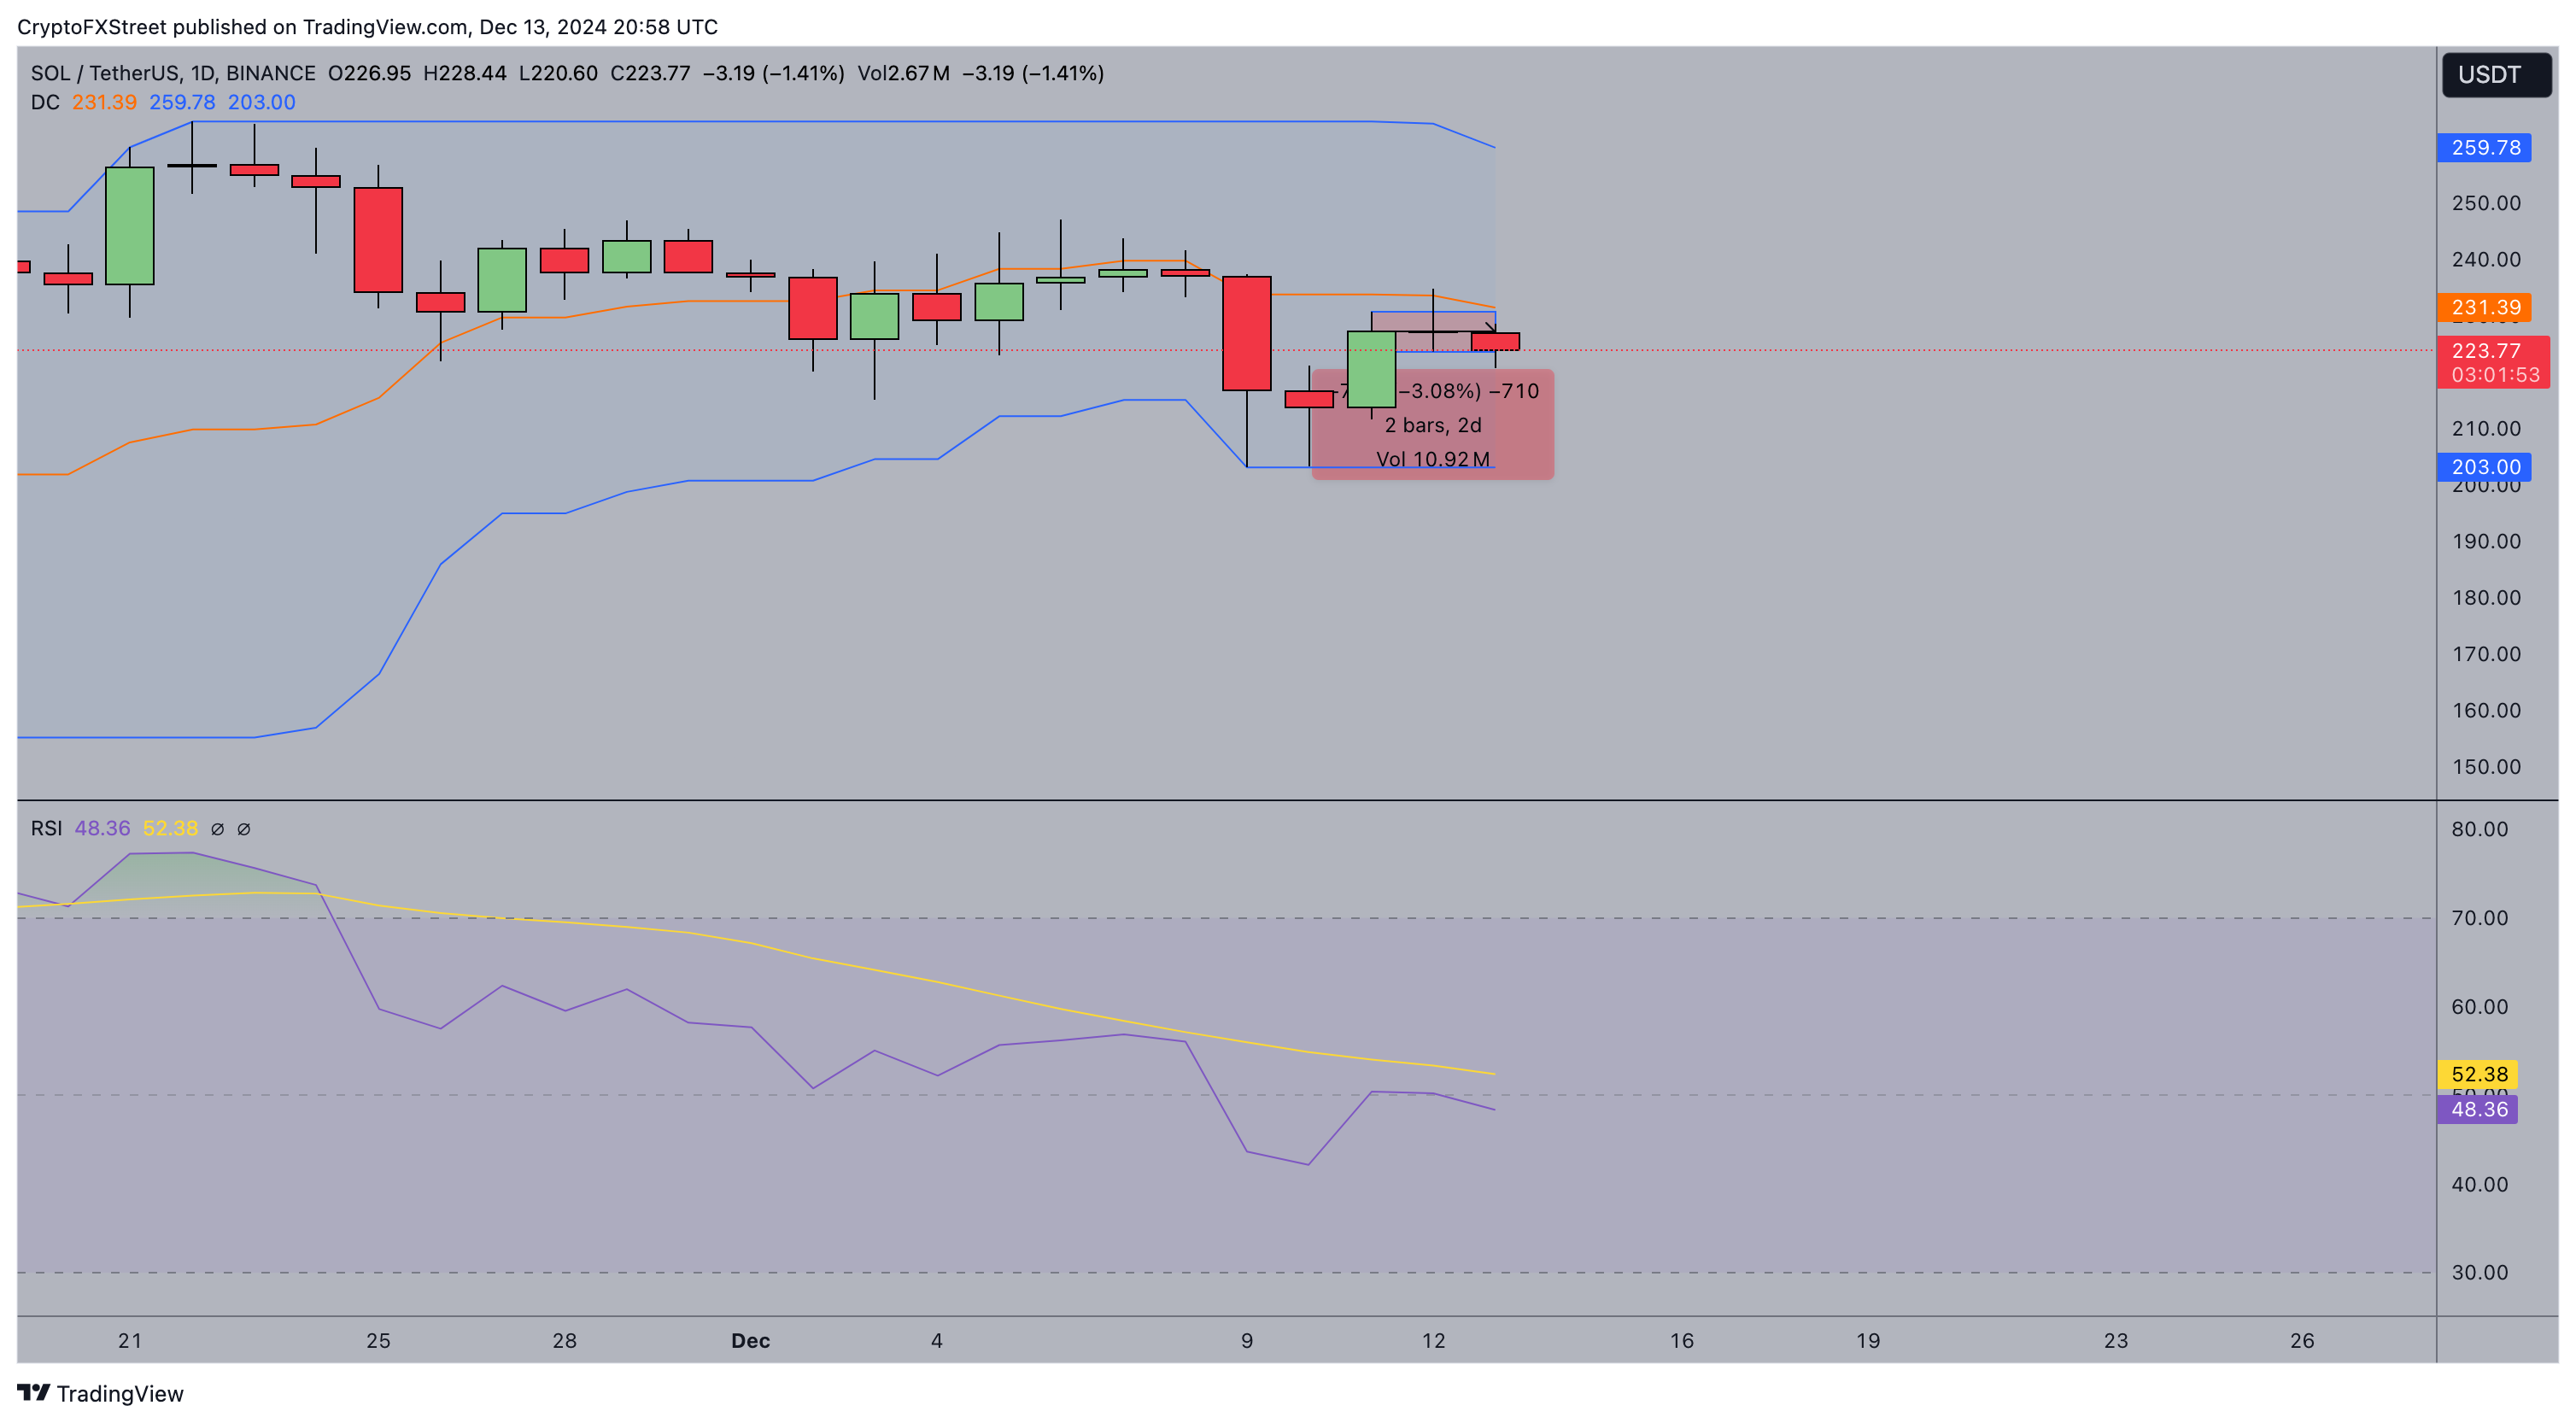
Solana price forecast: Close above $230 could spark rebound phase

Solana’s (SOL) price has shown signs of stabilizing, with technical indicators pointing to a potential rebound if key resistance levels are breached.

The RSI remains neutral at 48.36, indicating that bears are not in full control of the market. 

This suggests a possible recovery if momentum shifts in favor of bulls. The midline of the Donchian Channel (DC) at $231 acts as immediate resistance.

A decisive close above this level could signal a resurgence of buying activity, setting the stage for a broader recovery phase.

Solana Price Forecast

If SOL successfully breaks above $231, the next target lies at the upper band of the DC at $259.

This move could attract strategic traders looking for entry opportunities at current levels.

However, failure to sustain above $230 could invalidate this bullish outlook. 

On the downside, strong support is observed at $203, and a drop below this level might prompt further corrections.

Volume trends suggest caution as significant buying pressure is yet to emerge to counteract bearish momentum.

Strategic traders should monitor these levels closely for confirmation of a trend reversal.


Source link

14 12, 2024

Binance Coin (BNB) Price Prediction for November 11

By |2024-12-14T04:28:50+02:00December 14, 2024|Crypto News, News|0 Comments

U.Today – Bulls are trying to hold the initiative, and most of the coins remain in the green zone, according to CoinMarketCap.

The rate of (BNB) has increased by 0.87% over the last 24 hours.

On the hourly chart, the price of BNB has made a false breakout of the local resistance of $691.54. However, if the daily bar closes near that mark or even above it, growth may continue to the $700 zone tomorrow.

On the bigger time frame, the picture is less bullish. The rate of the native exchange coin is in the middle of the channel, between the support of $627.99 and the resistance of $750.01.

As none of the sides is dominating, ongoing sideways trading is the more likely scenario until the end of the week.

From the midterm point of view, neither buyers nor sellers are dominating. If the weekly bar closes near current prices, traders may expect consolidation around $700 in the next few days.

BNB is trading at $690.70 at press time.

This content was originally published on U.Today


Source link

14 12, 2024

USA EIA Cuts WTI Oil Price Forecasts

By |2024-12-14T03:54:20+02:00December 14, 2024|Forex News, News|0 Comments


In its latest short term energy outlook (STEO), which was released recently, the U.S. Energy Information Administration (EIA) lowered its West Texas Intermediate (WTI) spot price forecasts for this year and next year.

According to its December STEO, the EIA now sees the WTI spot price averaging $76.51 per barrel in 2024 and $69.12 per barrel in 2025. The EIA’s previous STEO, which was released in November, projected that the WTI spot price would average $77 per barrel in 2024 and $71.60 per barrel in 2025.

In its latest STEO, the EIA forecast that the WTI spot price will average $70.37 per barrel in the fourth quarter of this year, $69.67 per barrel in the first quarter of next year, $69.83 per barrel in the second quarter, $69.50 per barrel in the third quarter, and $67.50 per barrel in the fourth quarter.

The EIA’s November STEO saw the WTI spot price coming in at $72.32 per barrel in the fourth quarter of 2024, $73.67 per barrel in the first quarter of 2025, $73.17 per barrel in the second quarter, $71.17 per barrel in the third quarter, and $68.52 per barrel in the fourth quarter of 2025.

Both STEOs put the 2023 WTI spot price average at $77.58 per barrel and the third quarter 2024 WTI spot price average at $76.43 per barrel.

A research note sent to Rigzone by the JPM Commodities Research team last Friday showed that J.P. Morgan expects the WTI Crude price to average $76 per barrel in 2024, $69 per barrel in 2025, and $57 per barrel in 2026.

J.P. Morgan sees the WTI Crude price averaging $70 per barrel across the fourth quarter of 2024 and first quarter of 2025, $73 per barrel in the second quarter of 2025, $69 per barrel in the third quarter, and $65 per barrel in the fourth quarter, the report showed. The company expects the commodity to come in at $60 per barrel in the first quarter of 2026, $59 per barrel in the second quarter, $55 per barrel in the third quarter, and $53 per barrel in the fourth quarter, according to the report.

A BMI report sent to Rigzone on the same day by the Fitch Group showed that BMI expects the front month WTI Crude price to average $77 per barrel in 2024 and $73 per barrel in 2025.

Another report sent to Rigzone late Tuesday by Standard Chartered Bank Commodities Research Head Paul Horsnell showed that the bank expects the NYMEX WTI basis nearby future crude oil price to average $89 per barrel in 2025, $92 per barrel in 2026, and $103 per barrel in 2027.

That report revealed that Standard Chartered Bank sees the commodity averaging $86 per barrel in the first quarter of next year, $89 per barrel in the second quarter, $92 per barrel in the third quarter, $90 per barrel in the fourth quarter, and $88 per barrel in the first quarter of 2026.

In a Skandinaviska Enskilda Banken AB (SEB) report sent to Rigzone on Thursday, Ole R. Hvalbye, a commodities analyst at the company, warned that WTI positioning “remains in historically bearish territory”.

“Hedge funds and other institutional investors began rebuilding their positions in Brent last week amid OPEC+ negotiations,” Hvalbye said in that report.

“Fund managers added 26 million barrels to their Brent contracts, bringing their net long positions to 157 million barrels – the highest since July. This uptick signals a cautiously optimistic outlook, driven by OPEC+ efforts to manage supply effectively,” he added.

“However, while Brent’s positioning improved to the 35th percentile for weeks since 2010, the WTI positioning remains in historically bearish territory, reflecting broader market skepticism,” he continued.

To contact the author, email andreas.exarheas@rigzone.com


Source link

14 12, 2024

Mark Hartman Joins Food and Drug Administration as OFCSDSI Direct

By |2024-12-14T02:29:07+02:00December 14, 2024|Dietary Supplements News, News|0 Comments


Mark Hartman, the highly respected Deputy Director for Programs in the U.S. Environmental Protection Agency’s (EPA) Office of Pollution Prevention and Toxics (OPPT), will become Director of the U.S. Food and Drug Administration’s (FDA) Office of Food Chemical Safety, Dietary Supplements, and Innovation (OFCSDSI) in its newly formed Human Foods Program (HFP). According to FDA’s website, OFCSDSI “uses a risk-based approach to food chemical safety and dietary supplement policy and coordinates on regulatory and scientific issues for foods made through innovative technologies.” Hartman will begin his position at FDA on December 29, 2024. In his new role, Hartman intends to build an even stronger working relationship between EPA and FDA given the agencies’ common interests in sound scientific risk assessment and regulatory management.

Hartman served in OPPT since 2017 and in EPA’s Office of Chemical Safety and Pollution Prevention (OCSPP). He holds an M.A. in Environmental Studies from George Washington University and an MPA from the Maxwell School at Syracuse University — Maxwell School. EPA’s loss is FDA’s gain.


Source link

14 12, 2024

Legendary Analyst Says You Won’t Believe How Far XRP Will Go With This Altcoin Rival Rallying 36,000% » The Merkle News

By |2024-12-14T02:29:01+02:00December 14, 2024|Crypto News, News|0 Comments

A legendary analyst has recently made predictions that have captured the attention of investors. According to the legendary analyst, the XRP price is set to reach new highs as its altcoin rival, ETFSwap (ETFS), surges by an astonishing 36,000%.

This impressive rally has captured the attention of investors eager to capitalize on potential gains in the coming months, especially following ETFSwap’s recent listing on Uniswap.

Can The XRP Price Breakout Of The Current Price Trend?

The XRP price has recently undergone a significant retracement. Despite this, the legendary analyst remains optimistic, projecting that the XRP price will reach new highs in the coming months as buying pressure continues to build. The legendary analyst, Harry, shared his insights on X, pointing out that XRP has yet to retest the critical $1.96 breakout level.

Currently, the XRP price is hovering between $1.96 and the 2017 all-time high of $2.77. According to the legendary analyst’s technical analysis, this positioning indicates growing bullish momentum. He further suggests that if XRP’s current flag formation breaks to the upside, the XRP price could be poised for a powerful rally toward new highs.

ETFSwap (ETFS): Altcoin Rival To Outperform XRP With 36,000% Surge

ETFSwap (ETFS) is capturing attention, not only for its high-profile listing on Uniswap but also for its groundbreaking approach to ETF trading. Since its recent debut on Uniswap, the platform has delivered remarkable returns, doubling the investments of investors who bought the ETFS token in its just-concluded presale. This strong momentum has prompted a legendary analyst to predict a 36,000% surge for the altcoin rival.

As the first of its kind, ETFSwap (ETFS) allows investors to seamlessly trade tokenized ETFs on the blockchain, providing investors with tools like advanced ETF price tracking, user-friendly trading interfaces, and 24/7 access to global markets. These features have been instrumental in driving traction and fostering wider adoption of the platform among investors and legendary analysts, who recognize its unparalleled potential for long-term growth as an altcoin rival.

With its recent Uniswap listing, investors can now purchase the ETFS token at an affordable price and gain easy access to the platform’s advanced features and incentives. This creates multiple opportunities for profit beyond the anticipated 36,000% surge in the token’s value as predicted by the legendary analyst. For instance, investors who acquire the ETFS token on Uniswap can not only trade tokenized ETFs, but participate in liquidity pools, and earn up to 87% APY through staking.

Unlike many altcoins that lose credibility after listing on major exchanges, this altcoin rival, ETFSwap (ETFS), is securely built on the Ethereum blockchain, ensuring its resilience and ability to thrive in the competitive ETF crypto landscape. Moreover, to add another layer of credibility and boost the confidence of traders, the platform’s network has undergone a thorough audit from Cyberscope. 

With its Uniswap listing already generating significant profit for early investors and its utilities making ETF trading more accessible, ETFSwap (ETFS) is becoming the ultimate choice for investors seeking high returns. Now is the time to act before this altcoin rival gains momentum and skyrockets by 36,000%, leaving the XRP price in its wake.

Conclusion

While the XRP price faces a period of consolidation, ETFSwap (ETFS) is rapidly gaining traction with its innovative approach to ETF trading, and its recent Uniswap listing has provided significant momentum. A legendary analyst is particularly bullish on ETFSwap (ETFS), predicting that this altcoin rival will surge by 36,000%.

Additionally, ETFSwap (ETFS) plans to launch its own ETF in 2025. The ETF status could potentially draw in more institutional and retail investors, further propelling the ETFS price upward. So, for investors looking to capitalize on the potential 36,000% ROI this altcoin rival can give, now is the time to buy the ETFS token at an affordable price on Uniswap.

For more information about the ETFS Launch:

Disclosure: This is a sponsored press release. Please do your research before buying any cryptocurrency or investing in any projects. Read the full disclosure here.

Source link

14 12, 2024

XAU/USD buyers not ready to give up yet

By |2024-12-14T01:51:53+02:00December 14, 2024|Forex News, News|0 Comments


  • Gold price bounces early Friday after correcting from five-week highs of $2,726 on Thursday.       
  • Hot US PPI data boost hawkish December Fed rate cut bets, propping up the US Dollar, Treasury bond yields.
  • Gold price looks to regain $2,700 and beyond as the daily RSI stays bullish and the 50-day SMA holds.

Gold’s price looks to resume this week’s recovery to monthly highs of $2,726 early Friday, following Wednesday’s brief aberration. The US Dollar (USD) consolidates recent gains alongside the US Treasury bond yields amid a relatively light economic calendar heading into the weekend.

Gold price gears up for pre-Fed repositioning

Expectations of a hawkish US Federal Reserve (Fed) interest rate next week fuelled a fresh leg higher in the US Dollar and the US Treasury bond yields on Wednesday, unfolding a corrective decline in Gold price from multi-month highs.

Markets now believe that the Fed could send a hawkish message by signalling a pause in January following the expected 25 basis points (bps) rate cut at its December 17-18 policy meeting, especially after the US Producer Price Index (PPI) data came in hotter-than-expected.

The annual PPI rose 3.0% in November, above the market expectation of a 2.6% growth. Meanwhile, the annual core PPI rose 3.4% in the same period, surpassing the estimate of 3.2%. The monthly PPI and the core PPI rose 0.4% and 0.2%, respectively. Markets are fully pricing in a 25 bps rate cut by the Fed next week, the CME Group’s FedWatch Tool shows.

Meanwhile, the USD also drew support from a EUR/USD sell-off in the face of a dovish rate cut delivered by the European Central Bank (ECB). Additionally, rallying US Treasury bond yields on solid bond auctions this week underpinned the sentiment around the Greenback while capping the Gold price uptrend.

In Friday’s trading so far, Gold price is finding fresh demand as China’s stimulus optimism fades on increasing worries over the US-Sino trade war. In a gated story, the Wall Street Journal (WSJ) reported that China has already begun retaliating to the upcoming US President-elect Donald Trump’s tariffs by deploying non-tariff measures. “China launched a regulatory probe into Nvidia, threatened to blacklist an American apparel maker, blocked the export of critical minerals to the US and squeezed the supply chain for drones,” the WSJ said.

Markets will continue to take cues from broader market sentiment without any top-tier US economic data releases later in the day. The end-of-the-week flows and repositioning ahead of next week’s Fed policy decision will also play their part in driving Gold price.

Gold price technical analysis: Daily chart

Gold price faced rejection at higher levels on Thursday and turned south before finding support at the 50-day Simple Moving Average (SMA) at $2,671 early Friday.

The 14-day Relative Strength Index (RSI) has also witnessed a renewed upside while holding well above the 50 level.

If Gold price resumes the recovery momentum, it could retest the multi-week high of $2,726, above which 2,750, the confluence of the psychological barrier and the November 5 high, will act as a tough nut to crack.

A failure to defend the 50-day SMA support at $2,671 on a daily candlestick closing basis will prompt sellers to target the 21-day SMA at $2,650 once again.

The last line of defence for Gold buyers is seen at the previous week’s low of $2,613.

Gold FAQs

Gold has played a key role in human’s history as it has been widely used as a store of value and medium of exchange. Currently, apart from its shine and usage for jewelry, the precious metal is widely seen as a safe-haven asset, meaning that it is considered a good investment during turbulent times. Gold is also widely seen as a hedge against inflation and against depreciating currencies as it doesn’t rely on any specific issuer or government.

Central banks are the biggest Gold holders. In their aim to support their currencies in turbulent times, central banks tend to diversify their reserves and buy Gold to improve the perceived strength of the economy and the currency. High Gold reserves can be a source of trust for a country’s solvency. Central banks added 1,136 tonnes of Gold worth around $70 billion to their reserves in 2022, according to data from the World Gold Council. This is the highest yearly purchase since records began. Central banks from emerging economies such as China, India and Turkey are quickly increasing their Gold reserves.

Gold has an inverse correlation with the US Dollar and US Treasuries, which are both major reserve and safe-haven assets. When the Dollar depreciates, Gold tends to rise, enabling investors and central banks to diversify their assets in turbulent times. Gold is also inversely correlated with risk assets. A rally in the stock market tends to weaken Gold price, while sell-offs in riskier markets tend to favor the precious metal.

The price can move due to a wide range of factors. Geopolitical instability or fears of a deep recession can quickly make Gold price escalate due to its safe-haven status. As a yield-less asset, Gold tends to rise with lower interest rates, while higher cost of money usually weighs down on the yellow metal. Still, most moves depend on how the US Dollar (USD) behaves as the asset is priced in dollars (XAU/USD). A strong Dollar tends to keep the price of Gold controlled, whereas a weaker Dollar is likely to push Gold prices up.


Source link

14 12, 2024

Hovers near 1.0500 post-ECB’s rate cut

By |2024-12-14T00:29:48+02:00December 14, 2024|Forex News, News|0 Comments

  • EUR/USD remains tethered to the 1.0500 mark, rebounding slightly to 1.0498 after testing weekly lows.
  • Technical analysis shows the pair is in a delicate balance, with potential to challenge resistance if it sustains above 1.0500.
  • Key resistances are set at 1.0530 and 1.0600, while supports loom near 1.0452 and the YTD low of 1.0331.

The EUR/USD remains reluctant to remain far from the 1.0500 figure for the fifth consecutive day, even though the ECB decided to cut rates on Thursday, which pushed the pair toward its weekly low of 1.0452. Nevertheless, buyers stepped in and lifted the exchange rate toward the current level of 1.0498.

EUR/USD Price Forecast: Technical outlook

The EUR/USD daily chart suggests the pair hovers near 1.0500, unable to edge lower decisively and retest year-to-date (YTD) low figures at 1.0331. Even though the pair is carving successive series of lower and lower highs, it might be difficult to extend its downtrend.

Momentum, as measured by the Relative Strength Index (RSI), suggests that buyers gain steam. If they achieve a daily close above 1.0500, this can give them a leg-up.

In that outcome, EUR/USD’s key resistance levels lie at the December 12 high of 1.0530, followed by 1.0600 and last week’s peak of 1.0629.

On the other hand, if EUR/USD remains below 1.0500, the major could extend its losses, past 1.0452. A breach of the latter will expose the November 26 low of 1.0424, followed by the November 22 swing low of 1.0331.

EUR/USD Price Chart – Daily

Euro PRICE Today

The table below shows the percentage change of Euro (EUR) against listed major currencies today. Euro was the strongest against the Japanese Yen.

  USD EUR GBP JPY CAD AUD NZD CHF
USD   -0.28% 0.41% 0.68% 0.02% 0.11% 0.13% 0.05%
EUR 0.28%   0.69% 0.97% 0.30% 0.40% 0.41% 0.33%
GBP -0.41% -0.69%   0.27% -0.38% -0.30% -0.28% -0.36%
JPY -0.68% -0.97% -0.27%   -0.64% -0.57% -0.55% -0.62%
CAD -0.02% -0.30% 0.38% 0.64%   0.08% 0.11% 0.03%
AUD -0.11% -0.40% 0.30% 0.57% -0.08%   0.02% -0.06%
NZD -0.13% -0.41% 0.28% 0.55% -0.11% -0.02%   -0.08%
CHF -0.05% -0.33% 0.36% 0.62% -0.03% 0.06% 0.08%  

The heat map shows percentage changes of major currencies against each other. The base currency is picked from the left column, while the quote currency is picked from the top row. For example, if you pick the Euro from the left column and move along the horizontal line to the US Dollar, the percentage change displayed in the box will represent EUR (base)/USD (quote).


Source link

14 12, 2024

Matcha tea house and bakery opens in Falls Church

By |2024-12-14T00:27:02+02:00December 14, 2024|Dietary Supplements News, News|0 Comments


A cozy cafe serving Japanese matcha and French pastries opened its doors last month in Falls Church.

Offerings at Midori Tea House include sparkling fruit drinks, hot tea, petite desserts — and of course, the cafe’s specialty, matcha.

The cafe at 450 W. Broad Street is all about the hand-whisked green tea drink, currently offering 12 variations of it, co-owner Annie Pan told ARLnow.

“We wanted to keep the traditional way of how matcha is made, but combining with new innovation — like, recipes that we added together … just something fun to drink [that] everyone can try out,” Pan said.

The business, named after the Japanese word for “green,” offers standard matcha lattes plus flavors like orange, a striking purple ube and Pan’s personal favorite, maple and sea salt.

“You barely notice it’s maple, unless you see them put maple into your drink,” she said. “It’s very subtle, it has a hint of salt in there to bring out the flavor together. It’s what I could just drink everyday.”

Drinks can be customized by sweetness level or by adding toppings like Biscoff cookie crumble. The cafe, which recommends a lower sugar content, also provides non-dairy options.

Quite a few bite-sized confections, co-owner Rithy Um’s specialty, can also be found at the tea house. Homemade treats like macarons pull on European influences, while others, like a yuzu mousse cake and ube tres leches, spotlight Asian flavors.

Pan first fell in love with Japanese cuisine as a waitress at a Japanese restaurant while attending Virginia Tech.

A later trip to Japan introduced her to rich, flavorful matcha that she hadn’t yet experienced in the States. She enjoys the beverage as a substitute for coffee due to its similar caffeine content, lack of strong odor, and tendency to make her less jittery.

Over time, Midori’s matcha types may rotate. Pan hinted at upcoming seasonal flavors like toffee nut.

Pan, formerly a technology consultant, said she has enjoyed the past few weeks opening her first brick-and-mortar location. She had previously operated the tea house as a pop-up shop around Northern Virginia for about a year.

“One of our missions is to be like a lighthouse and the most beloved in the neighborhood,” Pan said. “The community here is very welcoming and supportive of my new-coming business. We’re very proud to be here.”

The cafe’s space used to hold Stylish Patina Home boutique, which is currently in business nearby at 248 W. Broad Street.


  • Katie Taranto is a reporter at Local News Now, primarily covering business, public safety and the city of Falls Church. She graduated from the University of Missouri in 2024, where she previously covered K-12 education at The Columbia Missourian. She is originally from Macungie, Pennsylvania.


Source link

13 12, 2024

Natural Gas Price Forecast: Retreats and Faces Support Test at 20-Day Moving Average

By |2024-12-13T23:50:53+02:00December 13, 2024|Forex News, News|0 Comments


Retest of 20-Day MA Support Looks Likely

It looks like a test of the 20-Day MA may be in process. The 20-Day line, now at 3.19, was reclaimed on Tuesday with a bullish doji hammer candlestick pattern. So, this pullback will be the first real test of support around the 20-Day line since natural gas rose away from the line three days ago. Therefore, it should reject price to the upside. Keep in mind though that there were four days near the recent lows where trading occurred below the 20-Day line, then quickly recovered. That could happen again on this test.

Close Below 3.28 Would Fail to Confirm Weekly Breakout

An important observation to consider is indicated in the weekly chart (not shown). There was a bullish weekly reversal that triggered above last week’s high of 3.28 earlier this week. The high for the week was 3.56 and the low was 3.07. However, given today’s pullback and where natural gas is now trading, there is a risk that the weekly breakout will not be confirmed with a weekly close above last week’s high. Something to look at as a close below the high could be interpreted as another bearish indication that could lead to a longer recovery before natural gas is once again ready to test recent highs.

Traded Inside Month

Moreover, on the monthly chart (not shown), trading in December has been confined within November’s trading range. Might this month end with an inside month? There is a slight upward bias indicated as this month’s price range is contained within the upper half of November’s range and the high was a direct test of the prior high. But given the failure to break out to new highs yesterday and today’s bearish response, this may be indicating the next test of highs may not occur until next month.

For a look at all of today’s economic events, check out our economic calendar.


Source link

Go to Top