About Editorial team of BIPNs

Main team of content of bipns.com. Any type of content should be approved by us.
2 12, 2024

Liposomal Vitamins and Minerals Market Share and Size Report 2024-2031

By |2024-12-02T11:50:49+02:00December 2, 2024|Dietary Supplements News, News|0 Comments


Chapter 1.          Methodology and Scope

1.1.        Research Methodology

1.2.        Research Scope & Assumptions

Chapter 2.          Executive Summary

Chapter 3.          Global Liposomal Vitamins and Minerals Market Snapshot

Chapter 4.          Global Liposomal Vitamins and Minerals Market Variables, Trends & Scope

4.1.        Market Segmentation & Scope

4.2.        Drivers

4.3.        Challenges

4.4.        Trends

4.5.        Investment and Funding Analysis

4.6.        Porter’s Five Forces Analysis

4.7.        Incremental Opportunity Analysis (US$ MN), 2024-2031

4.8.        Global Liposomal Vitamins and Minerals Market Penetration & Growth Prospect Mapping (US$ Mn), 2023-2031

4.9.        Competitive Landscape & Market Share Analysis, By Key Player (2023)

4.10.     Use/impact of AI on Liposomal Vitamins and Minerals Industry Trends

Chapter 5.          Liposomal Vitamins and Minerals Market Segmentation 1: By Product Type, Estimates & Trend Analysis

5.1.        Market Share by Product Type, 2023 & 2031

5.2.        Market Size (Value US$ Mn) & Forecasts and Trend Analyses, 2019 to 2031 for the following Product Type:

5.2.1.    Vitamins

5.2.1.1. Vitamin C

5.2.1.2. Vitamin A

5.2.1.3. Vitamin B12

5.2.1.4. Vitamin E

5.2.1.5. Vitamin K

5.2.1.6. Combinations

5.2.1.6.1.            Vitamin B Complex

5.2.1.6.2.            Vitamin D3 & K2

5.2.1.6.3.            Others

5.2.2.    Minerals

5.2.2.1. Iron (Fe)

5.2.2.2. Magnesium (Mg)

5.2.2.3. Zinc (Zn)

5.2.2.4. Others

5.2.3.    Collagen

5.2.4.    Glutathione

5.2.5.    Curcumin

5.2.6.    Melatonin

5.2.7.    Others

Chapter 6.          Liposomal Vitamins and Minerals Market Segmentation 3: By Formulation, Estimates & Trend Analysis

6.1.        Market Share by Formulation, 2023 & 2031

6.2.        Market Size (Value US$ Mn) & Forecasts and Trend Analyses, 2019 to 2031 for the following Formulation:

6.2.1.    Capsules

6.2.2.    Softgels

6.2.3.    Liquids

6.2.4.    Gummies

6.2.5.    Others

Chapter 7.          Liposomal Vitamins and Minerals Market Segmentation 4: By End-user, Estimates & Trend Analysis

7.1.        Market Share by End-user, 2023 & 2031

7.2.        Market Size (Value US$ Mn) & Forecasts and Trend Analyses, 2019 to 2031 for the following End-user:

7.2.1.    Online

7.2.1.1. Company Owned Websites

7.2.1.2. Third Party Aggregators

7.2.2.    Offline

7.2.2.1. Hypermarkets / Supermarkets

7.2.2.2. Retail Drug Stores

7.2.2.3. Others

Chapter 8.          Liposomal Vitamins and Minerals Market Segmentation 5: Regional Estimates & Trend Analysis

8.1.        Global Liposomal Vitamins and Minerals Market, Regional Snapshot 2023 & 2031

8.2.        North America

8.2.1.    North America Liposomal Vitamins and Minerals Market Revenue (US$ Million) Estimates and Forecasts by Country, 2024-2031

8.2.1.1. US

8.2.1.2. Canada

8.2.2.    North America Liposomal Vitamins and Minerals Market Revenue (US$ Million) Estimates and Forecasts by Product Type, 2024-2031

8.2.3.    North America Liposomal Vitamins and Minerals Market Revenue (US$ Million) Estimates and Forecasts by Formulation, 2024-2031

8.2.4.    North America Liposomal Vitamins and Minerals Market Revenue (US$ Million) Estimates and Forecasts by End-user, 2024-2031

8.3.        Europe

8.3.1.    Europe Liposomal Vitamins and Minerals Market Revenue (US$ Million) Estimates and Forecasts by Country, 2024-2031

8.3.1.1. Germany

8.3.1.2. U.K.

8.3.1.3. France

8.3.1.4. Italy

8.3.1.5. Spain

8.3.1.6. Rest of Europe

8.3.2.    Europe Liposomal Vitamins and Minerals Market Revenue (US$ Million) Estimates and Forecasts by Product Type, 2024-2031

8.3.3.    Europe Liposomal Vitamins and Minerals Market Revenue (US$ Million) Estimates and Forecasts by Formulation, 2024-2031

8.3.4.    Europe Liposomal Vitamins and Minerals Market Revenue (US$ Million) Estimates and Forecasts by End-user, 2024-2031

8.4.        Asia Pacific

8.4.1.    Asia Pacific Liposomal Vitamins and Minerals Market Revenue (US$ Million) Estimates and Forecasts by Country, 2024-2031

8.4.1.1. India

8.4.1.2. China

8.4.1.3. Japan

8.4.1.4. Australia

8.4.1.5. South Korea

8.4.1.6. Hong Kong

8.4.1.7. Southeast Asia

8.4.1.8. Rest of Asia Pacific

8.4.2.    Asia Pacific Liposomal Vitamins and Minerals Market Revenue (US$ Million) Estimates and Forecasts by Product Type, 2024-2031

8.4.3.    Asia Pacific Liposomal Vitamins and Minerals Market Revenue (US$ Million) Estimates and Forecasts By Formulation, 2024-2031

8.4.4.    Asia Pacific Liposomal Vitamins and Minerals Market Revenue (US$ Million) Estimates and Forecasts by End-user, 2024-2031

8.5.        Latin America

8.5.1.    Latin America Liposomal Vitamins and Minerals Market Revenue (US$ Million) Estimates and Forecasts by Country, 2024-2031

8.5.1.1. Brazil

8.5.1.2. Mexico

8.5.1.3. Rest of Latin America

8.5.2.    Latin America Liposomal Vitamins and Minerals Market Revenue (US$ Million) Estimates and Forecasts by Product Type, 2024-2031

8.5.3.    Latin America Liposomal Vitamins and Minerals Market Revenue (US$ Million) Estimates and Forecasts by Formulation, 2024-2031

8.5.4.    Latin America Liposomal Vitamins and Minerals Market Revenue (US$ Million) Estimates and Forecasts by End-user, 2024-2031

8.6.        Middle East & Africa

8.6.1.    Middle East & Africa Liposomal Vitamins and Minerals Market Revenue (US$ Million) Estimates and Forecasts by country, 2024-2031

8.6.1.1. GCC Countries

8.6.1.2. Israel

8.6.1.3. South Africa

8.6.1.4. Rest of Middle East and Africa

8.6.2.    Middle East & Africa Liposomal Vitamins and Minerals Market Revenue (US$ Million) Estimates and Forecasts by Product Type, 2024-2031

8.6.3.    Middle East & Africa Liposomal Vitamins and Minerals Market Revenue (US$ Million) Estimates and Forecasts by Formulation, 2024-2031

8.6.4.    Middle East & Africa Liposomal Vitamins and Minerals Market Revenue (US$ Million) Estimates and Forecasts by End-user, 2024-2031

Chapter 9.          Competitive Landscape

9.1.        Major Mergers and Acquisitions/Strategic Alliances

9.2.        Company Profiles


9.2.1.    Codeage LLC

9.2.1.1. Business Overview

9.2.1.2. Key Product/Service Offerings

9.2.1.3. Financial Performance

9.2.1.4. Geographical Presence

9.2.1.5. Recent Developments with Business Strategy

9.2.2.    ActiNovo

9.2.3.    Life Cykel Labs LLC

9.2.4.    Goldman Laboratories LTD

9.2.5.    LivOn Labs

9.2.6.    Core Med Science

9.2.7.    Quicksilver Scientific, Inc.

9.2.8.    Nutra Biogenesis

9.2.9.    DaVinci Laboratories

9.2.10.  KAL Vitamins

9.2.11.  California Gold Nutrition

9.2.12.  CYMBIOTIKA LLC

9.2.13.  BodyBio

9.2.14.  Terry Naturally Vitamins

9.2.15.  NOW Foods

9.2.16.  Pure Encapsulations

9.2.17.  Mercola

9.2.18.  Thorne

9.2.19.  Nutrex Hawaii

9.2.20.  Designs for Health

9.2.21.  NutroCology

9.2.22.  Valimenta

9.2.23.  LipoCellTech

9.2.24.  PlantaCorp

9.2.25.  Liposome Technology

9.2.26.  Other Prominent Players


Source link

2 12, 2024

XRP Price Prediction: Top 4 Altcoins Ready for December Rally

By |2024-12-02T11:49:07+02:00December 2, 2024|Crypto News, News|0 Comments

Bitcoin’s dominance over the crypto market has hit a critical juncture, falling to 56%, a two-year low. That shift signals the arrival of “altseason,” where smaller cryptocurrencies often rally as investors pivot from Bitcoin to altcoins. Here are the Top 4 ‘alts’ for December – with XRP leading the field.

Analyst Mikybull Crypto pointed out in a Nov. 30 X post that this change in Bitcoin dominance could lead to a significant upswing for altcoins in December.

Source: Mikybull Crypto

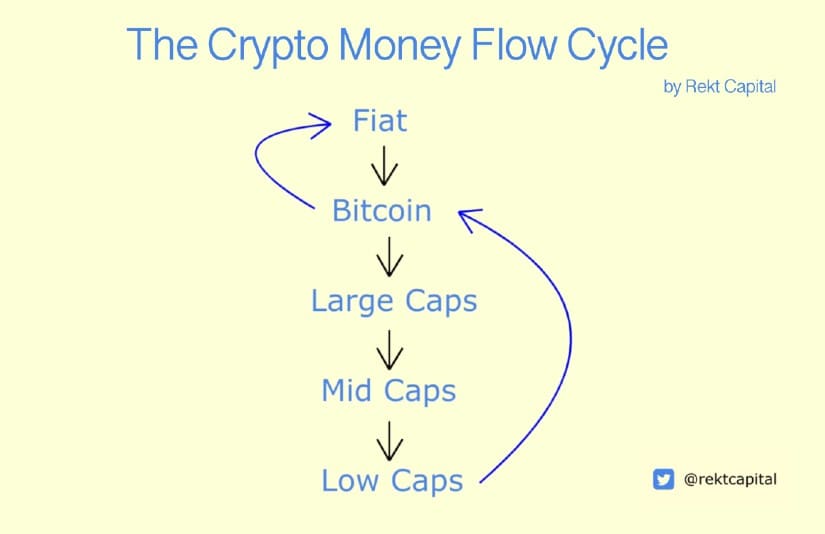
The period, known as altseason, typically happens when Bitcoin’s dominance over the crypto market wanes. A declining Bitcoin dominance indicates that investors are moving their funds from Bitcoin into alternative digital assets, potentially driving up their prices.

XRP Price Prediction: Top 4 Altcoins Ready for December Rally

Source: Rekt Capital

The trend is already visible. Ether, the second-largest cryptocurrency, has seen demand for leveraged exchange-traded funds (ETFs) skyrocket by over 160% since Donald Trump won the U.S. presidential election on Nov. 5. Analysts believe this could propel Ether past $4,000 in the near term.

Ripple (XRP) Surges 284% in November – Still Eyeing $2.57 Mark

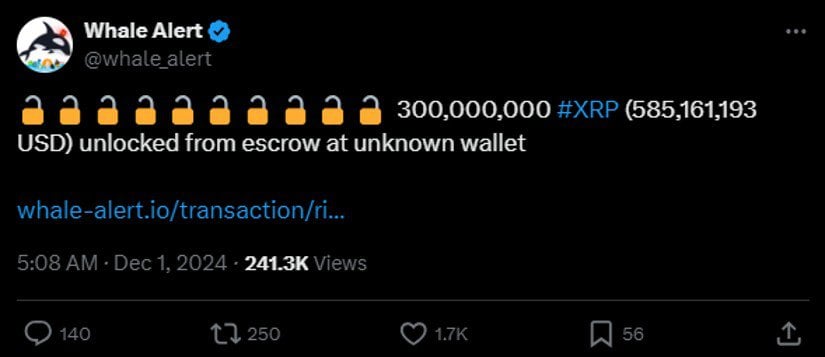
The XRP news has been all good recently. On Dec. 1, Ripple unlocked 1 billion XRP tokens, valued at $1.92 billion. This routine release aims to ensure a predictable supply of XRP, aligning with its long-term escrow plan to release 55 billion tokens—about 55% of the total supply.

Ripple

Source: whale_alert

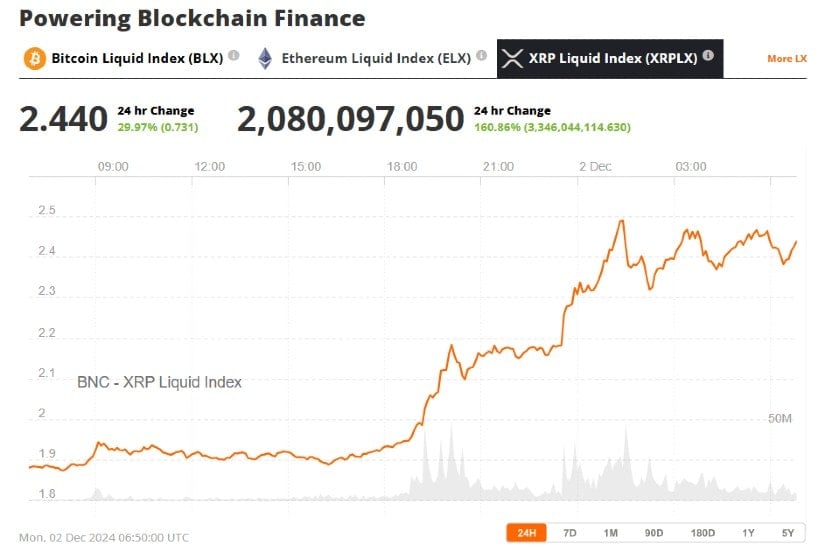
Despite these releases diluting supply, the XRP price continues to rise. November marked its best month since December 2017, with a stunning 284% surge. XRP currently trades at $2.44 at the time of writing, marking a 30% gain in the last 24 hours.

XRP price continues to rise

XRP Price Prediction

“XRP could reach $2.57 in [December 2024] […], which has historically shown significant growth […] in 228 days after Bitcoin halving,” said Ryan Lee, chief analyst at Bitget Research.

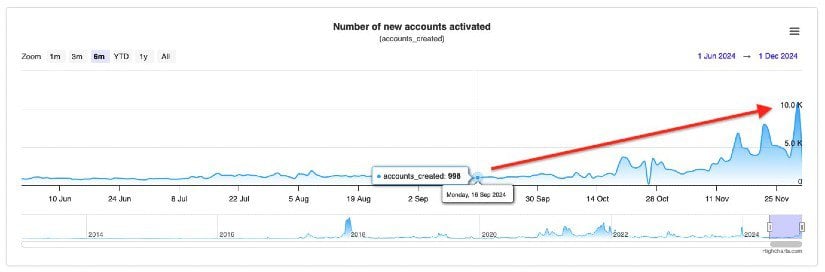
Adding to the bullish sentiment, data from XRPScan revealed a 10x increase in XRP wallet activations over the last three months, reflecting growing investor interest. The XRP rally is potentially driven by the ETF buzz and expectations of a favorable regulatory environment, especially after SEC Chair Gary Gensler announced his departure.

XRP Price Prediction 

Source: XRPScan

The market cap of XRP (XRP) crossed US$100 billion over the weekend as it continued an aggressive rally that does not look like stopping anytime soon.

XRP was built by Ripple, a payment company, that aims to compete with the cross-border banking payment protocol SWIFT through products like the XRP ledger. XRP supports the permissionless payment network XRP ledger as its native token.

XRP gained fresh momentum last week, following reports that the New York Department of Financial Services had indicated to Ripple that it would be approving the company’s legally regulated stablecoin RLUSD. It is believed that Ripple

Will Dogecoin (DOGE) See a 337.5% December Rally?

Dogecoin, often dubbed the king of meme coins, could benefit from a seasonal phenomenon known as the “Santa Claus rally.” Traditionally observed in stock markets, this rally often pushes asset prices higher in the final days of December and the first days of January.

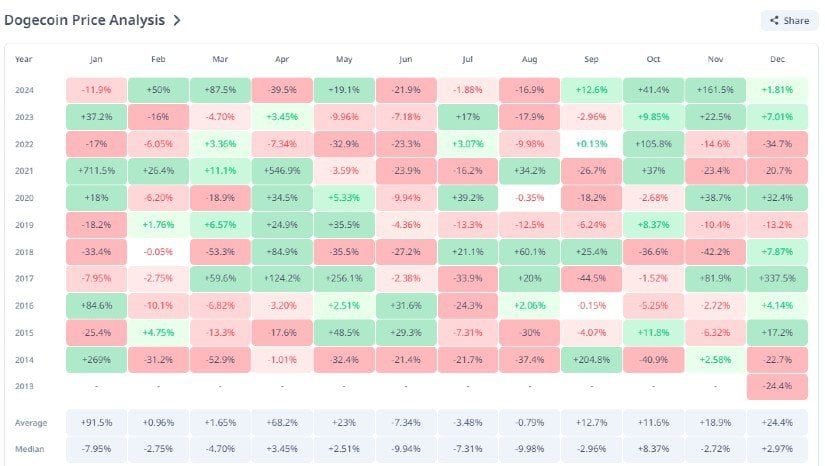
DOGE has shown impressive December performances in the past. CryptoRank data highlights a staggering 337.5% rise in December 2017 and moderate gains of 32.4% in 2020. Although last December saw a 34.7% drop, some traders anticipate a potential rebound this year, citing DOGE’s unique market dynamics and popularity.

Will Dogecoin See a December Rally

Can Injective (INJ) Price Surge 80% More?

Injective (INJ), a decentralized exchange protocol, has been making strides with recent upgrades to its mainnet. These improvements enhance scalability and user experience, likely drawing more traders and boosting the demand for INJ tokens.

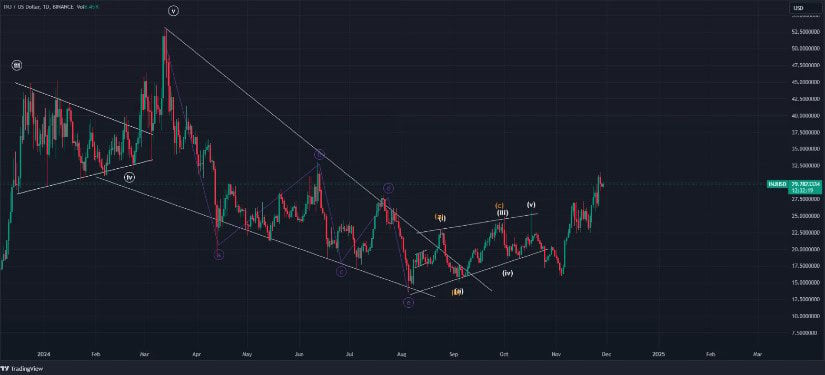
Strategic partnerships with other DeFi projects have bolstered Injective’s ecosystem, offering users more trading options. Its price action supports the bullish narrative. Since Nov. 4, when it broke above descending resistance, INJ’s price soared 80%, reaching $31. Analysts suggest this is just the beginning of a larger five-wave rally expected to unfold through December.

Can Injective Price Surge More

Source: TradingView

Can Render (RNDR) Hit $13.60 Again?

Render (RNDR) is carving its niche in the crypto market with its decentralized GPU rendering network. This platform connects digital creators with GPU power providers, streamlining rendering processes for artists and studios.

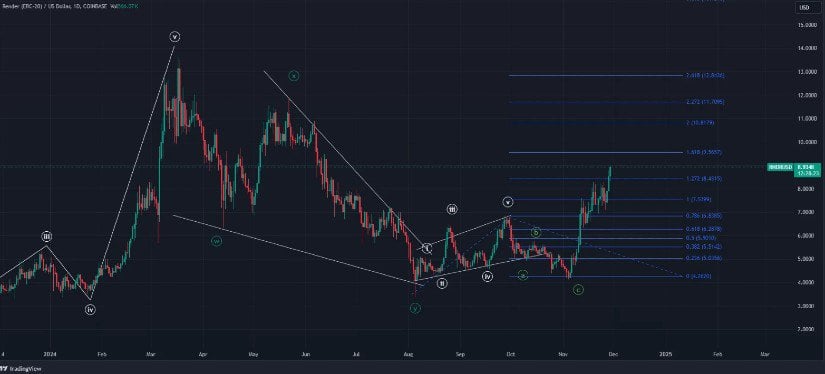
The Render Network’s growth has been phenomenal, driven by infrastructure improvements that enhance rendering speed and reduce costs. These advancements have made the platform increasingly popular among digital creators. Similar to INJ, RNDR’s price has risen sharply, climbing 116% since Nov. 4. It is currently trading around $9, with analysts eyeing a potential revisit to its yearly high of $13.60.

Can Render (RNDR) Hit $13.60 Again

Source: TradingView

Source link

2 12, 2024

The potential support level to watch is near 1.2600: Analytics and Market news from 2 December 2024 06:59

By |2024-12-02T09:52:11+02:00December 2, 2024|Forex News, News|0 Comments

  • GBP/USD trades in the negative territory around 1.2700 in Monday’s early European session. 
  • The negative outlook of the pair remains intact below the 100-day EMA, with a bearish RSI indicator. 
  • The first downside target to watch is the 1.2600 psychological level; the immediate resistance level is seen at 1.2834. 

The GBP/USD pair tumbles to near 1.2700 during the early European session on Monday, pressured by the firmer US Dollar (USD) broadly. The US President-elect Donald Trump’s tariff threats, the rising geopolitical tensions in West Asia and the rising expectation for less aggressive Fed rate cuts support the Greenback and act as a headwind for GBP/USD. The release of US ISM Manufacturing Purchasing Managers Index (PMI) data will be the highlight on Monday. 

Technically, the negative view of GBP/USD prevails, with the price holding below the key 100-day Exponential Moving Average (EMA) on the daily chart. The downward momentum of the major pair is reinforced by the 14-day Relative Strength Index (RSI), which stands below the midline around 44.40. 

The initial support level for GBP/USD emerges at the 1.2600 psychological level. Sustained bearish momentum could drag the major pair to the lower limit of the Bollinger Band at 1.2445. A break below this level could push prices lower toward 1.2331, the low of April 23.  

On the bright side, the first upside barrier is located at 1.2834, the low of November 6. Extended gains above this level could pave the way for a test of the 1.2890-1.2900 zone, representing the round mark and the 100-day EMA. The psychological level and the upper boundary of the Bollinger Band of 1.3000 appear to be a tough nut to crack for bulls.  

GBP/USD daily chart

Pound Sterling FAQs

The Pound Sterling (GBP) is the oldest currency in the world (886 AD) and the official currency of the United Kingdom. It is the fourth most traded unit for foreign exchange (FX) in the world, accounting for 12% of all transactions, averaging $630 billion a day, according to 2022 data. Its key trading pairs are GBP/USD, also known as ‘Cable’, which accounts for 11% of FX, GBP/JPY, or the ‘Dragon’ as it is known by traders (3%), and EUR/GBP (2%). The Pound Sterling is issued by the Bank of England (BoE).

The single most important factor influencing the value of the Pound Sterling is monetary policy decided by the Bank of England. The BoE bases its decisions on whether it has achieved its primary goal of “price stability” – a steady inflation rate of around 2%. Its primary tool for achieving this is the adjustment of interest rates. When inflation is too high, the BoE will try to rein it in by raising interest rates, making it more expensive for people and businesses to access credit. This is generally positive for GBP, as higher interest rates make the UK a more attractive place for global investors to park their money. When inflation falls too low it is a sign economic growth is slowing. In this scenario, the BoE will consider lowering interest rates to cheapen credit so businesses will borrow more to invest in growth-generating projects.

Data releases gauge the health of the economy and can impact the value of the Pound Sterling. Indicators such as GDP, Manufacturing and Services PMIs, and employment can all influence the direction of the GBP. A strong economy is good for Sterling. Not only does it attract more foreign investment but it may encourage the BoE to put up interest rates, which will directly strengthen GBP. Otherwise, if economic data is weak, the Pound Sterling is likely to fall.

Another significant data release for the Pound Sterling is the Trade Balance. This indicator measures the difference between what a country earns from its exports and what it spends on imports over a given period. If a country produces highly sought-after exports, its currency will benefit purely from the extra demand created from foreign buyers seeking to purchase these goods. Therefore, a positive net Trade Balance strengthens a currency and vice versa for a negative balance.


Source link

2 12, 2024

Nutraceutical Excipients Market: Key Trends, Drivers,

By |2024-12-02T09:50:23+02:00December 2, 2024|Dietary Supplements News, News|0 Comments


Nutraceutical Excipients Market

InsightAce Analytic Pvt. Ltd. announces the release of a market assessment report on the “Nutraceutical Excipients Market”-, By Product Source (Organic Chemicals, Inorganic Chemicals), Functionality (Binders, Colorants, Flavors & Sweeteners), End Product (Protein & Amino Acids, Omega-3 Fatty Acids, Vitamins, Minerals, Prebiotics, Probiotics, Other), Formulation (Dry, Tablets, Capsules, Liquid, Other), Functionality Application (Taste Masking, Stabilizers, Modified-Release Solubility & Bioavailability, Others), Industry Trends, and Global Forecasts, 2022-2035 And Segment Revenue and Forecast To 2031.”

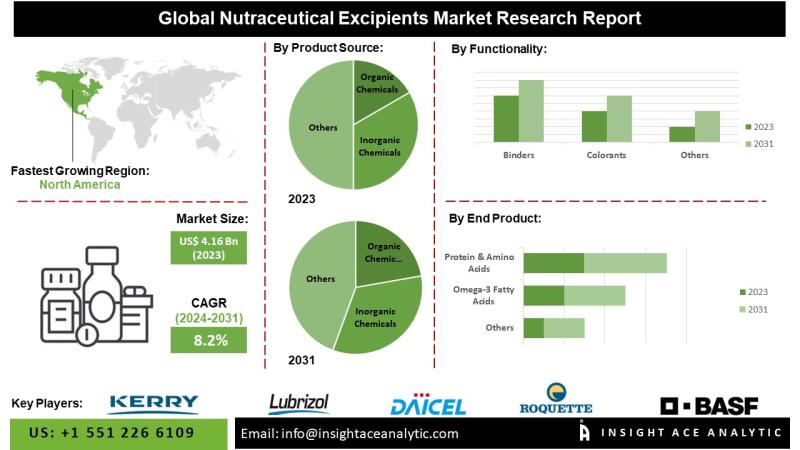
The Nutraceutical Excipients Market is estimated to reach over USD 7.70 billion by 2031, exhibiting a CAGR of 8.2% during the forecast period.

Get Free Access to Demo Report, Excel Pivot and ToC: https://www.insightaceanalytic.com/request-sample/2741

Nutraceuticals, a combination of “nutrition” and “pharmaceuticals,” represent a rapidly growing sector in the health and wellness industry. These products encompass a wide range of functional foods, beverages, and dietary supplements that offer health benefits beyond basic nutrition. One of the critical components in nutraceutical formulations is excipients, which play a vital role in enhancing the product’s stability and effectiveness. Excipients are inert substances added to improve the solubility, bioavailability, and overall efficacy of the active ingredients. In the nutraceutical industry, excipients serve various functions as binders, fillers, disintegrants, lubricants, coatings, and flavoring agents, ensuring the product’s stability and enhancing the consumer experience.

Innovations in encapsulation, liposomal delivery, and other advanced technologies are significantly enhancing the bioavailability and efficacy of nutraceutical ingredients. This progress has led to the creation of excipients that offer benefits beyond their traditional roles, contributing to the overall effectiveness of nutraceutical products. Additionally, there is a growing focus on developing excipient-based solutions that cater to the specific needs of tailored nutraceutical products, allowing for more personalized health interventions. Furthermore, the industry is increasingly prioritizing the development of sustainable and environmentally friendly excipients, reflecting the broader trend towards eco-consciousness in product formulation and manufacturing

List of Prominent Players in the Nutraceutical Excipients Market:

• International Flavors & Fragrances Inc

• Kerry Group Plc

• Ingredion

• Sensient Technologies Corporation

• Associated British Foods Plc

• BASF SE

• Roquette Frères

• Meggle Group Gmbh

• Cargill, Incorporated

• Ashland

• Azelis Group

• Imcd

• Hilmar Cheese Company, Inc.

• Seppic

• Biogrund Gmbh

• Dow Du Pont Inc.

• Lubrizol Corporation

• SPI Pharma Inc.

• Innophos

• Jrs Pharma

• Galenova Inc.

• BINDERS

• Daicel Corporation

• Alsiano A/S

• Colorcon

• Panchamrut Chemicals

• Omya

• Gattefossé

• Fuji Chemical Industries Co., Ltd

• Jigs Chemical

Expert Knowledge, Just a Click Away: https://calendly.com/insightaceanalytic/30min?month=2024-02

Market Dynamics:

Drivers:

Consumers are increasingly focused on preventive healthcare and wellness, driving demand for nutraceuticals. Excipients play a critical role in improving the effectiveness and formulation of these products. With an increase in lifestyle-related diseases and aging populations, there is a growing demand for functional foods and dietary supplements that offer health benefits beyond basic nutrition. Excipients help ensure product stability and enhance the performance of these products. As healthcare expenses rise globally, more people are turning to nutraceuticals for preventive care, increasing the demand for excipients that support effective, affordable products. The push for higher quality and safety standards for nutraceutical products has increased the demand for advanced excipients that comply with global regulatory requirements and ensure consistent product quality.

Challenges:

One inhibitory issue may be customers’ lack of knowledge about the functions and advantages of nutraceutical excipients. Market expansion may be impacted by a lack of knowledge on the importance of excipients in nutraceutical formulations. Furthermore, it might be costly to conduct research, produce, and test novel nutraceutical excipients. Exorbitant development expenses may pose a challenge, particularly for smaller businesses, impeding their capacity to introduce pioneering excipients to the market.

Regional Trends:

North America is expected to dominate the nutraceutical excipients market during the forecast period. North America, particularly the United States and Canada, leads in the nutraceutical excipients market due to high consumer demand for dietary supplements and functional foods. The region is a hotspot for innovation and technological advancements in excipient development, driven by a robust research and development infrastructure. However, Asia Pacific is a rapidly growing region due to the demand for novel and potent nutraceutical formulations is being driven by this increased awareness of health, which calls for the usage of specialist excipients. Dietary patterns have changed as a result of urbanization and changing lifestyles in the APAC region.

Unlock Your GTM Strategy: https://www.insightaceanalytic.com/customisation/2741

Recent Developments:

• In September 2022, Roquette, completed the purchase of Crest Cellulose, an Indian excipient manufacturer, a company well-known for its proficiency with plant-based components and its prominent position as a provider of pharmaceutical and nutraceutical excipients. This latest move, which builds on Roquette’s 2018 acquisition of a majority stake, demonstrates the company’s dedication to achieving its ambitious expansion targets and meeting the growing global demand for premium plant-based excipients. This calculated action is in line with Roquette’s efforts to satisfy the growing demand for premium excipients made from plant sources on a global scale.

• November 2022, JRS PHARMA proudly announced LUBRITAB® RBW, its newest all-natural excipient. LUBRITAB® RBW was created as a lubricant for tablet and capsule formulations. It can be used in wet or dry granulation formulations, direct compression, and continuous manufacturing. When used at greater levels, it may be combined with an anti-adherent. As of right now, USA Nutra products are the only ones with LUBRITAB® RBW regulatory certification.

Segmentation of Nutraceutical Excipients Market.

Global Nutraceutical Excipients Market – By Product Source

• Organic Chemicals

• Inorganic Chemicals

• Other Chemicals

Global Nutraceutical Excipients Market – By Functionality

• Fillers & Diluents

• Suspending & Viscosity Agents

• Coating Agents

• Binders

• Flavoring Agents & Sweeteners

• Disintegrants

• Colorants

• Lubricants & Glidants

• Preservatives

• Emulsifying Agents

• Other Functionalities

Global Nutraceutical Excipients Market – By Formulation

• Dry

o Tablets

o Capsules

• Liquid

• Other Formulations

Global Nutraceutical Excipients Market – By Functionality Application

• Taste Masking

• Stabilizers

• Modified-Release

• Solubility & Bioavailability

• Others

Global Nutraceutical Excipients Market – By End Product

• Protein & Amino Acids

• Omega-3 Fatty Acids

• Vitamins

• Minerals

• Prebiotics

• Probiotics

• Other End Products

Global Nutraceutical Excipients Market – By Region

North America-

• The US

• Canada

• Mexico

Europe-

• Germany

• The UK

• France

• Italy

• Spain

• Rest of Europe

Asia-Pacific-

• China

• Japan

• India

• South Korea

• Southeast Asia

• Rest of Asia Pacific

Latin America-

• Brazil

• Argentina

• Rest of Latin America

Middle East & Africa-

• GCC Countries

• South Africa

• Rest of the Middle East and Africa

Empower Your Decision-Making with 180 Pages Full Report @ https://www.insightaceanalytic.com/buy-report/2741

About Us:

InsightAce Analytic is a market research and consulting firm that enables clients to make strategic decisions. Our qualitative and quantitative market intelligence solutions inform the need for market and competitive intelligence to expand businesses. We help clients gain competitive advantage by identifying untapped markets, exploring new and competing technologies, segmenting potential markets and repositioning products. Our expertise is in providing syndicated and custom market intelligence reports with an in-depth analysis with key market insights in a timely and cost-effective manner.

Contact us:

InsightAce Analytic Pvt. Ltd.

Visit: www.insightaceanalytic.com

Tel : +1 551 226 6109

Asia: +91 79 72967118

info@insightaceanalytic.com

This release was published on openPR.


Source link

2 12, 2024

Dogecoin Price Prediction: Analysts Forecast DOGE Santa Rally

By |2024-12-02T09:48:35+02:00December 2, 2024|Crypto News, News|0 Comments

Analysts and technical indicators point to a potential Dogecoin Santa rally this December, as the holiday season approaches and the bullish mood in the crypto market gains steam.

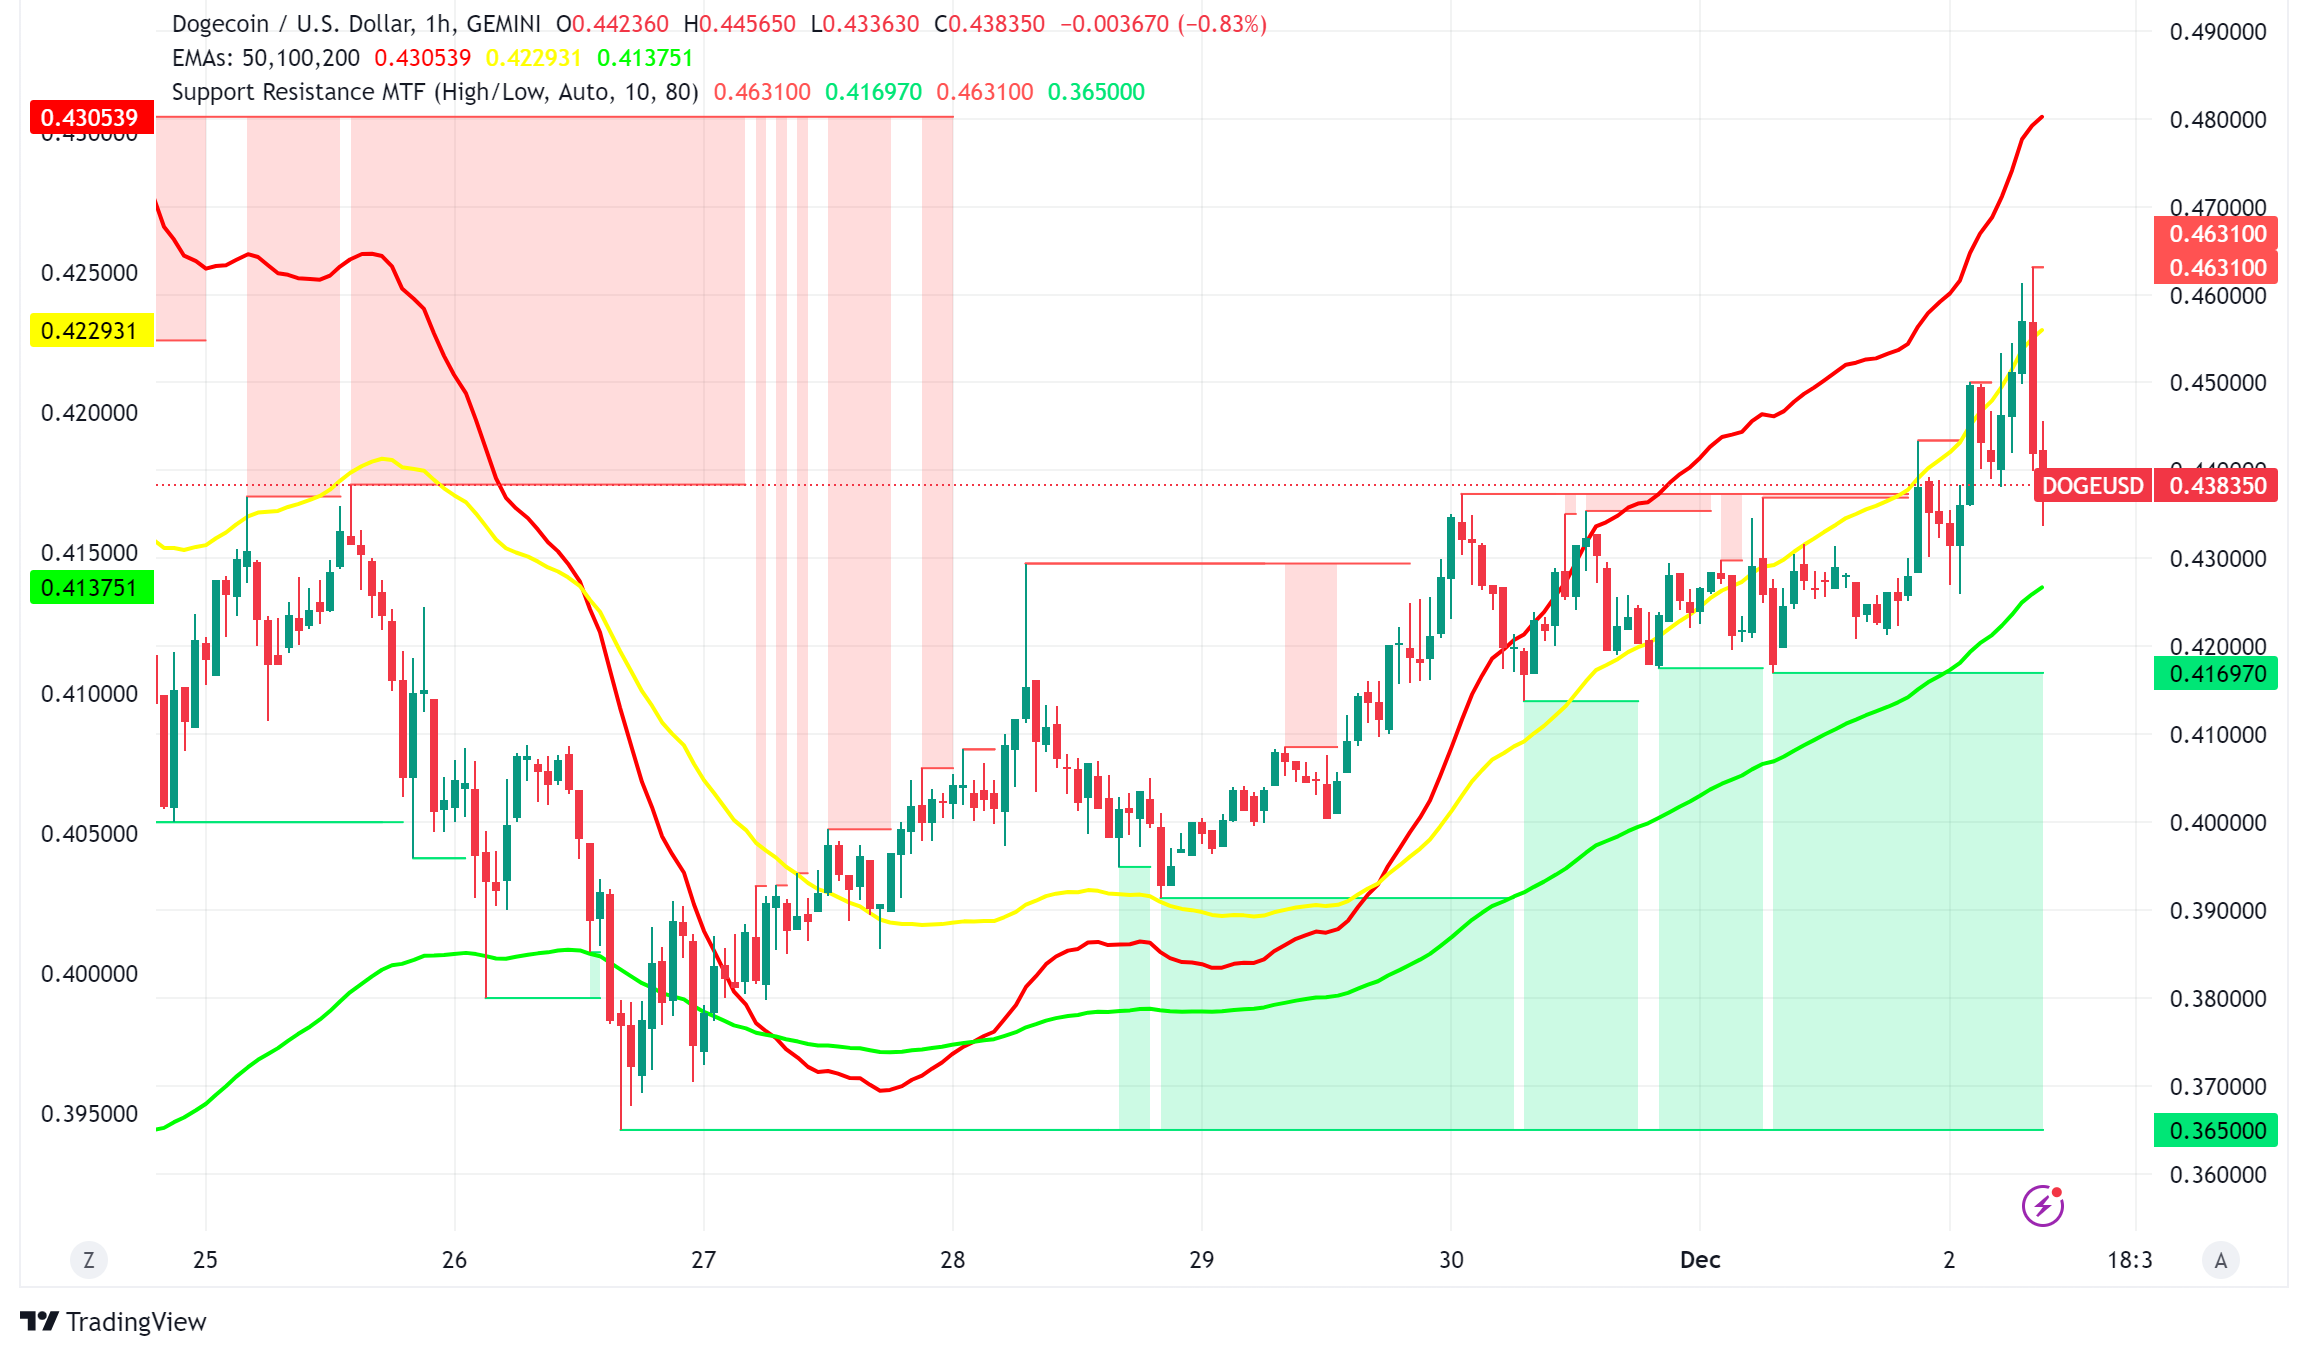
As of this writing, Dogecoin DOGE/USD is trading at about $0.44, having recently gained 10.5% every two weeks and an astounding 139.0% per month. There is still a lot of possibility for growth as the token is still 40% below its peak of $0.73.

Dogecoin’s Historical Performance and Santa Rally Potential

The December performance of Dogecoin shows an intriguing pattern of volatility and promise. CryptoRank’s historical data reveals impressive December performances, such as a phenomenal 337.5% gain in 2017 and more subdued rallies of 32.4% in 2020 and 7.87% in 2018. Although December has not always been a good month—2022 saw a steep 34.7% drop—the prospect of a “Santa Claus rally” is always alluring to investors.

With a 76% historical recurrence probability, the Santa Claus rally phenomenon—typically seen in financial markets—seems especially intriguing for Dogecoin this year. With a remarkable 161.5% growth in November and a current price of $0.42, the meme coin has already shown a lot of momentum.

DOGE Whale Activity and Market Dynamics

Significant whale investor interest and robust network activity are bolstering the positive sentiment. In just two weeks, whale investors have amassed approximately 550 million DOGE, or $214.5 million, while daily active network addresses have surpassed 1.33 million.

Dogecoin Price Prediction and Technical Analysis

DOGE/USD


A number of analysts are expressing optimism over Dogecoin. Bitcoin According to Scofield, the token is gaining traction for a possible bull run that might propel DOGE to $3, a daring prediction that would necessitate a 624% increase in price from its current level.

Additionally encouraging are technical signs. The MACD averages showed a Golden Cross pattern, which Krisspax described as a bullish indication of an upward movement to $1. More ambitious goals were also predicted by another expert, Ali Martinez, with some estimates going as high as $11 or even $18 per coin.

Correlation between Bitcoin and Possible Outperformance

It’s interesting to note that some analysts, such as Ali Martinez, believe Dogecoin might surpass Bitcoin by an astounding 2,400%. The bullish flag formation on DOGE’s monthly price chart, which indicates the possibility of significant gains versus the top cryptocurrency, is the basis for this prediction.


Source link

2 12, 2024

CAD/JPY Forecast Today 29/11: Stabilizes Near 107.50 (Video)

By |2024-12-02T07:51:09+02:00December 2, 2024|Forex News, News|0 Comments

  • The US dollar rallied just a bit during the course of the trading session on Thursday as we are seeing a little lack of liquidity late in the day as it is Thanksgiving in the United States.
  • I think you’ve got a situation that the market is simply just a bit oversold we’ve seen the Japanese yen give up some of its gains in multiple pairs right now including against the Canadian dollar.

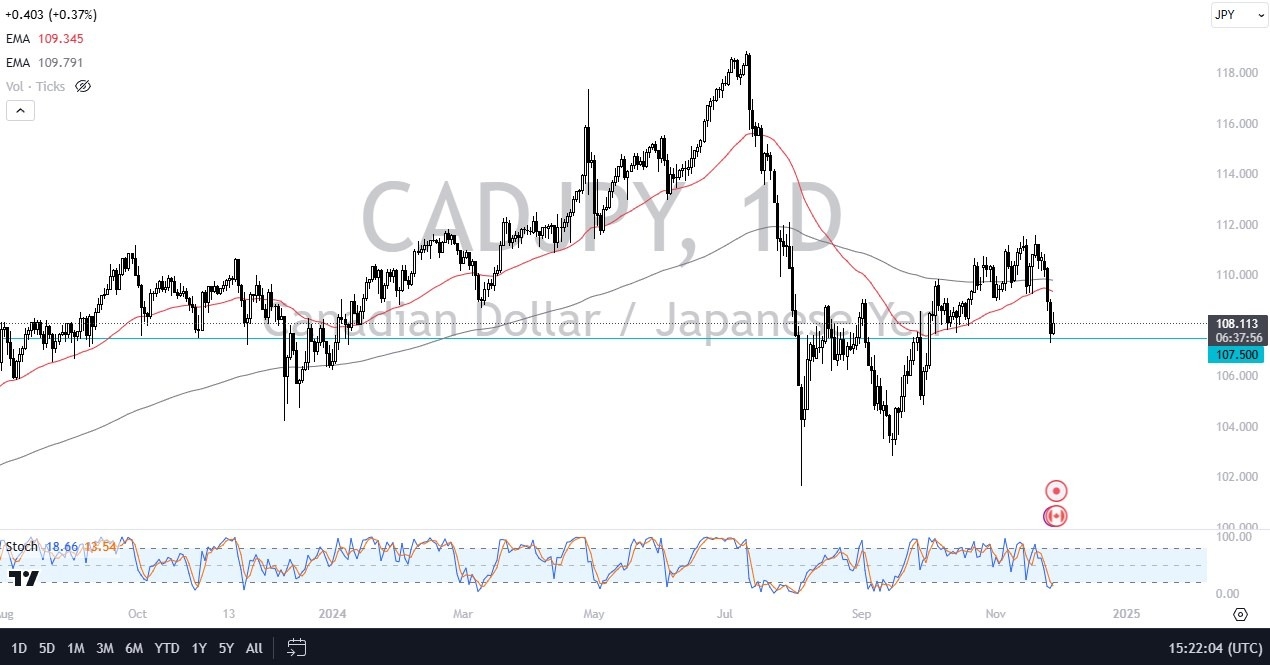
The 107.50 yen level is an area that I think a lot of people will be paying close attention to. Although I don’t think it’s a massive support level, I do think it’s one that has a little bit of history. If we can break higher from here and clear the 50 day EMA near the 109.50 yen level, then it opens up a move to the 111.50 yen level.

This CAD/JPY pair will more likely than not end up being a situation where it’s probably going to be more about the yen than anything else. Pay attention to how the Japanese yen is behaving against multiple other currencies, and you’ll probably get the direction of this pair correct. If we were to break down below the 107 point volume zero yen level, then it’s possible that we could see a steeper decline, perhaps all the way down to 104 yen.

If This Happens, the Yen Will Be The Cause

That would accompany other yen related pairs falling. It wouldn’t just be this one. So again, I think this is more about the Japanese yen than it is the Canadian dollar. Although we do have Canadian GDP coming out on Friday that could change things. But recently all yen related pairs have all moved in the same manner and in the same type of momentum. And I think that continues to be the case going into the future.

Want to trade our daily forex analysis and predictions? Here’s a list of forex brokers in Japan to check out. 

Source link

2 12, 2024

BTC at $97K, XRP Jumps 28%, HBAR Surges 44%

By |2024-12-02T07:48:02+02:00December 2, 2024|Crypto News, News|0 Comments

Today’s crypto prices showcase a strong bullish trend, with Bitcoin (BTC) maintaining a trading range of $95K-$99K over the past week. XRP recorded an impressive 28% surge in the last 24 hours, while Hedera (HBAR) led the market with a 44% price jump, making it the top gainer. Kaia (KAIA) price followed closely, registering a 40% increase in its price, highlighting a wave of positive momentum across altcoins.

The global crypto market value rose over 3%, reaching $3.49 trillion, while trading volume saw a 10% boost, hitting $170 billion. The Fear and Greed Index now stands at 82, reflecting extreme greed as investors continue to show strong interest. Here’s a quick look at the top cryptocurrencies by market cap and their price movements today, December 2.

Crypto Prices Today: BTC, ETH, SOL, and XRP

Today’s crypto prices highlight XRP as the top gainer among the top 10 cryptocurrencies by market cap, with a 28% surge in the past 24 hours. Bitcoin (BTC) continues to trade within the $95K-$99K range, attempting to break the $100K resistance. Meanwhile, Ethereum (ETH) and Solana (SOL) show modest gains, reflecting a stable yet optimistic market trend.

Bitcoin Price Today

Bitcoin (BTC) price is trading at $97,500, marking a 2% jump in the last 24 hours. The 24-hour low and high are $96,253 and $98,152, respectively. BTC’s market cap is $1.93 trillion, with a trading volume of $37 billion. However, Bitcoin’s market dominance has dipped to 55.40%, reflecting a slight shift in market dynamics.

Ethereum Price Today

Ethereum (ETH) price is trading at $3,751, recording a 2% jump in the last 24 hours. Its 24-hour low and high are $3,679 and $3,761, respectively. With a market cap of $452 billion and a trading volume of $27 billion, Ethereum remains the second most-valued cryptocurrency by market cap. ETH’s market dominance currently stands at 13%.

XRP Price Today

XRP has ascended to become the third-largest cryptocurrency by market cap, surpassing Tether and Solana. It is currently trading at $2.40, reflecting a 28% jump in the last 24 hours. The 24-hour low and high are $1.85 and $2.49, respectively. At press time, XRP’s market cap stands at $137 billion, supported by significant 24-hour trading volume. XRP’s market dominance has increased to 4%, highlighting its growing influence in the crypto market.

Solana Price Today

The crypto prices today show Solana (SOL) trading at $234, down 1% in the last 24 hours. Its 24-hour low and high are $233 and $239, respectively. Solana has been fluctuating between $230 and $260 for the past 15 days. With a market cap of $111 billion, it has slipped to the 5th position among the top 10 cryptocurrencies by market cap. Its 24-hour trading volume is $3.91 billion, and its market dominance stands at 3.19%.

Meme Crypto Prices Today

The crypto prices today show strong bullish momentum in the meme coin market. Dogecoin (DOGE) price is trading at $0.45, marking an 8% increase, with a 24-hour low and high of $0.42 and $0.46, respectively. Similarly, Shiba Inu (SHIB) price is trading at $0.00003108, also reflecting positive price movement.

Other notable meme coins like PEPE, BONK, and WIF have shown gains ranging from 3% to 8% in the past 24 hours. This upward trend indicates a renewed interest in meme coins, as investors continue to explore these cryptocurrencies for potential gains.

Top Crypto Gainer Prices Today

Hedera

Hedera (HBAR) became the top gainer in the last 24 hours, with an impressive 44% increase. HBAR is currently trading at $0.24, with a 24-hour low and high of $0.16 and $0.24, respectively.

CoinGape analysts have projected a potential 192% rally for Hedera, indicating strong bullish expectations for the cryptocurrency. This projected growth reflects growing confidence in Hedera’s future performance in the market.

Kaia

Kaia (KAIA) price became the second top gainer in the past 24 hours, with a significant 40% increase. It is currently trading at $0.28, with a 24-hour low and high of $0.20 and $0.29, respectively. This strong performance highlights growing interest and potential for Kaia in the crypto market.

Top Crypto Loser Prices Today

Core

CORE price is trading at $1.57, reflecting a 12% drop in price in the last 24 hours. Its 24-hour low and high are $1.55 and $1.79, respectively, indicating some fluctuation during the period.

Ethena

Ethena (ENA) price is trading at $0.82, showing a 6% drop over the last 24 hours. Its 24-hour low and high are $0.80 and $0.87, respectively, indicating some volatility during this period.

The crypto prices today show a bearish trend in the hourly chart of Bitcoin (BTC), with a 0.52% drop in price. Major altcoins, except XRP, are also reflecting similar behavior, following BTC’s decline. This overall market trend highlights a short-term correction, even as some coins like XRP continue their upward momentum.

✓ Share:

Coingape Staff

CoinGape comprises an experienced team of native content writers and editors working round the clock to cover news globally and present news as a fact rather than an opinion. CoinGape writers and reporters contributed to this article.

Disclaimer: The presented content may include the personal opinion of the author and is subject to market condition. Do your market research before investing in cryptocurrencies. The author or the publication does not hold any responsibility for your personal financial loss.


Source link

2 12, 2024

Giá cà phê tăng nhẹ

By |2024-12-02T07:01:33+02:00December 2, 2024|Forex News, News|0 Comments


Giá cà phê hôm nay ngày December 1, 2024 trên thị trường world, at 4:30 am updated on the Vietnam Commodity Exchange MXV (world coffee prices are continuously updated by MXV, matching with world exchanges, the only channel in Vietnam that continuously updates and links with world exchanges). Today’s online coffee prices of the three main coffee futures exchanges ICE Futures Europe, ICE Futures US and B3 Brazil are continuously updated by Y5Cafe during the trading hours of the exchange, updated as follows:

Kết thúc phiên giao dịch, giá cà phê Robusta trên sàn London lúc 4h30 ngày December 1, 2024 tiếp tục giảm ở phiên thứ 2 trong tuần, mức giảm sâu từ 142-156 USD/tấn, dao động từ 5228- 5409 USD/tấn. Cụ thể, kỳ hạn giao hàng tháng January 2025 là 5.409 USD/tấn (giảm 156 USD/tấn); kỳ hạn giao hàng tháng March 2025 là 5.377 USD/tấn (giảm 151 USD/tấn); kỳ hạn giao hàng tháng May 2025 là 5.310 USD/tấn (giảm 144 USD/tấn) và kỳ hạn giao hàng tháng July 2025 là 5.228 USD/tấn (giảm 142 USD/tấn).

Tương tự, giá sàn giao dịch cà phê Arabica New York ngày November 30, 2024 cũng giảm, kết thúc phiên giao dịch trước đó giá cà phê trên sàn New York giảm ở mức từ 4,40- 5 cent/lb. Cụ thể, kỳ hạn giao hàng tháng March 2025 là 318.05 cent/lb (giảm 5 cent/lb); kỳ giao hàng tháng May 2025 là 315.50 cent/lb (giảm 5,20 cent/lb); kỳ giao hàng tháng July 2025 là 310.85 cent/lb (giảm 4,85 cent/lb) và kỳ giao hàng tháng September 2025 là 305,80 cent/lb (giảm 4,40 cent/lb).

Kết thúc phiên giao dịch, sáng ngày December 1, 2024, giá cà phê Arabica Brazil tăng, giảm hỗn hợp qua các kỳ hạn giao hàng, dao động từ 386,85 – 389,05 USD/tấn. Cụ thể, kỳ hạn giao hàng tháng December 2024 là 389,05 USD/tấn (giảm 14,85 USD/tấn); kỳ giao hàng tháng March 2025 là 393,70USD/tấn (tăng 1,20 USD/tấn); kỳ giao hàng tháng May 2025 là 393,15 USD/tấn (giảm 6,90 USD/tấn) và giao hàng tháng July 2025 là 386,85 USD/tấn (giảm 6,40 USD/tấn).

Dự báo giá cà phê ngày mai December 2, 2024 sẽ tăng nhẹ

Giá cà phê trong nước được cập nhật lúc 4h30 phút ngày December 1, 2024 như sau, giá cà phê trong nước quay đầu giảm, mức giảm nhẹ 1000 đồng/kg. Hiện giá thu mua trung bình tại các tỉnh Tây Nguyên là 130.200 đồng/kg.

Specifically, the coffee purchase price in the province Gia Lai ở mức 130.000 đồng/kg (giảm 1.000 đồng/kg so với phiên giao dịch trước); Tương tự, tại tỉnh Dak Nong cà phê cũng giảm 1.000 đồng/kg với giá 130.500 đồng/kg.

Price of green coffee beans (coffee beans, fresh coffee beans) in the province Lam Dong In districts such as Bao Loc, Di Linh, Lam Ha, coffee is purchased at 129.500 VND/kg.

Giá cà phê hôm nay (ngày 1/12) tại tỉnh Dak LakIn Cu M’gar district, coffee is purchased at 130.000 VND/kg, and in Ea H’leo district, Buon Ho town, it is purchased at 129.900 VND/kg.

Theo dự báo, giá cà phê ngày mai December 2, 2024 sẽ tăng nhẹ trở lại. Nguyên nhân được cho rằng do thời tiết không thuận lợi, thất thường tại hai nước sản xuất cà phê lớn nhất thế giới là Brazil và Việt Nam, mưa lớn ở các nước Nam Mỹ… Tại thị trường Việt Nam, mặc dù đang mùa thu hoạch rộ, giá cà phê đang neo ở mức cao nhưng nhiều nông dân chỉ bán lượng ít đủ chi phí công chăm sóc, thu hoạch, tưới tiêu, bón phân… còn đa số giữ lại vì mong chờ giá còn tăng.

Các chuyên gia cho rằng, hiện nay nguồn cung cà phê trên thị trường thế giới đang thiếu hụt và lượng cà phê tồn kho trên các sàn giao dịch quốc tế không nhiều. Điển hình, thời gian qua, giá cà phê Arabica trên sàn New York tăng liên tục. Vì thị trường này lo ngại sự thiếu hụt nguồn cung từ Brazil, do tình trạng khô hạn kéo dài ở nhiều vùng trồng.

Theo tính toán của các nông dân trồng cà phê ở Tây Nguyên Việt Nam, trung bình sản xuất ra mỗi kg cà phê có giá khoảng 30.000 – 40.000 đồng. Tuy nhiên, hiện nay giá bán đã lên trên 130.000 đồng/kg. Như vậy, người nông dân có lãi từ 2 – 3 lần chi phí đầu tư. Do đó, hiện nay nhu cầu mua đất mở rộng diện tích cà phê giúp thị trường đất rẫy không ngừng tăng giá.

Sources: https://congthuong.vn/du-bao-gia-ca-phe-ngay-mai-2122024-gia-ca-phe-tang-nhe-361861.html


Source link

2 12, 2024

Ripple, Ethereum & Stellar — Asian Wrap 02 December

By |2024-12-02T05:46:39+02:00December 2, 2024|Crypto News, News|0 Comments

Ripple’s XRP rallied near the $2 mark on Friday after rumors of New York regulators approving the company’s RLUSD stablecoin surfaced. The growing demand for an XRP exchange-traded fund (ETF) could also accelerate its launch in 2025.

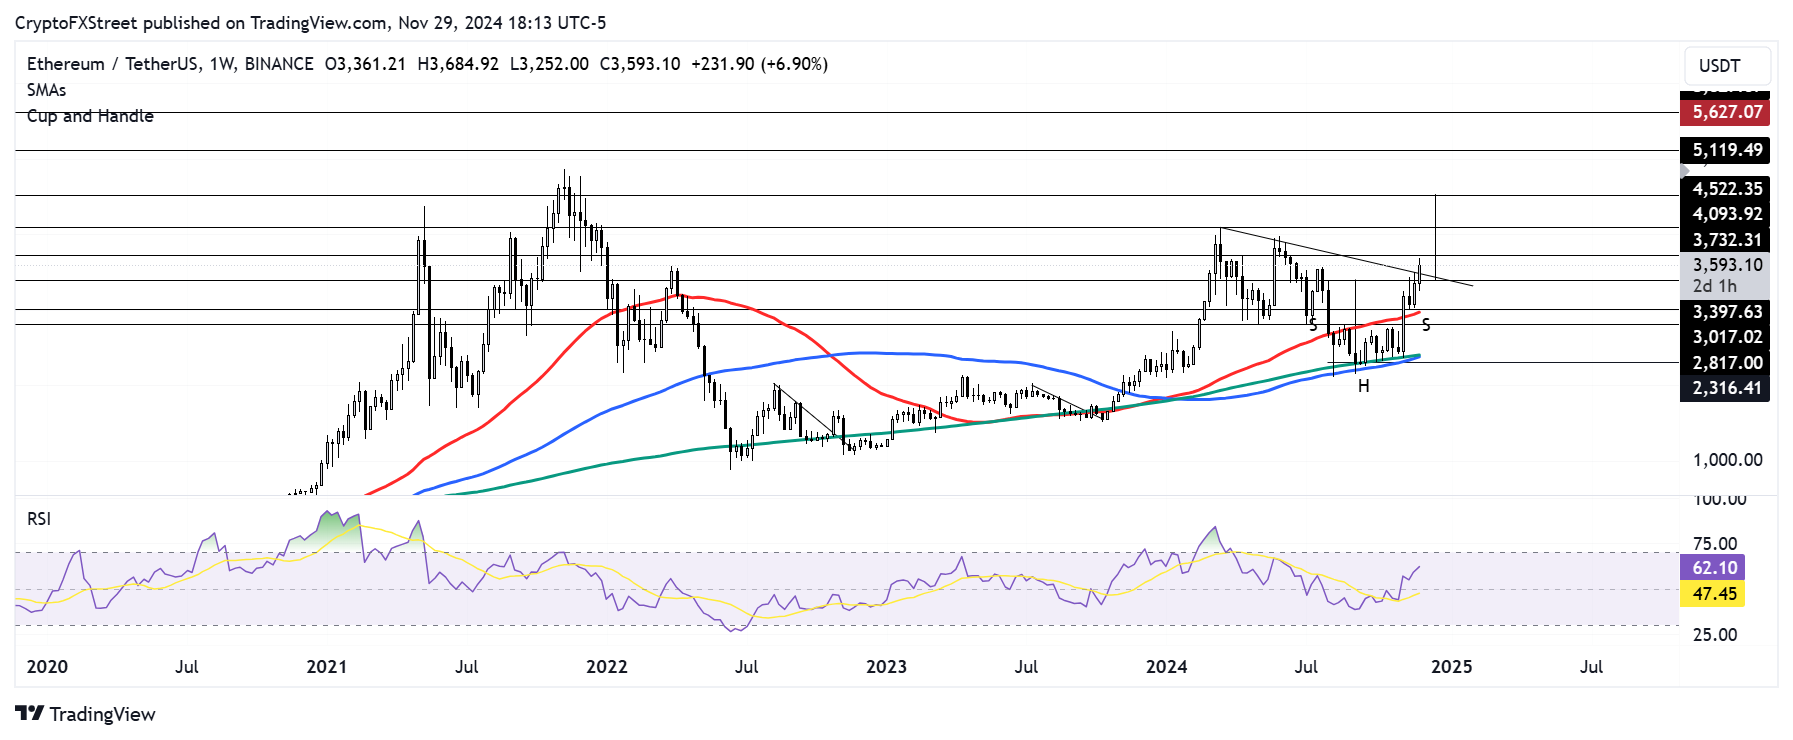
Ethereum (ETH) is trading near the $3,600 level on Friday and could stage a rally to test its yearly high resistance of $4,093. The rally is fueled by ETH Chicago Mercantile Exchange (CME) open interest growth and a rise in USDT supply on the Main chain.

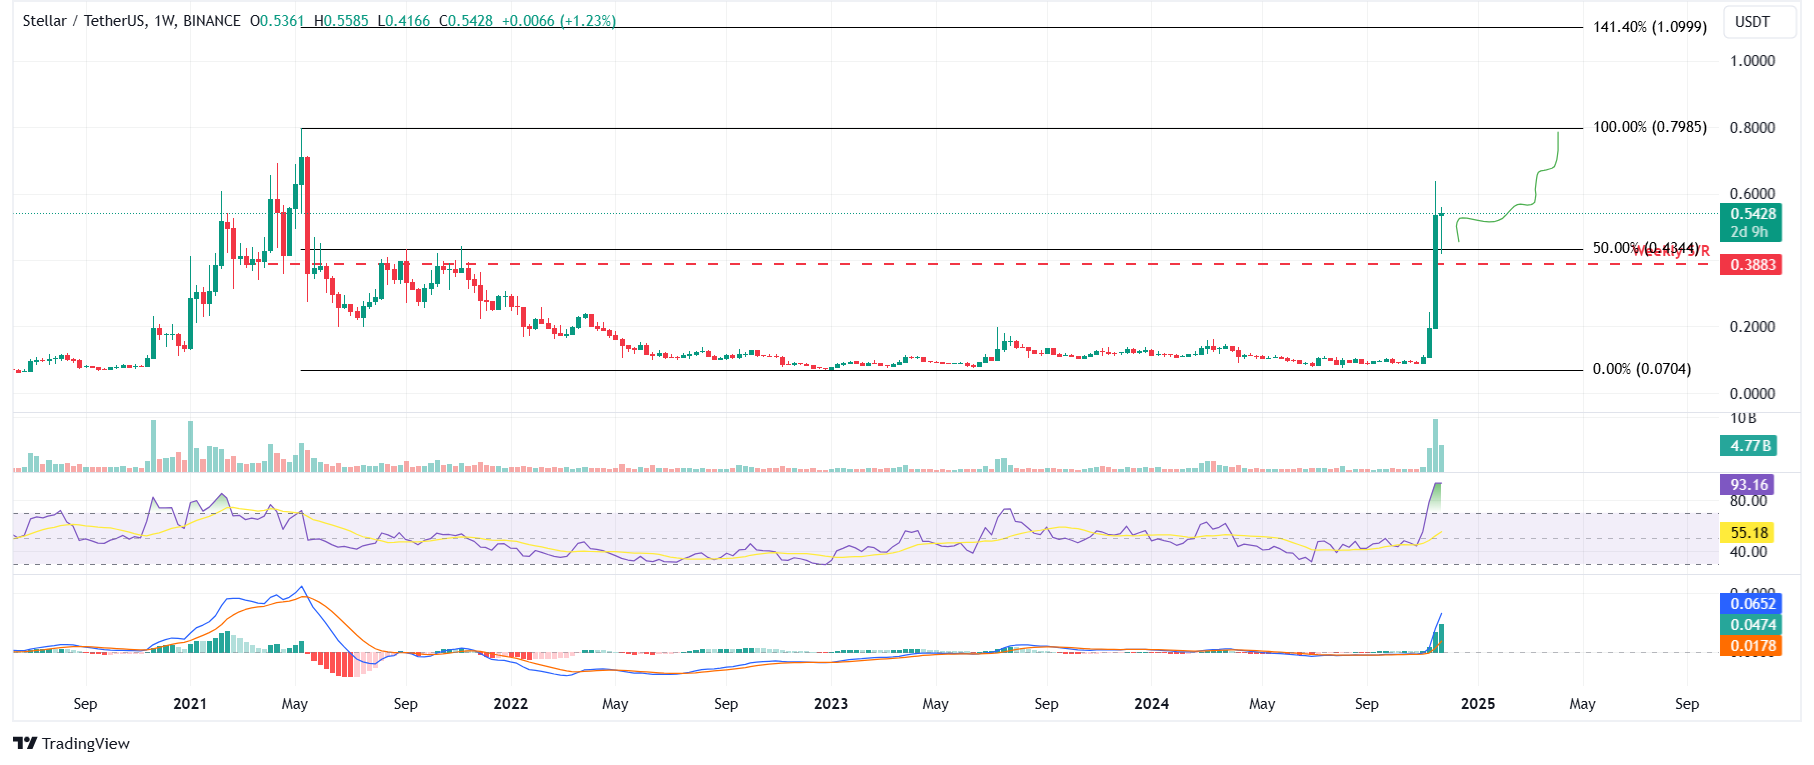
Stellar (XLM) experienced a pullback in the first half of the week but recovered in the second half and is trading around $0.54 on Friday, after rallying more than 170% and reaching levels not seen in over three years in the previous week. This bullish outlook is further supported by rising Open Interest (OI) and Total Value Locked (TVL) to record levels, indicating a further rally.


Source link

2 12, 2024

Dogecoin Price Prediction: DOGE to Climb 700%, Solana (SOL) Forecasted for 1,500%, While Dogen Targets a 5,000% Rally This Quarter

By |2024-12-02T03:45:39+02:00December 2, 2024|Crypto News, News|0 Comments

Expectations are mounting for a thrilling quarter in the cryptocurrency market. Some forecasts suggest Dogecoin could climb by up to 700%, Solana might surge by 1,500%, and Dogen is aiming for a staggering 5,000% rally. This article explores these ambitious predictions and the potential catalysts behind them.

DOGEN Rejoys Big Moment: Trump’s Victory Will Send It to the Moon

Guess who is going to join Elon Musk’s moon mission soon?

DOGEN, the boldest meme coin for alpha males, is gearing up for take-off as Trump’s victory in the recent US election has the entire market euphoric about the prospects of cryptocurrencies, especially meme coins.

Donald and Elon are Best Buddies for Meme Coins

Donald Trump’s love for crypto is no secret — he’s promised to make the U.S. the global crypto leader in his campaign. And joining him is none other than Elon Musk, the ultimate Dogecoin (DOGE) fan who’s backed the crypto movement and even aligned with Republicans earlier this year. With these two icons fueling the fire, meme coins are set for a wild ride!

DOGE Soars 130% in Just One Week! DOGEN will be the Next Star with 500% Surge

Following the US election results, Dogecoin (DOGE) has been on a steady rise: from $0.15 to $0.39 in just one week.

DOGEN follows the same upward trend, starting at $0.0003 and now trading at $0.0009, a staggering 200% leap.

With a total of 13 presale stages, DOGEN is set to rise to $0.0019 by the token generation event (TGE), which represents a 500% increase from its initial price.

Like it DOGE style? Grab Some DOGEN Now and Watch It Soars 500%

Dogecoin Price Prediction: DOGE to Climb 700%, Solana (SOL) Forecasted for 1,500%, While Dogen Targets a 5,000% Rally This Quarter

A Community-Driven Token with Referral Program

The backbone of DOGEN is its strong and engaged community—an energetic group of investors ready to seize the next big opportunity. With over $2,000,000 already raised, DOGEN has proven its appeal among crypto enthusiasts.

Adding to its allure is DOGEN’s unique multi-level referral program, which rewards community participation:

  • 7% in USDT from direct referrals
  • 2% from second-tier referrals
  • 1% from third-tier referrals

Wanna Surf this Bull Wave? Join the DOGEN Army!

Step into the winner’s circle with DOGEN—where elite investors get access to exclusive campaigns, epic perks, and top-tier deals.

Live the high life you deserve: luxury cars, stacks of cash, and unforgettable experiences await those who go all-in on DOGEN. Don’t settle for ordinary when you can have it all!

Flex Hard, Earn Big – DOGEN is Your Power Move!

Dogecoin: From Internet Meme to Major Cryptocurrency

Dogecoin (DOGE) is a cryptocurrency that began in 2013 as a playful alternative to more traditional coins. It uses the image of a Shiba Inu dog from a popular internet meme as its logo. Unlike Bitcoin, Dogecoin has no maximum supply and adds 10,000 new coins every minute, making it plentiful. In 2021, Dogecoin’s value surged, placing it among the top cryptocurrencies by market capitalization. This rise was driven by social media influence and support from figures like Elon Musk. The coin’s strong community and widespread recognition suggest potential for growth. Its attractiveness in the current market cycle depends on adoption rates and developments in the crypto market.

Solana (SOL): A Scalable Blockchain Platform for Decentralized Applications

Solana is a blockchain platform designed for scalability and speed, providing a foundation for decentralized applications alongside competitors like Ethereum and Cardano. Its native cryptocurrency, SOL, plays a central role in the ecosystem by facilitating transactions, running custom programs, and rewarding network participants. Solana’s architecture focuses on handling high transaction volumes without using sharding or second-layer solutions, making it attractive for developers who require fast and efficient networks. The SOL coin holds value as it underpins the operation of the platform and grants access to various projects on Solana. In the current market cycle, Solana’s emphasis on scalability and flexible development options highlights its potential in the blockchain space.

Conclusion

While DOGE and SOL show less short-term potential, DOGEN stands out. Designed for those seeking luxury and success, DOGEN expects 700% growth by presale’s end, with potential for thousand-fold returns this altcoin season. Following successful tokens like BONK, WIF, and Popcat, DOGEN builds a community of market leaders, offering real benefits and exclusive perks for early adopters.

Site: https://dogen.meme/

Twitter: https://x.com/dogenmeme

Telegram: https://t.me/Dogen_Portal


Disclaimer: This is a paid release. The statements, views and opinions expressed in this column are solely those of the content provider and do not necessarily represent those of Bitcoinist. Bitcoinist does not guarantee the accuracy or timeliness of information available in such content. Do your research and invest at your own risk.

Source link

Go to Top