A new study may offer welcome news to both cocoa and green tea drinkers: Compounds in high-flavanol cocoa as well as in green tea offer protection to the body after a person eats fatty foods when stressed.
“We know that even just one isolated episode of mental stress can impact the elasticity of blood vessels, which can last for up to 90 minutes,” Catarina Rendeiro, assistant professor in nutritional sciences at the University of Birmingham in the U.K., said via email to Fox News Digital. She is the lead author of the study.
When people are stressed, she said, they tend to crave foods with a higher fat content.
“We showed previously that the combination of stress and fatty foods prolongs the negative impact of stress in the blood vessels,” she said.
Her latest study, however, shows that drinking certain beverages can combat the negative effects.
The compounds in high-flavanol cocoa as well as in green tea can protect the body from the effects of consuming fatty foods, according to a new study. (iStock)
“If you combine the fatty food with a drink rich in flavanols, it prevents the effect of stress and fat combined,” she said — which “can be used as a strategy to mitigate some of the impact of poorer food choices on blood vessels.”
To test this theory, Rendeiro and her colleagues fed a group of healthy adults a breakfast of “two butter croissants” with 10 grams of salted butter, 1.5 slices of cheddar cheese and 250 milliliters of whole milk. Rosalind Baynham, another author on the study, shared those details in a news release published by the University of Birmingham.
The groups were given either a high-flavanol cocoa or a low-flavanol cocoa drink as well, Baynham said.
A flavanol, Baynham said, is “a type of compound that occurs in different fruits, vegetables, tea and nuts — including berries and unprocessed cocoa.”
These compounds, she said in the release, have known cardiovascular health benefits.
After eating their breakfasts and having a brief rest period, the participants were given a mental math test, which increased in speed over the duration of eight minutes. Each time they got a wrong answer, they were notified, the release said.
The participants in a new study were given a breakfast of croissants plus a cocoa drink — then proceeded to take a math test. (iStock)
The participants were monitored both during the rest period and during the math test.
“This stress task induced significant increases in heart rate and blood pressure, similar to the stress you may encounter in daily life,” the release said.
The study found that the group that consumed the low-flavanol drink had reduced vascular function for an hour and a half after the test was over.
However, “the findings showed that the cocoa drink high in flavanols was effective at preventing the decline in vascular function following stress and fat consumption,” according to the release.
The results, Rendeiro told Fox News Digital, “can help us make more informed decisions about what we eat and drink during stressful periods.”
Drinking high-flavanol cocoa drinks can prevent vascular function decline in stressful situations, according to a new study. (iStock )
Rendeiro also recommends high-quality, minimally processed cocoa powder.
In addition to lowering blood pressure, it appears that certain types of cocoa, according to a previous report in Healthline, have other properties that may reduce the risk of heart attack and stroke.
Flavanol-rich cocoa “improves the level of nitric oxide in your blood, which relaxes and dilates your arteries and blood vessels and improves blood flow,” the publication has noted.
While the U.K. participants were given cocoa drinks as their flavanol consumption during the study, it is not the only source of the compounds, Reindeiro said.
“The scientific community recommends a daily intake of 400 to 600 mg/day of flavanols, which can be achieved, for example, by consuming two cups of black or green tea or [having] a combination of berries, apples and high-quality, minimally processed cocoa,” she said.
Christine Rousselle is a lifestyle reporter with Fox News Digital.
The table below shows the percentage change of Euro (EUR) against listed major currencies today. Euro was the strongest against the British Pound.
USD
EUR
GBP
JPY
CAD
AUD
NZD
CHF
USD
0.23%
0.33%
-0.39%
-0.10%
0.05%
0.03%
-0.12%
EUR
-0.23%
0.11%
-0.57%
-0.32%
-0.19%
-0.18%
-0.35%
GBP
-0.33%
-0.11%
-0.68%
-0.43%
-0.29%
-0.29%
-0.44%
JPY
0.39%
0.57%
0.68%
0.28%
0.42%
0.40%
0.25%
CAD
0.10%
0.32%
0.43%
-0.28%
0.14%
0.13%
-0.02%
AUD
-0.05%
0.19%
0.29%
-0.42%
-0.14%
-0.01%
-0.16%
NZD
-0.03%
0.18%
0.29%
-0.40%
-0.13%
0.00%
-0.15%
CHF
0.12%
0.35%
0.44%
-0.25%
0.02%
0.16%
0.15%
The heat map shows percentage changes of major currencies against each other. The base currency is picked from the left column, while the quote currency is picked from the top row. For example, if you pick the Euro from the left column and move along the horizontal line to the US Dollar, the percentage change displayed in the box will represent EUR (base)/USD (quote).
Dogecoin (DOGE) might hit a new all-time high if it replicates the 2021 performance that saw it surge by 18,340% in five months.
Dogecoin recently caught the attention of the broader crypto market following its tremendous rise above the $0.4 mark. Specifically, DOGE’s price spiked by 156% in one week, soaring from around $0.17 to $0.4359 between November 6 and 12.
The massive surge strengthened investors’ confidence in DOGE, as they speculate that the asset might repeat its 2021 rally in this bull run.
Dogecoin Price If It Repeats 2021 Rally
For context, Dogecoin stunned investors in 2021, soaring from a modest $0.0040 to an all-time high (ATH) of $0.7376 on May 8. This represents a staggering increase of 18,340% within the first five months of 2021.
Amid Dogecoin’s recent rally, many investors are wondering how much DOGE would be worth if it replicates its 2021 performance this cycle. Achieving a similar growth rate of 18,340% before the end of this cycle would see the price of DOGE surge to an unprecedented level.
If Dogecoin is able to surge similarly to 2021 and repeat a potential surge of 18,340% from the current level, it will take its price to a whopping $69.03, marking a new ATH record for DOGE. This would positively impact Dogecoin’s market cap, boosting it to $10.12 trillion from the current $54.88 billion, potentially making DOGE the most valuable cryptocurrency in the world.
At a price of $69.03, a portfolio of 14,486.5 DOGE, currently worth about $5,424, would be valued at $1 million.
Key Factors to Consider
While it remains uncertain whether Dogecoin will experience a surge of 18,340% as it did in 2021, it is important to note that three major factors contributed to DOGE’s jaw-dropping rally three years ago.
Elon Musk Effect
At the top of the list is the Elon Musk effect. Musk played a significant role in Dogecoin’s 2021 rise. His endorsement of the token on X paved the way for the 18,340% rally.
Interestingly, Musk still has the capacity to drive Dogecoin’s price, as seen over the past week when DOGE surged by 156% due to his continuous mention of D.O.G.E (Department of Government Efficiency) on X. It is worth mentioning that U.S. President-Elect Donald Trump recently appointed Musk to head the new federal agency.
Massive Retail Interest
Elon Musk’s endorsement of Dogecoin in 2021 attracted the interest of retail investors, leading to an 18,340% rally. As Musk continues to mention the D.O.G.E agency on X, most retail investors would likely see it as an opportunity to acquire DOGE, potentially positioning the asset for a repeat of its 2021 rally.
Bull Market
Another factor that contributed to Dogecoin’s 18,340% rise in 2021 was the timing of the surge, which coincided with the 2021 bull market.
At the time, several cryptocurrencies, including Ethereum (ETH) and Cardano (ADA), reached new ATHs. Notably, DOGE also benefited from the bull market, leading to its surge to an ATH. Currently, the market is in the second phase of the bull run, which is expected to linger till next year.
DisClamier: This content is informational and should not be considered financial advice. The views expressed in this article may include the author’s personal opinions and do not reflect The Crypto Basic opinion. Readers are encouraged to do thorough research before making any investment decisions. The Crypto Basic is not responsible for any financial losses.
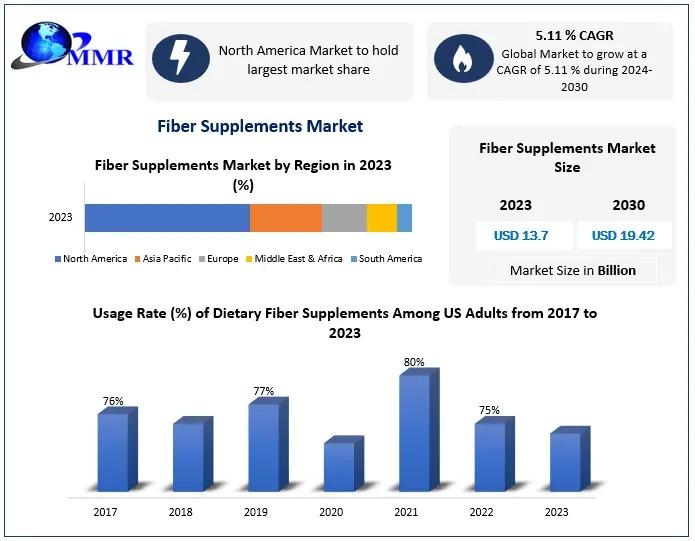
The fiber supplements market is experiencing significant growth, driven by increasing consumer awareness about the importance of dietary fiber in maintaining digestive health and overall wellness. These supplements, available in various forms such as powders, capsules, cater to diverse dietary preferences and needs. Rising incidences of lifestyle-related disorders, including obesity and gastrointestinal issues, are further fueling demand. Additionally, the growing trend of plant-based and functional foods has positioned fiber supplements as a convenient and effective solution for individuals seeking to meet their daily fiber requirements. Innovations in formulation, coupled with expanding distribution channels, are anticipated to propel the market forward in the coming years.
The Fiber Supplements Market Report provides a comprehensive analysis of industry trends, growth drivers, challenges, and opportunities. It covers market segmentation by product type, form, distribution channel, and region, offering a detailed understanding of key dynamics shaping the industry. The research methodology employed includes a blend of primary and secondary research techniques, ensuring accuracy and reliability. Primary research involves interviews with industry experts, stakeholders, and key players, while secondary research utilizes credible sources such as industry reports, company publications, and market databases. The report also incorporates market sizing, forecasts, competitive landscape analysis, and a review of regulatory factors, providing stakeholders with actionable insights to inform strategic decisions.
The Fiber Supplements Market exhibits diverse regional dynamics, with growth patterns varying across key geographic regions. North America, particularly the United States, leads the market due to high consumer awareness of health and wellness, alongside a strong preference for dietary supplements. Europe follows closely, driven by rising demand for natural and plant-based fiber solutions, especially in countries like Germany and the UK. In the Asia Pacific region, countries such as China and India are experiencing rapid market expansion, fueled by a growing focus on digestive health and increasing disposable incomes. Meanwhile, the Middle East and Africa are witnessing gradual market penetration, with increasing interest in fiber supplements as part of preventive healthcare. Latin America is also projected to see significant growth, particularly in Brazil, where changing lifestyles and dietary habits are boosting the adoption of fiber-enriched products. Each region presents unique opportunities and challenges, influenced by local health trends, dietary preferences, and regulatory frameworks.
Market Dynamics – Growth Drivers, Restraints, Opportunities, and Key Trends by region
Market Segmentation – A detailed analysis by segment with their sub-segments and Region
Competitive Landscape – Profiles of selected key players by region from a strategic perspective
Competitive landscape – Market Leaders, Market Followers, Regional player
Competitive benchmarking of key players by region
PESTLE Analysis
PORTER’s analysis
Value chain and supply chain analysis
Legal Aspects of business by region
Lucrative business opportunities with SWOT analysis
Recommendations
𝐂𝐨𝐧𝐭𝐚𝐜𝐭 𝐌𝐚𝐱𝐢𝐦𝐢𝐳𝐞 𝐌𝐚𝐫𝐤𝐞𝐭 𝐑𝐞𝐬𝐞𝐚𝐫𝐜𝐡:
MAXIMIZE MARKET RESEARCH PVT. LTD.
⮝ 3rd Floor, Navale IT park Phase 2,
Pune Banglore Highway, Narhe
Pune, Maharashtra 411041, India.
✆ +91 9607365656
🖂 sales@maximizemarketresearch.com
🌐 www.maximizemarketresearch.com
𝐀𝐛𝐨𝐮𝐭 𝐌𝐚𝐱𝐢𝐦𝐢𝐳𝐞 𝐌𝐚𝐫𝐤𝐞𝐭 𝐑𝐞𝐬𝐞𝐚𝐫𝐜𝐡:
A versatile market research and consulting firm, Maximize Market Research employs experts from several sectors. Medical device manufacturers, pharmaceutical companies, science and engineering, electronic components, industrial equipment, technology and communication, automobiles, chemical goods and substances, general merchandise, alcoholic beverages, personal care products, and automated systems are a few of the industries we cover. To name a few, we offer client impact studies, technical trend analysis, critical market research, competitive analysis, production and demand analysis, and market-verified industry estimations.
Putin warned the US of a lower threshold for a nuclear strike.
Economists expect UK inflation to increase by 2.2% in October.
The dollar remained steady after gaining over 1.6% last week.
The GBP/USD price analysis indicates a sudden rush to safe-haven assets that weakened the pound against the dollar. Meanwhile, the Trump trade kept the dollar near recent peaks as markets awaited economic data for clues on Fed rate cuts.
–Are you interested in learning more about Canadian forex brokers? Check our detailed guide-
There was some panic in the markets on Tuesday after Russian President Vladimir Putin warned the US of a lower threshold for a nuclear strike. This news came in response to Ukraine’s recent attack on Russia with US missiles. If Russia starts using nuclear power, it could escalate the war in Ukraine and impact the global economy.
After Putin’s warning, investors dumped risky assets like the pound and bought the yen and the dollar. Meanwhile, market participants awaited the UK inflation report due on Wednesday, which might give clues on future BoE policy moves. Economists expect inflation to increase by 2.2% after a 1.7% increase in the previous month.
Meanwhile, service inflation might ease further to 4.3%. Lower service inflation might rekindle bets for a rate cut at the December meeting. On the other hand, if inflation is higher than expected, the pound will rally as rate-cut bets drop.
Meanwhile, the dollar remained steady after gaining over 1.6% last week amid the Trump trade. The looming policy changes in the US have shifted the outlook for Fed rate cuts. At the same time, policymakers have assumed a more hawkish tone, boosting the greenback. There is an increasing likelihood that the Fed will pause in December.
GBP/USD key events today
There will be no key reports from the US or the UK. Therefore, traders will monitor developments in the Ukraine war.
GBP/USD technical price analysis: Downtrend continues after SMA retest
GBP/USD 4-hour chart
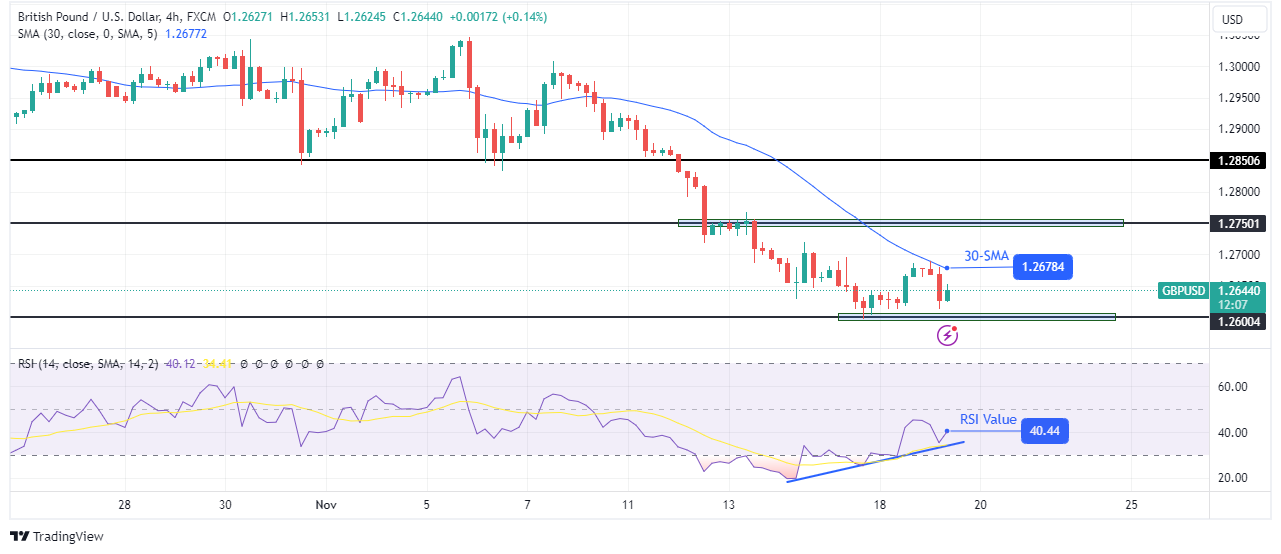
On the technical side, the GBP/USD price has bounced lower after retesting the 30-SMA resistance. After consolidation, bears took charge by breaching the 1.2850 key support level. Moreover, the price made a sharp swing below the SMA, indicating a steep downtrend.
–Are you interested in learning more about high leveraged brokers? Check our detailed guide-
At the same time, the RSI entered the oversold region, suggesting solid bearish momentum. However, it has made a bullish divergence that could lead to a deeper pullback or a reversal. On the other hand, if bearish momentum surges, the price will break below 1.2600.
Looking to trade forex now? Invest at eToro!
68% of retail investor accounts lose money when trading CFDs with this provider. You should consider whether you can afford to take the high risk of losing your money
Ripple (XRP) is one of the leading cryptocurrency tokens in the space that has recently garnered heavy attention. The token has recently claimed the coveted $1 mark, marking its ascent into the Web3 bullish realm. While certain predictions made by analysts suggest XRP claiming the $2 mark, here’s how high the token may surge before the end of 2024.
XRP Price Predictions: Analysts Take On High Can XRP Go?
Source – FXEmpire
Ripple is currently one of the leading cryptocurrencies to hold. The fact that XRP is trending on Google searches speaks volumes about its popularity in recent times.
Per Egrag Crypto, a notable crypto analyst, XRP has more in store for investors as it may soon break past the $1 price in the coming months. Per the analyst, the current price juncture is crucial for XRP as its current trading is in a psychological zone. The analyst dubbed the token current price pedestal as a “make or break” spot for XRP to trade in, as the trending maker momentum may either push XRP to claim the $2 mark or note a drop for the token to sit at $0.75.
#XRP: We Are in the Psychological Zone! ($2 or 0.75c): Right now, it’s make-or-break for #XRP! Either we fly high 📈 or face a major retest (0.75c) 📉. Let me break it down for you using key indicators on the weekly timeframe: 🛠 Indicators in Focus: 1⃣ SSMP Diagram. 2️⃣ Stock RSI. 3️⃣ RSI. 4️⃣ MAC📊 1) SSMP Diagram: ▶️Key Level: $0.75 is absolutely CRUCIAL. It was the pump zone before, but now it’s the level we must hold!. If $1 doesn’t hold strong 💪 with a weekly open and close above it, my next target shifts to $0.75.”
Similar to another notable cryptocurrency analyst, Dark Defender has also referred to XRP as a token in a blossoming phase. He shared how XRP will continue its momentum ahead, which may help it hit ambitious price highs soon.
“I expect the correction to last a few days. Not weeks or months. It will be too short. $XRP will continue the momentum. You might not believe this, and it might seem artificial, but it is not: We have a golden target of $13.085 (NFA), which became crystal clear yesterday. Strange, isn’t it? The melting process will continue.”
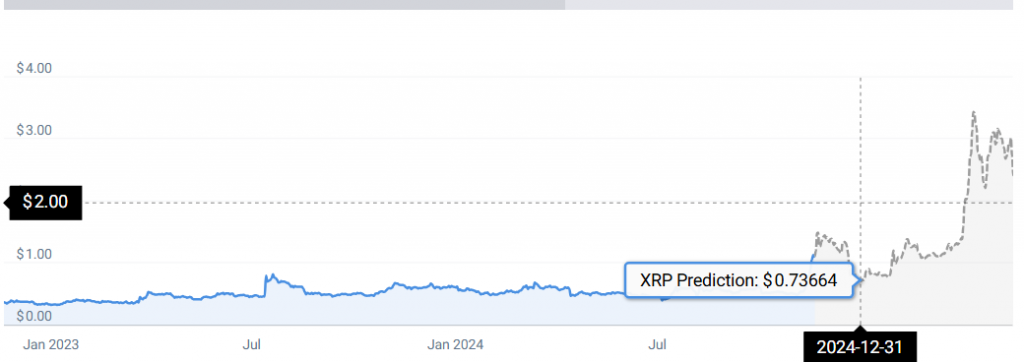
Per CoinCodex, the technical platform predicts XRP to hit the $0.73 mark, note a significant drop, otherwise dubbed a retest before surging to $2 in 2025.
Image: CoinCodex
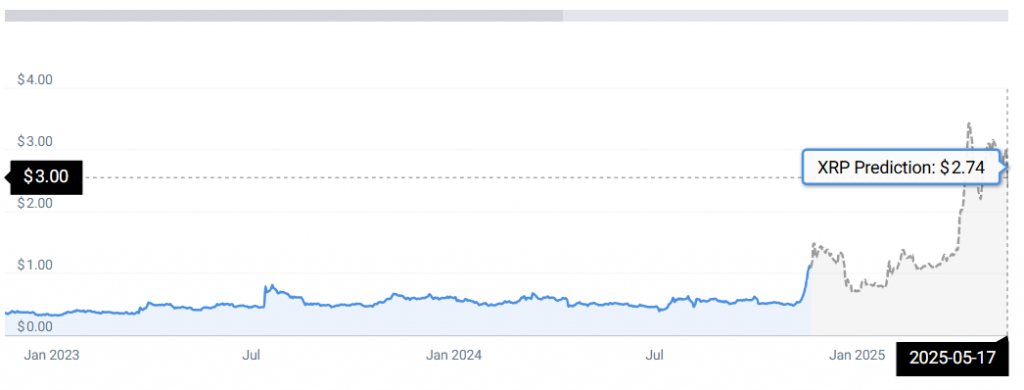
The portal also predicts the token to hit the $3 mark by April 2025 and ultimately trade around $2 by May 2025.
Image: CoinCodex
“According to our current XRP price prediction, the price of XRP is predicted to rise by 116.98% and reach $2.43 by May 18, 2025. Per our technical indicators, the current sentiment is bullish while the Fear & Greed Index is showing 83 (extreme greed). XRP recorded 19/30 (63%) green days with 28.24% price volatility over the last 30 days. Based on the XRP forecast, it’s now a good time to buy XRP.”
Rising concerns in the Russia-Ukraine crisis spark further gains in Gold .
Steady geopolitical tensions favour the flight-to-safety environment.
XAU/USD flirts with the $2,650 region prior to the $2,700 mark.
Persistent concerns in the geopolitical landscape encouraged market participants to increase their positions in the precious metal on turnaround Tuesday, a move that came in response to swelling effervescence in the Russia-Ukraine front and as a direct answer to bouts of demand for the safe haven universe.
Against that backdrop, prices of the troy ounce of the yellow metal advanced further north of the recently broken $2,600 mark, meeting immediate hurdle at the interim 55-day SMA in the $2,640 zone for the time being.
In addition, Gold’s rebound appears bolstered by a vacillating price action in the US Dollar (USD) as markets reassess the strength of the Trump-era rally. Additionally, the widespread loss of momentum in US Treasury yields across various maturities has also offered the metal further chances to recover.
It is worth noting that the resurgence of tensions on the geopolitical front came in response to reports over the weekend that the Biden administration has authorized Ukraine to use US-made weapons to strike Russian territory.
Looking ahead, this week’s focus will shift to key economic data releases globally, with preliminary PMIs expected to take center stage in the first turn. Comments from central bank officials are also likely to draw attention, especially following Fed Chair Jerome Powell’s remarks last week, where he reiterated the Fed’s cautious approach to further rate cuts, citing the resilience of the US economy.
Shifting the optics, non-commercial players (speculators) reduced their net long positions in Gold to approximately 236.5K contracts as of November 12, the lowest level since early June, according to the latest CFTC report. This decline coincided with a second consecutive drop in open interest, which could in turn morph into a signal that the recent downtrend in the commodity could start losing momentum.
XAU/USD short-term technical outlook
The daily chart for XAU/USD shows a clear break above the bullish 100-day Simple Moving Average (SMA) near $2,550, an area close to November’s low of $2,536. Further up, the so far weekly high around $2,540 (November 19) coincides with the transitory 55-day SMA, reinforcing this initial resistance zone. Up from here, the next minor target emerges at the weekly high of $2,749 (November 5).
On the other hand, a quick breach of the temporary 100-day SMA at $2,551 should shift the attention to the November bottom of $2,536 (November 14).
In the short term, the 4-hour chart suggests that the ongoing recovery has more room to run. The Relative Strength Index (RSI) has bounced but faces resistance around the 62 region, while the Average Directional Index (ADX) at 32 indicates a lack of strong trend momentum for the time being.
On the upside, the next resistance levels to watch are $2,639, followed by the more significant 200-SMA at $2,678 and the 100-SMA. On the downside, support remains firm at $2,536, a key level to watch if prices reverse course.
Green tea is one of the most widely consumed beverages globally, celebrated for its health benefits, rich flavor, and numerous bioactive compounds. Among these compounds, catechins-specifically, epigallocatechin gallate (EGCG)-are the most studied and have garnered significant attention for their antioxidant properties. The growing awareness of these health benefits has contributed to the rapid expansion of the green tea catechins market. This article will provide a comprehensive overview of the green tea catechins market, discussing its current trends, market drivers, challenges, and future prospects.
Green Tea Catechins Market Size was estimated at 2.23 (USD Billion) in 2023. The Green Tea Catechins Market Industry is expected to grow from 2.46(USD Billion) in 2024 to 5.4 (USD Billion) by 2032. The Green Tea Catechins Market CAGR (growth rate) is expected to be around 10.36% during the forecast period (2025 – 2032).
Get Full PDF Sample Copy of Report: https://www.wiseguyreports.com/sample-request?id=618596
What Are Green Tea Catechins?
Catechins are a type of flavonoid, a class of polyphenolic compounds with potent antioxidant effects. Green tea is particularly rich in catechins, which make up about 30-40% of the dry weight of the tea leaves. The primary catechins found in green tea include:
Epigallocatechin Gallate (EGCG): The most abundant and biologically active catechin, known for its potent antioxidant and anti-inflammatory properties.
Epicatechin Gallate (ECG)
Epicatechin (EC)
Epigallocatechin (EGC)
Catechin (C)
These catechins have been extensively researched for their potential health benefits, which range from anti-cancer properties to improved cardiovascular health and enhanced metabolism.
Market Trends Driving the Green Tea Catechins Market
The green tea catechins market has seen a significant surge in recent years, driven by several factors:
Rising Health Awareness: There is a growing awareness among consumers about the health benefits of green tea, including weight management, reduced risk of chronic diseases, and improved skin health. Catechins, especially EGCG, are believed to be responsible for many of these benefits, leading to their increased demand in supplements, functional foods, and beverages.
Demand for Natural and Plant-Based Products: Consumers are increasingly shifting towards natural and plant-based products, preferring those with minimal processing and synthetic additives. Green tea catechins, derived from natural sources, align perfectly with this trend, making them a popular ingredient in health-focused consumer products.
Popularity of Weight Loss Products: Green tea catechins, particularly EGCG, have been linked to enhanced fat oxidation and metabolism. This has fueled the growth of weight loss supplements that incorporate green tea extract. As more people turn to natural solutions for weight management, the market for green tea catechins continues to grow.
Skin Care Applications: Catechins, due to their antioxidant and anti-inflammatory properties, are gaining traction in the skincare industry. They help protect the skin from UV damage, reduce signs of aging, and promote overall skin health. Green tea extract, rich in catechins, is widely used in creams, lotions, and serums.
Increase in Functional Beverages: The trend of functional beverages, which offer additional health benefits beyond basic hydration, is expanding. Green tea-based drinks enriched with catechins are becoming popular as consumers seek beverages that offer benefits such as increased energy, improved metabolism, and enhanced immune support.
Regional Insights
The green tea catechins market is experiencing significant growth across various regions, with the Asia-Pacific region leading the market due to the high consumption of green tea in countries like China, Japan, and India. These countries have a long history of green tea consumption, and the increasing adoption of green tea supplements and functional foods further drives the regional market.
North America and Europe are also witnessing a rise in demand for green tea catechins, driven by an increasing focus on health and wellness. In these regions, green tea catechins are gaining popularity as functional ingredients in weight loss products, and skincare formulations.
The Middle East and Africa are expected to see a slower but steady growth in the green tea catechins market, as awareness of the health benefits of green tea and related products continues to spread. However, growth in these regions is limited by factors such as lower disposable income and less-established consumer markets for health-focused products.
Challenges in the Green Tea Catechins Market
While the green tea catechins market is poised for continued growth, several challenges could hinder its expansion:
Fluctuating Raw Material Supply: The availability and cost of high-quality green tea leaves, which are the primary source of catechins, are subject to fluctuations in supply. Weather conditions, such as droughts or extreme temperatures, can affect tea harvests, impacting the availability of raw materials and, in turn, the cost of catechins.
Competition from Other Natural Ingredients: While green tea catechins are popular, they face competition from other plant-based ingredients with similar health benefits, such as turmeric, ginger, and ginseng. The presence of these alternatives may affect the market share of green tea catechins.
Lack of Awareness in Emerging Markets: While the benefits of green tea catechins are well-known in developed markets, many emerging markets still lack awareness regarding these benefits. Educating consumers in these regions could be key to unlocking the full potential of the green tea catechins market.
Browse Full Report Details: https://www.wiseguyreports.com/reports/green-tea-catechins-market
Key Players
The Kraft Heinz Company ,PepsiCo ,Abbott Laboratories ,Dali Foods ,CocaCola ,Mars ,Nestle ,Ajinomoto ,Mondelez International ,Unilever ,Hain Celestial Group ,Glanbia ,Danone ,Herbalife Nutrition ,Nature’s Way
Future Prospects and Opportunities
The green tea catechins market is expected to continue growing due to various factors:
Innovation in Product Development: Manufacturers are focusing on developing innovative products that incorporate green tea catechins in novel forms, such as beverages, snacks, and beauty products. This innovation will drive further demand and market expansion.
Increased Focus on Preventive Healthcare: As more consumers prioritize preventive healthcare, the demand for natural ingredients like green tea catechins will increase. Products that promote general well-being, including immune support, heart health, and anti-aging, will become more popular.
Research and Development: Ongoing research into the health benefits of green tea catechins will further validate their efficacy in treating and preventing various diseases. This will likely lead to an increase in demand from the pharmaceutical and nutraceutical industries.
E-commerce Growth: The rise of e-commerce platforms offers significant opportunities for the distribution of green tea catechins and related products. Online retailers provide consumers with easier access to a wide variety of green tea-based products, contributing to the market’s growth.
Table of Contents
SECTION I: EXECUTIVE SUMMARY AND KEY HIGHLIGHTS
EXECUTIVE SUMMARY
Market Overview
Key Findings
Market Segmentation
Competitive Landscape
Challenges and Opportunities
Future Outlook
SECTION II: SCOPING, METHODOLOGY AND MARKET STRUCTURE
SECTION III: QUALITATIVE ANALYSIS
SECTION IV: QUANTITATIVE ANALYSIS
SECTION V: COMPETITIVE ANALYSIS
LIST Of tables
LIST Of figures
Browse More Related Reports:
Live Beneficial Bacteria Market https://www.wiseguyreports.com/reports/live-beneficial-bacteria-market
Office No. 528, Amanora Chambers Pune – 411028 Maharashtra, India 411028
Sales +91 20 6912 2998
About WiseGuy Reports
We Are One Of The World’s Largest Premium Market Research & Statistical Reports Centre
Wise Guy Reports is pleased to introduce itself as a leading provider of insightful market research solutions that adapt to the ever-changing demands of businesses around the globe. By offering comprehensive market intelligence, our company enables corporate organizations to make informed choices, drive growth, and stay ahead in competitive markets.
Integrity and ethical conduct are at the core of everything done within Wise Guy Reports. We ensure transparency, fairness, and integrity in all aspects of our business operations, including interactions with clients, partners, and stakeholders, by abiding by the highest ethical standards.
USD/JPY falls to a six-day low, breaking through key support levels amidst heightened risk aversion.
Technical indicators suggest potential further declines, with next targets set at Kijun-sen and 200-day SMA at 151.88.
Immediate resistance for USD/JPY is located at the 154.00 level, with significant upper resistance at the recent peak of 156.75.
The Japanese Yen registered solid gains versus the US Dollar in early trading on Tuesday, exchanging hands at 153.83 at the time of writing. Risk aversion sponsored by the escalation of the Ukraine-Russia conflict keeps traders seeking the safety of haven currencies, like the Yen and the Swiss Franc.
USD/JPY Price Forecast: Technical outlook
The USD/JPY cleared support at the November 7 high at 154.71, opening the door for further losses. The pair achieved a lower low, falling to a six-day bottom of 153.28, which could pave the way to testing the 200-day Simple Moving Average (SMA) at 151.88.
On its way to the 200-day SMA, the USD/JPY must clear the Kijun-sen at 152.80, followed by the 152.00 mark. If cleared up, next would be the 200-day SMA, followed by the 100-day SMA at 151.94.
On the other hand, the USD/JPY first resistance would be the 154.00 figure. Once cleared, the next resistance would be the November 15 peak at 156.75.
USD/JPY Price Chart – Daily
Japanese Yen FAQs
The Japanese Yen (JPY) is one of the world’s most traded currencies. Its value is broadly determined by the performance of the Japanese economy, but more specifically by the Bank of Japan’s policy, the differential between Japanese and US bond yields, or risk sentiment among traders, among other factors.
One of the Bank of Japan’s mandates is currency control, so its moves are key for the Yen. The BoJ has directly intervened in currency markets sometimes, generally to lower the value of the Yen, although it refrains from doing it often due to political concerns of its main trading partners. The BoJ ultra-loose monetary policy between 2013 and 2024 caused the Yen to depreciate against its main currency peers due to an increasing policy divergence between the Bank of Japan and other main central banks. More recently, the gradually unwinding of this ultra-loose policy has given some support to the Yen.
Over the last decade, the BoJ’s stance of sticking to ultra-loose monetary policy has led to a widening policy divergence with other central banks, particularly with the US Federal Reserve. This supported a widening of the differential between the 10-year US and Japanese bonds, which favored the US Dollar against the Japanese Yen. The BoJ decision in 2024 to gradually abandon the ultra-loose policy, coupled with interest-rate cuts in other major central banks, is narrowing this differential.
The Japanese Yen is often seen as a safe-haven investment. This means that in times of market stress, investors are more likely to put their money in the Japanese currency due to its supposed reliability and stability. Turbulent times are likely to strengthen the Yen’s value against other currencies seen as more risky to invest in.
Bitcoin Cash is one of those cryptocurrencies that many people have heard of but don’t really know what it is. BCH is still often seen as nothing but Bitcoin’s sidegrade and only spoken of in the context of discussing Bitcoin forks. However, it has shown a lot of promise and is currently one of the 30 biggest cryptocurrencies in the world.
As with any other cryptocurrency, it is hard to say whether Bitcoin Cash will be a good investment or not. Yet, its high market cap and solid technical foundation, as well as great potential usability, can help to keep its price afloat if the market crashes.
Bitcoin Cash Overview
Bitcoin Cash Price Change 24h
2.12%
Bitcoin Cash Price Change 7d
5.05%
Bitcoin Cash Market cap
$9,350,872,700.80
Bitcoin Cash All time high
$4,355.62
Bitcoin Cash All time low
$75.08
Bitcoin Cash Price Prediction 7d
$432.23 –2.03
Bitcoin Cash Fear-Greed Index
90 Extreme
Bitcoin Cash Volatility
8.97%
Bitcoin Cash Green Days
15/30 (50%)
Our real-time BCH to USD price update shows the current Bitcoin Cash price as $441.17 USD.
According to our Bitcoin Cash price prediction, BCH price is expected to have a 1.18% decrease and drop as low as by November 19, 2024.
Our technical indicators signal about the Bullish Bullish 93% market sentiment on Bitcoin Cash, while the Fear & Greed Index is displaying a score of 90 (Extreme Greed).
Over the last 30 days, Bitcoin Cash has had 15/30 (50%) green days and 8.97% price volatility.
Bitcoin Cash Profit Calculator
Profit calculation please wait…
Bitcoin Cash (BCH) Technical Overview
When discussing future trading opportunities of digital assets, it is essential to pay attention to market sentiments.
The bulls are leading – sell and lock in your gains!
On the four-hour chart, Bitcoin Cash is bullish. The 50-day moving average is rising, suggesting a strong short-term trend. Meanwhile, the 200-day moving average has been rising since 15/11/2024, indicating a strong longer-term trend.
In the daily chart, Bitcoin Cash is bullish. The 50-day moving average, currently below the price, is rising, which might support future price movements. The 200-day moving average has been falling since 21/10/2024, showing long-term weakness.
On the weekly timeframe, Bitcoin Cash appears bullish. The 50-day moving average is below the price and rising, potentially acting as support. The 200-day moving average, rising since 05/05/2024, supports a sustained trend.
Bitcoin Cash (BCH) Price Prediction For Today, Tomorrow and Next 30 Days
Date
Price
Change
November 18, 2024
$441.54
0.08%
November 19, 2024
$433.52
-1.73%
November 20, 2024
$446.37
1.18%
November 21, 2024
$495.10
12.22%
November 22, 2024
$461.86
4.69%
Bitcoin Cash Prediction Table
2024
2025
2026
2027
2028
2029
2030
2031
2032
2033
2040
2050
November
$433.52
$464.31
$495.10
December
$341.71
$400.81
$459.91
January
$335.06
$387.72
$440.38
All Time
$370.10
$417.61
$465.13
January
$343.26
$513.93
$428.60
February
$342.52
$532.76
$437.64
March
$341.77
$551.58
$446.68
April
$341.03
$570.41
$455.72
May
$340.28
$589.24
$464.76
June
$339.54
$608.07
$473.81
July
$338.79
$626.89
$482.85
August
$338.04
$645.72
$491.89
September
$337.30
$664.55
$500.93
October
$336.55
$683.38
$509.97
November
$335.81
$702.20
$519.01
December
$335.06
$721.03
$528.05
All Time
$339.16
$617.48
$478.33
January
$368.55
$724.55
$558.91
February
$402.04
$728.06
$589.77
March
$435.53
$731.58
$620.63
April
$469.02
$735.09
$651.49
May
$502.51
$738.61
$682.35
June
$536.01
$742.12
$713.21
July
$569.50
$745.64
$744.07
August
$602.99
$749.15
$774.93
September
$636.48
$752.67
$805.79
October
$669.97
$756.18
$836.65
November
$703.46
$759.70
$867.51
December
$736.95
$763.21
$898.37
All Time
$552.75
$743.88
$728.64
January
$766.29
$792.94
$929.42
February
$795.63
$822.68
$960.48
March
$824.96
$852.41
$991.53
April
$854.30
$882.14
$1,022.58
May
$883.64
$911.87
$1,053.63
June
$912.98
$941.61
$1,084.69
July
$942.31
$971.34
$1,115.74
August
$971.65
$1,001.07
$1,146.79
September
$1,000.99
$1,030.80
$1,177.84
October
$1,030.33
$1,060.54
$1,208.90
November
$1,059.66
$1,090.27
$1,239.95
December
$1,089
$1,120
$1,271
All Time
$927.64
$956.47
$1,100.21
January
$1,129.17
$1,162.25
$1,320.50
February
$1,169.33
$1,204.50
$1,370
March
$1,209.50
$1,246.75
$1,419.50
April
$1,249.67
$1,289
$1,469
May
$1,289.83
$1,331.25
$1,518.50
June
$1,330
$1,373.50
$1,568
July
$1,370.17
$1,415.75
$1,617.50
August
$1,410.33
$1,458
$1,667
September
$1,450.50
$1,500.25
$1,716.50
October
$1,490.67
$1,542.50
$1,766
November
$1,530.83
$1,584.75
$1,815.50
December
$1,571
$1,627
$1,865
All Time
$1,350.08
$1,394.63
$1,592.75
January
$1,638.08
$1,696.25
$1,942.17
February
$1,705.17
$1,765.50
$2,019.33
March
$1,772.25
$1,834.75
$2,096.50
April
$1,839.33
$1,904
$2,173.67
May
$1,906.42
$1,973.25
$2,250.83
June
$1,973.50
$2,042.50
$2,328
July
$2,040.58
$2,111.75
$2,405.17
August
$2,107.67
$2,181
$2,482.33
September
$2,174.75
$2,250.25
$2,559.50
October
$2,241.83
$2,319.50
$2,636.67
November
$2,308.92
$2,388.75
$2,713.83
December
$2,376
$2,458
$2,791
All Time
$2,007.04
$2,077.13
$2,366.58
January
$2,465.33
$2,550.75
$2,904.08
February
$2,554.67
$2,643.50
$3,017.17
March
$2,644
$2,736.25
$3,130.25
April
$2,733.33
$2,829
$3,243.33
May
$2,822.67
$2,921.75
$3,356.42
June
$2,912
$3,014.50
$3,469.50
July
$3,001.33
$3,107.25
$3,582.58
August
$3,090.67
$3,200
$3,695.67
September
$3,180
$3,292.75
$3,808.75
October
$3,269.33
$3,385.50
$3,921.83
November
$3,358.67
$3,478.25
$4,034.92
December
$3,448
$3,571
$4,148
All Time
$2,956.67
$3,060.88
$3,526.04
January
$3,595.25
$3,722.92
$4,308.67
February
$3,742.50
$3,874.83
$4,469.33
March
$3,889.75
$4,026.75
$4,630
April
$4,037
$4,178.67
$4,790.67
May
$4,184.25
$4,330.58
$4,951.33
June
$4,331.50
$4,482.50
$5,112
July
$4,478.75
$4,634.42
$5,272.67
August
$4,626
$4,786.33
$5,433.33
September
$4,773.25
$4,938.25
$5,594
October
$4,920.50
$5,090.17
$5,754.67
November
$5,067.75
$5,242.08
$5,915.33
December
$5,215
$5,394
$6,076
All Time
$4,405.13
$4,558.46
$5,192.33
January
$5,411
$5,597.58
$6,328.08
February
$5,607
$5,801.17
$6,580.17
March
$5,803
$6,004.75
$6,832.25
April
$5,999
$6,208.33
$7,084.33
May
$6,195
$6,411.92
$7,336.42
June
$6,391
$6,615.50
$7,588.50
July
$6,587
$6,819.08
$7,840.58
August
$6,783
$7,022.67
$8,092.67
September
$6,979
$7,226.25
$8,344.75
October
$7,175
$7,429.83
$8,596.83
November
$7,371
$7,633.42
$8,848.92
December
$7,567
$7,837
$9,101
All Time
$6,489
$6,717.29
$7,714.54
January
$7,840.92
$8,114.50
$9,439.42
February
$8,114.83
$8,392
$9,777.83
March
$8,388.75
$8,669.50
$10,116.25
April
$8,662.67
$8,947
$10,454.67
May
$8,936.58
$9,224.50
$10,793.08
June
$9,210.50
$9,502
$11,131.50
July
$9,484.42
$9,779.50
$11,469.92
August
$9,758.33
$10,057
$11,808.33
September
$10,032.25
$10,334.50
$12,146.75
October
$10,306.17
$10,612
$12,485.17
November
$10,580.08
$10,889.50
$12,823.58
December
$10,854
$11,167
$13,162
All Time
$9,347.46
$9,640.75
$11,300.71
January
$15,691.33
$17,206.67
$21,361.92
February
$20,528.67
$23,246.33
$29,561.83
March
$25,366
$29,286
$37,761.75
April
$30,203.33
$35,325.67
$45,961.67
May
$35,040.67
$41,365.33
$54,161.58
June
$39,878
$47,405
$62,361.50
July
$44,715.33
$53,444.67
$70,561.42
August
$49,552.67
$59,484.33
$78,761.33
September
$54,390
$65,524
$86,961.25
October
$59,227.33
$71,563.67
$95,161.17
November
$64,064.67
$77,603.33
$103,361.08
December
$68,902
$83,643
$111,561
All Time
$42,296.67
$50,424.83
$66,461.46
January
$74,839.33
$89,338.33
$117,098.08
February
$80,776.67
$95,033.67
$122,635.17
March
$86,714
$100,729
$128,172.25
April
$92,651.33
$106,424.33
$133,709.33
May
$98,588.67
$112,119.67
$139,246.42
June
$104,526
$117,815
$144,783.50
July
$110,463.33
$123,510.33
$150,320.58
August
$116,400.67
$129,205.67
$155,857.67
September
$122,338
$134,901
$161,394.75
October
$128,275.33
$140,596.33
$166,931.83
November
$134,212.67
$146,291.67
$172,468.92
December
$140,150
$151,987
$178,006
All Time
$107,494.67
$120,662.67
$147,552.04
Choose a year
2024
2025
2026
2027
2028
2029
2030
2031
2032
2033
2040
2050
Bitcoin Cash Historical
According to the latest data gathered, the current price of Bitcoin Cash is $508.02, and BCH is presently ranked No. 15 in the entire crypto ecosystem. The circulation supply of Bitcoin Cash is $10,012,518,198.91, with a market cap of 19,708,978 BCH.
In the past 24 hours, the crypto has increased by $7.47 in its current value.
For the last 7 days, BCH has been in a good upward trend, thus increasing by 18.46%. Bitcoin Cash has shown very strong potential lately, and this could be a good opportunity to dig right in and invest.
During the last month, the price of BCH has increased by 0.83%, adding a colossal average amount of $4.22 to its current value. This sudden growth means that the coin can become a solid asset now if it continues to grow.
Bitcoin Cash Price Prediction 2024
According to the technical analysis of Bitcoin Cash prices expected in 2024, the minimum cost of Bitcoin Cash will be $344.01. The maximum level that the BCH price can reach is $419.56. The average trading price is expected around $495.10.
November 2024: Bitcoin Cash Price Forecast
In the middle of autumn 2024, the Bitcoin Cash cost will be traded at the average level of $464.31. Crypto analysts expect that in November 2024, the BCH price might fluctuate between $433.52 and $495.10.
BCH Price Forecast for December 2024
Market experts expect that in December 2024, the Bitcoin Cash value will not drop below a minimum of $341.71. The maximum peak expected this month is $459.91. The estimated average trading value will be at the level of $400.81.
January 2025: Bitcoin Cash Price Forecast
Cryptocurrency experts have carefully analyzed the range of BCH prices throughout 2024. For January 2025, their forecast is the following: the maximum trading value of Bitcoin Cash will be around $440.38, with a possibility of dropping to a minimum of $335.06. In January 2025, the average cost will be $387.72.
Bitcoin Cash Price Prediction 2025
After the analysis of the prices of Bitcoin Cash in previous years, it is assumed that in 2025, the minimum price of Bitcoin Cash will be around $335.06. The maximum expected BCH price may be around $528.05. On average, the trading price might be $721.03 in 2025.
Month
Minimum Price
Average Price
Maximum Price
January 2025
$343.26
$513.93
$428.60
February 2025
$342.52
$532.76
$437.64
March 2025
$341.77
$551.58
$446.68
April 2025
$341.03
$570.41
$455.72
May 2025
$340.28
$589.24
$464.76
June 2025
$339.54
$608.07
$473.81
July 2025
$338.79
$626.89
$482.85
August 2025
$338.04
$645.72
$491.89
September 2025
$337.30
$664.55
$500.93
October 2025
$336.55
$683.38
$509.97
November 2025
$335.81
$702.20
$519.01
December 2025
$335.06
$721.03
$528.05
Bitcoin Cash Price Prediction 2026
Based on the technical analysis by cryptocurrency experts regarding the prices of Bitcoin Cash, in 2026, BCH is expected to have the following minimum and maximum prices: about $736.95 and $898.37, respectively. The average expected trading cost is $763.21.
Month
Minimum Price
Average Price
Maximum Price
January 2026
$368.55
$724.55
$558.91
February 2026
$402.04
$728.06
$589.77
March 2026
$435.53
$731.58
$620.63
April 2026
$469.02
$735.09
$651.49
May 2026
$502.51
$738.61
$682.35
June 2026
$536.01
$742.12
$713.21
July 2026
$569.50
$745.64
$744.07
August 2026
$602.99
$749.15
$774.93
September 2026
$636.48
$752.67
$805.79
October 2026
$669.97
$756.18
$836.65
November 2026
$703.46
$759.70
$867.51
December 2026
$736.95
$763.21
$898.37
Bitcoin Cash Price Prediction 2027
The experts in the field of cryptocurrency have analyzed the prices of Bitcoin Cash and their fluctuations during the previous years. It is assumed that in 2027, the minimum BCH price might drop to $1,089, while its maximum can reach $1,271. On average, the trading cost will be around $1,120.
Month
Minimum Price
Average Price
Maximum Price
January 2027
$766.29
$792.94
$929.42
February 2027
$795.63
$822.68
$960.48
March 2027
$824.96
$852.41
$991.53
April 2027
$854.30
$882.14
$1,022.58
May 2027
$883.64
$911.87
$1,053.63
June 2027
$912.98
$941.61
$1,084.69
July 2027
$942.31
$971.34
$1,115.74
August 2027
$971.65
$1,001.07
$1,146.79
September 2027
$1,000.99
$1,030.80
$1,177.84
October 2027
$1,030.33
$1,060.54
$1,208.90
November 2027
$1,059.66
$1,090.27
$1,239.95
December 2027
$1,089
$1,120
$1,271
Bitcoin Cash Price Prediction 2028
Based on the analysis of the costs of Bitcoin Cash by crypto experts, the following maximum and minimum BCH prices are expected in 2028: $1,865 and $1,571. On average, it will be traded at $1,627.
Month
Minimum Price
Average Price
Maximum Price
January 2028
$1,129.17
$1,162.25
$1,320.50
February 2028
$1,169.33
$1,204.50
$1,370
March 2028
$1,209.50
$1,246.75
$1,419.50
April 2028
$1,249.67
$1,289
$1,469
May 2028
$1,289.83
$1,331.25
$1,518.50
June 2028
$1,330
$1,373.50
$1,568
July 2028
$1,370.17
$1,415.75
$1,617.50
August 2028
$1,410.33
$1,458
$1,667
September 2028
$1,450.50
$1,500.25
$1,716.50
October 2028
$1,490.67
$1,542.50
$1,766
November 2028
$1,530.83
$1,584.75
$1,815.50
December 2028
$1,571
$1,627
$1,865
Bitcoin Cash Price Prediction 2029
Crypto experts are constantly analyzing the fluctuations of Bitcoin Cash. Based on their predictions, the estimated average BCH price will be around $2,458. It might drop to a minimum of $2,376, but it still might reach $2,791 throughout 2029.
Month
Minimum Price
Average Price
Maximum Price
January 2029
$1,638.08
$1,696.25
$1,942.17
February 2029
$1,705.17
$1,765.50
$2,019.33
March 2029
$1,772.25
$1,834.75
$2,096.50
April 2029
$1,839.33
$1,904
$2,173.67
May 2029
$1,906.42
$1,973.25
$2,250.83
June 2029
$1,973.50
$2,042.50
$2,328
July 2029
$2,040.58
$2,111.75
$2,405.17
August 2029
$2,107.67
$2,181
$2,482.33
September 2029
$2,174.75
$2,250.25
$2,559.50
October 2029
$2,241.83
$2,319.50
$2,636.67
November 2029
$2,308.92
$2,388.75
$2,713.83
December 2029
$2,376
$2,458
$2,791
Bitcoin Cash Price Prediction 2030
Every year, cryptocurrency experts prepare forecasts for the price of Bitcoin Cash. It is estimated that BCH will be traded between $3,448 and $4,148 in 2030. Its average cost is expected at around $3,571 during the year.
Month
Minimum Price
Average Price
Maximum Price
January 2030
$2,465.33
$2,550.75
$2,904.08
February 2030
$2,554.67
$2,643.50
$3,017.17
March 2030
$2,644
$2,736.25
$3,130.25
April 2030
$2,733.33
$2,829
$3,243.33
May 2030
$2,822.67
$2,921.75
$3,356.42
June 2030
$2,912
$3,014.50
$3,469.50
July 2030
$3,001.33
$3,107.25
$3,582.58
August 2030
$3,090.67
$3,200
$3,695.67
September 2030
$3,180
$3,292.75
$3,808.75
October 2030
$3,269.33
$3,385.50
$3,921.83
November 2030
$3,358.67
$3,478.25
$4,034.92
December 2030
$3,448
$3,571
$4,148
Bitcoin Cash Price Prediction 2031
Cryptocurrency analysts are ready to announce their estimations of the Bitcoin Cash’s price. The year 2031 will be determined by the maximum BCH price of $6,076. However, its rate might drop to around $5,215. So, the expected average trading price is $5,394.
Month
Minimum Price
Average Price
Maximum Price
January 2031
$3,595.25
$3,722.92
$4,308.67
February 2031
$3,742.50
$3,874.83
$4,469.33
March 2031
$3,889.75
$4,026.75
$4,630
April 2031
$4,037
$4,178.67
$4,790.67
May 2031
$4,184.25
$4,330.58
$4,951.33
June 2031
$4,331.50
$4,482.50
$5,112
July 2031
$4,478.75
$4,634.42
$5,272.67
August 2031
$4,626
$4,786.33
$5,433.33
September 2031
$4,773.25
$4,938.25
$5,594
October 2031
$4,920.50
$5,090.17
$5,754.67
November 2031
$5,067.75
$5,242.08
$5,915.33
December 2031
$5,215
$5,394
$6,076
Bitcoin Cash Price Prediction 2032
After years of analysis of the Bitcoin Cash price, crypto experts are ready to provide their BCH cost estimation for 2032. It will be traded for at least $7,567, with the possible maximum peaks at $9,101. Therefore, on average, you can expect the BCH price to be around $7,837 in 2032.
Month
Minimum Price
Average Price
Maximum Price
January 2032
$5,411
$5,597.58
$6,328.08
February 2032
$5,607
$5,801.17
$6,580.17
March 2032
$5,803
$6,004.75
$6,832.25
April 2032
$5,999
$6,208.33
$7,084.33
May 2032
$6,195
$6,411.92
$7,336.42
June 2032
$6,391
$6,615.50
$7,588.50
July 2032
$6,587
$6,819.08
$7,840.58
August 2032
$6,783
$7,022.67
$8,092.67
September 2032
$6,979
$7,226.25
$8,344.75
October 2032
$7,175
$7,429.83
$8,596.83
November 2032
$7,371
$7,633.42
$8,848.92
December 2032
$7,567
$7,837
$9,101
Bitcoin Cash Price Prediction 2033
Cryptocurrency analysts are ready to announce their estimations of the Bitcoin Cash’s price. The year 2033 will be determined by the maximum BCH price of $13,162. However, its rate might drop to around $10,854. So, the expected average trading price is $11,167.
Month
Minimum Price
Average Price
Maximum Price
January 2033
$7,840.92
$8,114.50
$9,439.42
February 2033
$8,114.83
$8,392
$9,777.83
March 2033
$8,388.75
$8,669.50
$10,116.25
April 2033
$8,662.67
$8,947
$10,454.67
May 2033
$8,936.58
$9,224.50
$10,793.08
June 2033
$9,210.50
$9,502
$11,131.50
July 2033
$9,484.42
$9,779.50
$11,469.92
August 2033
$9,758.33
$10,057
$11,808.33
September 2033
$10,032.25
$10,334.50
$12,146.75
October 2033
$10,306.17
$10,612
$12,485.17
November 2033
$10,580.08
$10,889.50
$12,823.58
December 2033
$10,854
$11,167
$13,162
Bitcoin Cash Price Prediction 2040
Cryptocurrency analysts are ready to announce their estimations of the Bitcoin Cash’s price. The year 2040 will be determined by the maximum BCH price of $111,561. However, its rate might drop to around $68,902. So, the expected average trading price is $83,643.
Month
Minimum Price
Average Price
Maximum Price
January 2040
$15,691.33
$17,206.67
$21,361.92
February 2040
$20,528.67
$23,246.33
$29,561.83
March 2040
$25,366
$29,286
$37,761.75
April 2040
$30,203.33
$35,325.67
$45,961.67
May 2040
$35,040.67
$41,365.33
$54,161.58
June 2040
$39,878
$47,405
$62,361.50
July 2040
$44,715.33
$53,444.67
$70,561.42
August 2040
$49,552.67
$59,484.33
$78,761.33
September 2040
$54,390
$65,524
$86,961.25
October 2040
$59,227.33
$71,563.67
$95,161.17
November 2040
$64,064.67
$77,603.33
$103,361.08
December 2040
$68,902
$83,643
$111,561
Bitcoin Cash Price Prediction 2050
Cryptocurrency analysts are ready to announce their estimations of the Bitcoin Cash’s price. The year 2050 will be determined by the maximum BCH price of $178,006. However, its rate might drop to around $140,150. So, the expected average trading price is $151,987.
Month
Minimum Price
Average Price
Maximum Price
January 2050
$74,839.33
$89,338.33
$117,098.08
February 2050
$80,776.67
$95,033.67
$122,635.17
March 2050
$86,714
$100,729
$128,172.25
April 2050
$92,651.33
$106,424.33
$133,709.33
May 2050
$98,588.67
$112,119.67
$139,246.42
June 2050
$104,526
$117,815
$144,783.50
July 2050
$110,463.33
$123,510.33
$150,320.58
August 2050
$116,400.67
$129,205.67
$155,857.67
September 2050
$122,338
$134,901
$161,394.75
October 2050
$128,275.33
$140,596.33
$166,931.83
November 2050
$134,212.67
$146,291.67
$172,468.92
December 2050
$140,150
$151,987
$178,006
Bitcoin Cash (BCH) Review
Bitcoin Cash is a hard fork of Bitcoin. The coin split from the original protocol back in 2017 amid rising concerns about scalability, slow transaction speed, and high fees. Additionally, there was a conflict in the Bitcoin community surrounding the true purpose of the coin, which Satoshi Nakamoto outlined as being a truly decentralized peer-to-peer digital payment method. Many participants felt like the original Bitcoin did not represent those values anymore.
However, the Bitcoin Cash of today is not exactly the same coin it was in 2017. BCH itself also went through a hard fork: in 2018, it split into Bitcoin ABC (now known as Bitcoin Cash) and Bitcoin SV (“Satoshi’s Vision”). The fork was made because the community disagreed on the future of the cryptocurrency, in particular in regard to block size.
Initially, BCH had a block size limit of 8MB. This allowed the coin to lower its fees and increase its transaction throughput. Since then, its block size has increased even more and is equal to 32MB at the moment.
Despite the benefits this coin can provide, there are quite a few things that stand between BCH and greatness. Firstly, there’s the original Bitcoin: most investors still choose it over the more technically advanced Bitcoin Cash. Not only is BCH overlooked as a profitable investment, but it is also not being taken anywhere near as seriously as BTC when it comes to everyday usage. Many marketplaces still only accept BTC as payment, leaving out all the altcoins.
We think that lack of usage for its intended purposes is the second obstacle that impedes BCH price growth. While, in theory, this coin does have an excellent block capacity, which leads to high transaction throughput, in reality, only a small percentage of BCH is actively being used — less than 5%.
Is Bitcoin Cash a Good Investment?
Bitcoin Cash has quite a lot going for it. BCH price has had plenty of ups and downs, allowing investors to make some profit off of it. Still, the coin’s market cap remains high, showing good promise for the project.
That said, please remember that just like when it comes to any other cryptocurrency, or any asset really, we cannot be certain whether BCH is a good investment or not. We don’t know for sure if Bitcoin Cash price will go up or not, and what the market will look like in 5 years. You should do your own research and make investment decisions based on your own analysis and existing portfolio.
Bitcoin Cash Price History
Bitcoin Cash has a rather curious price history: for example, in the middle of February 2022, the coin was worth almost as much as in 2017. At launch, BCH price was around $440, whereas back in February 2022 it was hovering around in the $300-350 range.
Source: CoinMarketCap
In fact, what sets BCH apart from other popular cryptocurrencies like the original Bitcoin or Ethereum is how relatively stable its price has been over the years. Although there were some price spikes, the value of Bitcoin Cash pretty much always went back to the $300-400 range, only going down to as low as $100 during prolonged bear markets. Most other cryptocurrencies that get ranked in the top 30 by market cap usually see their average prices rise over the course of the years — but not BCH.
On the one hand, that can be seen as a good thing — after all, cryptocurrencies are often criticized for being volatile, but on the other, it raises a lot of questions. Will BCH ever be able to break out of this pattern and hit not only a new maximum price but also increase its average value, too? Only time will tell. At the moment, we can only point out that historical data shows the relative stability of this coin and its resistance to market crashes.
Bitcoin Cash Price Predictions for 2023 by Experts
Cryptocurrency prices are notoriously volatile and thus near impossible to predict. However, it can still be useful to look at what different experts think may happen to the value of an asset in the future.
Bitcoin Cash has managed to stay in the top 30 by crypto market cap for a very long time. It is a well-known and well-established coin that has already carved out a place for itself in the cryptocurrency market. As a result, there are a lot of crypto traders, investors, and other experts watching it and trying to make a Bitcoin Cash forecast. Here are some of the Bitcoin Cash price predictions we have seen.
Wallet Investor
Wallet Investor is bearish on BCH. Their Bitcoin Cash price forecast has the coin significantly dropping in value in just a year. Their experts also expect Bitcoin Cash to fall down to the $17 mark in 2024 — an undoubtedly very pessimistic prediction. WI sees Bitcoin Cash as a bad long-term investment and is also bearish on it in the short term.
Gov Capital
Gov Capital is also bearish on BCH in the long term, but their Bitcoin Cash forecast is a bit more pessimistic. Their experts predict that Bitcoin Cash’s future price might go even lower than $17.
Overall, however, Gov Capital’s Bitcoin Cash price prediction is incredibly volatile as they can see the BCH price constantly going from $20 to $100. If you were to take their Bitcoin Cash forecast seriously, then you would have to be an expert at finding the appropriate entry/exit points to buy and sell Bitcoin Cash at the best moments for making a profit.
TradingBeasts
Just like other crypto experts, at the time of writing this platform was heavily bearish on BCH. According to their Bitcoin Cash technical analysis, the coin is likely to fall in value in the near future.
Digital Coin Price
Unlike everyone else on this list, Digital Coin Price is bullish on the Bitcoin Cash price. Their analysis sees the coin to more than double in value in one year, and keep rising well into the future. Their forecasted Bitcoin Cash price for 2030 reaches $1,000.
Other Crypto Experts
While most experts are bearish on BCH, it is important to remember that its price heavily depends on the overall state of the crypto market. As a big cryptocurrency, Bitcoin Cash is unlikely to crash as fast and hard as some smaller coins and tokens. Most Bitcoin Cash predictions base their analysis on how the industry is doing at the moment, and are currently expecting the bearish sentiment to stay.
Please remember that this article does not constitute investment advice.
Where Can You Buy Bitcoin Cash?
There are many cryptocurrency exchanges that allow you to sell and buy Bitcoin Cash. On Changelly, you can purchase BCH with over 40 different fiat currencies at fair rates and quickly and easily exchange it for 500+ cryptocurrencies with low fees.
Disclaimer: Please note that the contents of this article are not financial or investing advice. The information provided in this article is the author’s opinion only and should not be considered as offering trading or investing recommendations. We do not make any warranties about the completeness, reliability and accuracy of this information. The cryptocurrency market suffers from high volatility and occasional arbitrary movements. Any investor, trader, or regular crypto users should research multiple viewpoints and be familiar with all local regulations before committing to an investment.