About Editorial team of BIPNs

Main team of content of bipns.com. Any type of content should be approved by us.
11 11, 2024

CRN’s supplement survey, OmniActive’s new acquisition, SABPA report, NPA on NMN

By |2024-11-11T14:51:25+02:00November 11, 2024|Dietary Supplements News, News|0 Comments


USA:​ Supplement use remains at 75%, interest increases in specialty products​

Three quarters of Americans continue to use dietary supplements, according to the 2024 Consumer Survey conducted by Ipsos and sponsored by the Council for Responsible Nutrition.

This is consistent with 2023 numbers, but CRN noted that the survey highlights subtle shifts towards specific products as the market moves toward precision health approaches.

“We continue to see consumers exploring new specialty products and embrace personalized health solutions,” said Jeff Ventura, senior vice president of communications at CRN. “This speaks to the evolving landscape of wellness, where supplements are becoming more integrated into individualized health practices.”

According to the survey, 69% of respondents said they look for a personalized regimen when choosing their products. Among users under the age of 55, Black and Asian Americans are more likely seek out personalized solutions when selecting a dietary supplement.

The reasons for supplement use remain also consistent with 2023 data—42% of consumers list overall health and wellness as a motivation for supplementation. Immune health and energy are factors contributing to use in 30% and 27% of consumers, respectively.

Click HERE​ for more information.

India: OmniActive acquires ENovate Biolife​

OmniActive Health Technologies has acquired ENovate Biolife, expanding its ingredients portfolio to target key health categories in the dietary supplement space.

The agreement, finalized on Oct. 26, builds on the success of an initial 2019 partnership between the two companies through a U.S. licensing agreement for enXtra, a clinically studied Alpinia Galanga ingredient marketed to support mental energy.


Source link

11 11, 2024

EUR/USD Forecast Today 11/11: Holds Support (Video)

By |2024-11-11T14:26:21+02:00November 11, 2024|Forex News, News|0 Comments

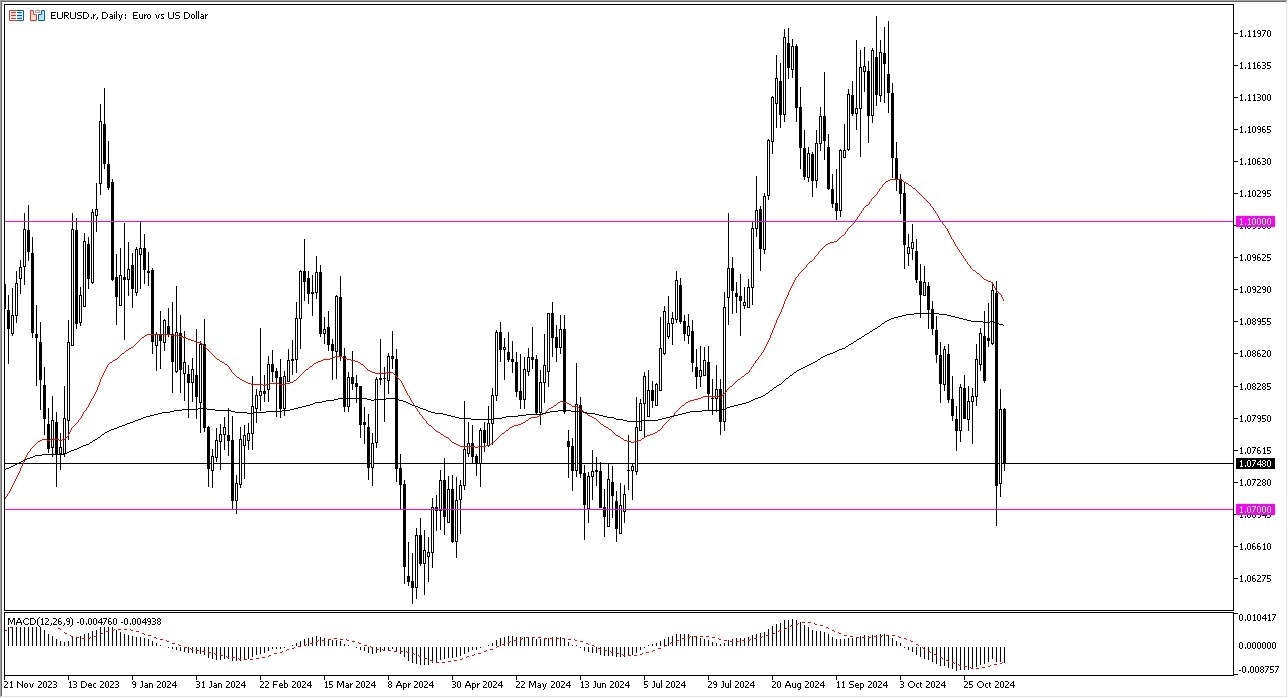
  • The Euro initially pulled back just a bit during the trading session on Friday.
  • As we continue to see plenty of support underneath at the 1.07 level, I think we see so much in the way of support that it is going to be difficult to break down below here.
  • But I also would point out the fact that the market is near the bottom of a larger consolidation range that I think this becomes more of a buy on the dip situation for short-term traders.

Longer-term traders probably need to see a little bit more convincing price action. So right now, we’ll have to see how this closes out, but it certainly looks like a market that is seeing a lot of support near the 1.07 level. And then again, probably at the 1.06 level, if we do in fact continue to fall. This would be a major area of support and trouble, and therefore we will have to pay close attention to it.

Interest Rates Continue to be a Major Factor

All things being equal, EUR/USD is a market that is moving based on interest rates in America going higher, despite the fact that the Fed continues to cut rates. This shows that the bond market is starting to get out of control a little bit. And perhaps that’s part of what’s going on. Remember, the US dollar is considered to be a safety currency, so that is something that you need to take into account anytime you trade this market.

Nonetheless, this is one that I think you favor short-term bounces and fading signs of exhaustion on the upside. I’m not aggressive in this market at all. And most of the time I just use it as an indicator as to how to trade the US dollar against almost everything else. As in general, if you get the US dollar right in the Forex world, you get most things right.

Ready to trade our EUR/USD Forex forecast? Here’s a list of some of the top forex brokers in Europe to check out. 

Source link

11 11, 2024

Can SOL Reach $500 Amidst JetBolt’s Rising Momentum

By |2024-11-11T14:21:37+02:00November 11, 2024|Crypto News, News|0 Comments

JetBolt’s (JBOLT) presale just crossed the $526,000 mark this month, with both crypto whales and early adopters diving in. As an emerging token, JetBolt unveils a fully operational platform featuring powered by the Skale Network.

By eliminating gas fees, JetBolt creates a streamlined environment for developers and users alike. It enables the seamless creation of dApps, Web3, SocialFi, and blockchain gaming projects without the typical high gas costs, paving the way for wider participation and adoption.

Beyond zero-gas technology, JetBolt offers a cutting-edge AI-driven tool that delivers Web3 news and trending coins. Additionally, JetBolt’s staking mechanism, conveniently accessible through its native Web3 wallet, rewards active participants, creating an engaging ecosystem where staking translates to earnings with each interaction.

JetBolt has introduced exclusive presale perks, including instant self-custody of tokens and daily price increases. Additionally, JetBolt is offering Alpha Boxes, which reward batch token buyers with up to 25% more JetBolt tokens.

At press time, JetBolt is making waves with its groundbreaking ecosystem with over $526,000 in presale revenue. It is a herculean feat for an emerging altcoin, offering a fresh blockchain experience that could make JetBolt the best crypto to buy in 2025. 

Source link

11 11, 2024

Herbal Supplements Market Soars to USD 144.15 Billion by 2030

By |2024-11-11T12:50:27+02:00November 11, 2024|Dietary Supplements News, News|0 Comments


Herbal Supplements Market

The global 𝐇𝐞𝐫𝐛𝐚𝐥 𝐒𝐮𝐩𝐩𝐥𝐞𝐦𝐞𝐧𝐭𝐬 𝐌𝐚𝐫𝐤𝐞𝐭 is projected to grow at a compound annual growth rate (CAGR) of 7.3% from 2024 to 2030, reaching an estimated value of approximately USD 144.15 billion by 2030, up from USD 88.7 billion in 2023.

𝐇𝐞𝐫𝐛𝐚𝐥 𝐒𝐮𝐩𝐩𝐥𝐞𝐦𝐞𝐧𝐭𝐬 𝐌𝐚𝐫𝐤𝐞𝐭 𝐎𝐯𝐞𝐫𝐯𝐢𝐞𝐰:

Herbal supplements are plant-based dietary products that have been used for centuries across different cultures, such as in traditional Chinese and Ayurvedic medicine, for their therapeutic properties. These supplements, often in the form of tablets, capsules, powders, or liquids, are derived from plants and are known for their potential to treat a variety of health issues. As the demand for alternative medicine rises, especially due to their perceived natural and safe benefits, the herbal supplements market is experiencing significant growth, particularly in regions like North America, where products like ginseng and green tea extract have gained popularity for their health benefits.

𝐘𝐨𝐮𝐫 𝐒𝐚𝐦𝐩𝐥𝐞 𝐑𝐞𝐩𝐨𝐫𝐭 𝐈𝐬 𝐉𝐮𝐬𝐭 𝐚 𝐂𝐥𝐢𝐜𝐤 𝐀𝐰𝐚𝐲! https://www.maximizemarketresearch.com/request-sample/20657/

𝐃𝐫𝐢𝐯𝐞𝐫𝐬 𝐢𝐧 𝐭𝐡𝐞 𝐇𝐞𝐫𝐛𝐚𝐥 𝐒𝐮𝐩𝐩𝐥𝐞𝐦𝐞𝐧𝐭𝐬 𝐌𝐚𝐫𝐤𝐞𝐭:

The growing global awareness about healthy living, combined with the increasing prevalence of lifestyle diseases and mental health issues, is prompting more consumers to seek alternative health solutions. Herbal supplements offer a more affordable and natural alternative to conventional medicine, making them attractive to a health-conscious demographic. Additionally, the shift towards organic, plant-based products and increasing dissatisfaction with high medical costs further drives the demand for herbal supplements, creating a favorable market environment.

𝐇𝐞𝐫𝐛𝐚𝐥 𝐒𝐮𝐩𝐩𝐥𝐞𝐦𝐞𝐧𝐭𝐬 𝐌𝐚𝐫𝐤𝐞𝐭 𝐓𝐫𝐞𝐧𝐝𝐬:

Consumers are increasingly inclined toward personalized nutrition and tailored herbal products, which has sparked interest in bespoke supplements. Moreover, the focus on natural and clean-label ingredients continues to rise, especially in health and wellness products. The market for sports nutrition and performance-enhancing herbal supplements is also growing rapidly, driven by athletes and fitness enthusiasts looking for natural ways to improve endurance and overall performance. This trend is expected to propel the herbal supplements market forward during the forecast period.

𝐍𝐞𝐞𝐝 𝐌𝐨𝐫𝐞 𝐈𝐧𝐟𝐨𝐫𝐦𝐚𝐭𝐢𝐨𝐧? 𝐈𝐧𝐪𝐮𝐢𝐫𝐞 𝐀𝐛𝐨𝐮𝐭 𝐒𝐚𝐦𝐩𝐥𝐞 + 𝐆𝐫𝐚𝐩𝐡𝐬 𝐇𝐞𝐫𝐞: https://www.maximizemarketresearch.com/inquiry-before-buying/20657/

𝐇𝐞𝐫𝐛𝐚𝐥 𝐒𝐮𝐩𝐩𝐥𝐞𝐦𝐞𝐧𝐭𝐬 𝐌𝐚𝐫𝐤𝐞𝐭 𝐎𝐩𝐩𝐨𝐫𝐭𝐮𝐧𝐢𝐭𝐢𝐞𝐬:

With advancements in technology and an increase in research and development investments in dietary supplements, there are ample opportunities for market growth. The rise of e-commerce platforms has also created new avenues for reaching a broader audience, allowing consumers access to a wide range of herbal supplements. Additionally, as demand for personalized supplements grows, the market is set to benefit from innovations in bespoke and tailored products. The expansion of sports nutrition supplements is expected to be a key growth driver, attracting consumers focused on fitness and wellness.

𝐖𝐡𝐚𝐭 𝐢𝐬 𝐇𝐞𝐫𝐛𝐚𝐥 𝐒𝐮𝐩𝐩𝐥𝐞𝐦𝐞𝐧𝐭𝐬 𝐌𝐚𝐫𝐤𝐞𝐭 𝐑𝐞𝐠𝐢𝐨𝐧𝐚𝐥 𝐈𝐧𝐬𝐢𝐠𝐡𝐭?

The global herbal supplements market is witnessing significant growth across various regions, with North America and Europe being the key players due to the high demand for natural and organic products. In regions like Asia-Pacific, traditional herbal remedies are increasingly being integrated into modern health regimens, further boosting market growth. The rising awareness about wellness, coupled with the growing popularity of herbal supplements in emerging economies, offers substantial opportunities for market expansion. However, regulatory challenges and cultural differences across regions can impact the growth trajectory and market penetration in certain areas.

𝐂𝐮𝐫𝐢𝐨𝐮𝐬 𝐭𝐨 𝐩𝐞𝐞𝐤 𝐢𝐧𝐬𝐢𝐝𝐞? 𝐆𝐫𝐚𝐛 𝐲𝐨𝐮𝐫 𝐬𝐚𝐦𝐩𝐥𝐞 𝐜𝐨𝐩𝐲 𝐨𝐟 𝐭𝐡𝐢𝐬 𝐫𝐞𝐩𝐨𝐫𝐭 𝐧𝐨𝐰: https://www.maximizemarketresearch.com/request-sample/20657/ 

𝐒𝐞𝐠𝐦𝐞𝐧𝐭𝐚𝐭𝐢𝐨𝐧 𝐀𝐧𝐚𝐥𝐲𝐬𝐢𝐬 𝐨𝐟 𝐭𝐡𝐞 𝐇𝐞𝐫𝐛𝐚𝐥 𝐒𝐮𝐩𝐩𝐥𝐞𝐦𝐞𝐧𝐭𝐬 𝐌𝐚𝐫𝐤𝐞𝐭

by Forms

Powders

Syrups

Tablets& Capsules

Others

by Distribution Channel

Pharmaceuticals

Personal Care

by Consumer

Online

Retail Stores

Others

𝐖𝐡𝐨 𝐢𝐬 𝐭𝐡𝐞 𝐥𝐚𝐫𝐠𝐞𝐬𝐭 𝐦𝐚𝐧𝐮𝐟𝐚𝐜𝐭𝐮𝐫𝐞𝐫𝐬 𝐨𝐟 𝐇𝐞𝐫𝐛𝐚𝐥 𝐒𝐮𝐩𝐩𝐥𝐞𝐦𝐞𝐧𝐭𝐬 𝐌𝐚𝐫𝐤𝐞𝐭 𝐰𝐨𝐫𝐥𝐝𝐰𝐢𝐝𝐞?

1. Archer Daniels Midland Company

2. Glanbia PLC

3. Herbalife International of America, Inc.

4. Blackmores Limited

5. Nutraceutical International Corporation

6. Nbty, Inc.

7. Arizona Natural Products

8. Ricola AG

9. Naturalife Asia Co., Ltd.

10. Bio-Botanica Inc

11. Jarrow Formulas, Inc

12. Herbochem

13. Nutrova

14. Third Coast Herb Co.

15. Healthy Origins USA

𝐆𝐞𝐭 𝐃𝐢𝐬𝐜𝐨𝐮𝐧𝐭 𝐎𝐧 𝐓𝐡𝐞 𝐏𝐮𝐫𝐜𝐡𝐚𝐬𝐞 𝐎𝐟 𝐓𝐡𝐢𝐬 𝐑𝐞𝐩𝐨𝐫𝐭 @ https://www.maximizemarketresearch.com/market-report/global-herbal-supplements-market/20657/ 

𝐊𝐞𝐲 𝐎𝐟𝐟𝐞𝐫𝐢𝐧𝐠𝐬:

Past Herbal Supplements Market Size and Competitive Landscape

Herbal Supplements Market Size, Share, Size & Forecast by different segment

Herbal Supplements Market Dynamics – Growth Drivers, Restraints, Opportunities, and Key Trends by region

Herbal Supplements Market Segmentation – A detailed analysis by Product

Competitive Landscape – Profiles of selected key players by region from a strategic perspective

Competitive landscape – Herbal Supplements Market Leaders, Market Followers, Regional player

Competitive benchmarking of key players by region

PESTLE Analysis

PORTER’s analysis

Value chain and supply chain analysis

Legal Aspects of business by region

Lucrative business opportunities with SWOT analysis

Recommendations

𝐄𝐱𝐩𝐥𝐨𝐫𝐞 𝐨𝐮𝐫 𝐭𝐨𝐩-𝐩𝐞𝐫𝐟𝐨𝐫𝐦𝐢𝐧𝐠 𝐫𝐞𝐩𝐨𝐫𝐭𝐬 𝐨𝐧 𝐭𝐡𝐞 𝐥𝐚𝐭𝐞𝐬𝐭 𝐭𝐫𝐞𝐧𝐝𝐬:

♦ Global Biomass Power Generation Market https://www.maximizemarketresearch.com/market-report/global-biomass-power-generation-market/30275/

♦ Global Contract Lifecycle Management Market https://www.maximizemarketresearch.com/market-report/global-contract-lifecycle-management-market/74488/

♦ Global AI Image Recognition Market https://www.maximizemarketresearch.com/market-report/global-ai-image-recognition-market/78287/

♦ Hepatitis C Market https://www.maximizemarketresearch.com/market-report/hepatitis-c-market/188029/

♦ Smart Luggage Market https://www.maximizemarketresearch.com/market-report/smart-luggage-market/188058/

♦ Low Voltage Disconnect Switches Market https://www.maximizemarketresearch.com/market-report/low-voltage-disconnect-switches-market/189107/

♦ Retail Loss Prevention Market https://www.maximizemarketresearch.com/market-report/retail-loss-prevention-market/189144/

𝐂𝐨𝐧𝐭𝐚𝐜𝐭 𝐌𝐚𝐱𝐢𝐦𝐢𝐳𝐞 𝐌𝐚𝐫𝐤𝐞𝐭 𝐑𝐞𝐬𝐞𝐚𝐫𝐜𝐡:

MAXIMIZE MARKET RESEARCH PVT. LTD.

⮝ 3rd Floor, Navale IT park Phase 2,

Pune Banglore Highway, Narhe

Pune, Maharashtra 411041, India.

✆ +91 9607365656

🖂 sales@maximizemarketresearch.com

🌐 www.maximizemarketresearch.com

𝐀𝐛𝐨𝐮𝐭 𝐌𝐚𝐱𝐢𝐦𝐢𝐳𝐞 𝐌𝐚𝐫𝐤𝐞𝐭 𝐑𝐞𝐬𝐞𝐚𝐫𝐜𝐡:

Maximize Market Research is one of the fastest-growing market research and business consulting firms serving clients globally. Our revenue impact and focused growth-driven research initiatives make us a proud partner of majority of the Fortune 500 companies. We have a diversified portfolio and serve a variety of industries such as IT & telecom, chemical, food & beverage, aerospace & defense, healthcare and others.

This release was published on openPR.


Source link

11 11, 2024

Weekly Forex Forecast – 10/11: Bitcoin, NASDAQ 100 (Charts)

By |2024-11-11T12:25:13+02:00November 11, 2024|Forex News, News|0 Comments

Fundamental Analysis & Market Sentiment

I wrote on 3rd November that the best trade opportunities for the week were likely to be:

  • Long of Gold in USD terms following a daily close above $2,787. This did not set up.
  • Long of the S&P 500 Index following a daily close above 5,878. This set up at Wednesday’s close, and the Index rose by a further 1.12% over the remainder of the week.

The weekly gain of 1.12% equals 0.56% per asset.

Last week’s key takeaways were:

  1. US Presidential and Congressional Elections – President Trump won the election surprisingly strongly, winning the popular vote by 2.5% (not a landslide) and all the swing states. Republicans have also taken control of the Senate and look set to retain control of the House, meaning that all branches of government will effectively have Republican majorities. So, it seems as if America is in for some changes in policy, which may boost stock markets, cryptocurrencies, and to a lesser extent, the US Dollar.
  2. US Federal Funds Rate and FOMC Statement – the Fed voted unanimously to cut rates by 0.25%, as was strongly expected and is now holding employment equal to inflation in its calculations. However, it can be said there were no real surprises here.
  3. Bank of England Official Bank Rate, Votes, Monetary Policy Statement and Report – the Bank cut its interest rate by 0.25%, as expected. Governor Bailey took an optimistic tone about inflation continuing to decline slowly. The Pound declined slightly following the release, but it was nothing special.
  4. Reserve Bank of Australia Cash Rate, Rate Statement, and Monetary Policy Statement – as expected, rates were left on hold, with the Bank dodging questions about the timing of future cuts, saying only that inflation remains too high. This seemed to have little influence on the value of the Aussie.
  5. US ISM Services PMI – this was slightly higher than expected, suggesting stronger economic activity in the services sector.
  6. US Unemployment Claims – this was as expected.
  7. Canada Unemployment Rate – this was expected to tick higher, but it remained unchanged, suggesting a fractionally stronger labour market.
  8. New Zealand Unemployment Rate – this fell by more than expected, from 5.0% to 4.8%, suggesting an unexpectedly strong labour market.

The Week Ahead: 11th – 15th November

The coming week’s schedule is shorter but includes two items that have the potential to make a very big impact: data from the USA on CPI (inflation) and PPI (purchasing power index), which will give big clues about the future timing of the Fed’s rate hikes.

  1. US CPI (inflation)
  2. US PPI
  3. US Retail Sales
  4. UK GDP
  5. Australian Wage Price Index
  6. New Zealand Inflation Expectations
  7. UK Claimant Count Change (Unemployment Claims)
  8. Australian Unemployment Rate

Monthly Forecast November 2024

I made no monthly forecast for November, as the long-term trends in the Forex market are too unclear.

Weekly Forecast 11th November 2024

I made no weekly forecast this week, as there were no unusually strong directional price movements over the past week, which is the basis of my weekly trading strategy.

Last week, the Japanese Yen was the strongest major currency, while the Euro was the weakest. However, the number was relatively low, so this is probably not a meaningful statistic.

You can trade these forecasts in a real or demo Forex brokerage account.

Key Support/Resistance Levels for Popular Pairs

Weekly Forex Forecast – 10/11: Bitcoin, NASDAQ 100 (Charts)


US Dollar Index

Last week, the US Dollar Index printed a bullish engulfing candlestick that successfully broke out beyond the resistance level at 104.15. This is a bullish sign, but it should be noted that the candlestick has a large upper wick, showing that the Dollar struggled to hold some of its earlier gains.

The price is above its level from three months ago but below its level from six months ago, suggesting a long-term mixed trend in the greenback, which indicates uncertainty.

It is also worth noting that despite the recent bullish momentum, the price is trading not far from the middle of a consolidating triangle chart pattern. This is suggestive of ultimately ranging behaviour.

This week’s outlook for the US Dollar remains unclear despite President Trump’s election and the near certainty that the Republicans will control both Houses of Congress, which should have strengthened the US Dollar. The Dollar has strengthened, but not as much as we expected. This may be a sign that the Dollar is not going to rise much more.

Be very careful in trading the US Dollar long this week. If the price can establish itself above the triangle pattern’s upper trend line and the horizontal level at 105.81, that would be a decisive bullish sign to respect.

Weekly Forex Forecast – 10/11: Bitcoin, NASDAQ 100 (Charts)

EUR/USD

Last week, the US dollar strengthened due to the decisive Republican victory in the US general election. The Euro has been one of the weakest major currencies. These two factors gave us one of the strongest directional price movements in the Forex market last week in the EUR/USD currency pair. The weekly candlestick closed near its low, and the price reached its lowest level in over 4 months. The price is below its levels from both 3 and 6 months ago, which is my preferred metric for calling a long-term bearish trend.

So, it seems there are plenty of reasons to go short here, but I still see a few reasons to remain cautious:

  1. The shorter-term moving averages are above the longer-term moving averages, suggesting that this could be more of a spike lower than a trend—or at least that this trend is not mature enough to be reliable.
  2. Two bullish inflection points are close by, at $1.0666 and $1.0600. Short trades may be safer below $1.0600.

Weekly Forex Forecast – 10/11: Bitcoin, NASDAQ 100 (Charts)


USD/JPY 151.29

I expected the USD/JPY currency pair to have potential support at ¥151.29.

The H1 price chart below shows how the price action rejected this support level with a large outside bar / engulfing candlestick, marked by the up arrow within the price chart below. This rejection occurred right at the start of the Tokyo session last Wednesday, which can often be a great time to find powerful reversals in the Japanese Yen.

This trade reached a floating profit approximately as large as the risk if the stop was placed just below the swing low, which was the low of the week.

I am not sure that this currency pair is respecting technical factors much right now. It seems to be pushed around by macro factors rather than its own parameters, so it is probably not a good currency pair for technical traders now. However, there is volatility left in it, so day traders could find catching swings here an interesting project.

Weekly Forex Forecast – 10/11: Bitcoin, NASDAQ 100 (Charts)

Bitcoin

Bitcoin, even in US Dollar terms, gained strongly over the past week, getting a significant boost from the election victories of President Trump and Congressional Republicans in both Houses. Republicans are seen as more likely to favour lighter regulation of cryptocurrency, so their ascendancy has boosted both crypto in particular and risk sentiment in general, which also helps a risky asset like Bitcoin.

Bitcoin traded over the weekend, and on Saturday and Sunday, it continued rising to new record highs. The screenshot below was taken on Sunday, and we can see there is hardly any upper wick on this candlestick, which is a very bullish sign, especially as the price is trading firmly within blue sky and the candlestick is relatively large.

There is every reason to be bullish on Bitcoin right now, and I am long of Bitcoin. However, I noticed that Bitcoin ETFs do not seem to be getting the full gain made by the underlying, not in some way, so if you can afford it, you might want to buy Bitcoin futures instead of a Bitcoin ETF or even spot Bitcoin itself if you can. There are Bitcoin micro futures available on the CME, which are only sized at 10% of the value of one Bitcoin.

Weekly Forex Forecast – 10/11: Bitcoin, NASDAQ 100 (Charts)

NASDAQ 100 Index

US stock markets have been in bullish territory for quite a while, but the NASDAQ 100 Index has been mostly consolidating for a few months after making a record high early in the year on the back of strong gains. In recent years, it has been excellent for many major tech stocks that are members of this index.

The bullish breakout led to new record highs after the Republican clean sweep in the US general election. In 2016, when President Trump was first elected, the rally in the broader stock market triggered by his election was bigger than the rally seen in the tech sector. However, that may be different now as Trump is seen as having become friendlier to the tech sector—this might also be connected to the fact that Elon Musk is going to play a role in the new administration.

There is almost no upper wick on the weekly candlestick here, and the candlestick is of a relatively large size, so there seems to be every reason to be long of this Index.

I see the NASDAQ 100 Index as a buy.

Weekly Forex Forecast – 10/11: Bitcoin, NASDAQ 100 (Charts)

S&P 500 Index

I wrote last week that this major, broad US stock market Index would likely make a bullish breakout to new record high prices if Trump won the US Presidential election. This was a good, accurate call.

The election of a new President has historically triggered quite large rallies in the US stock market. President Trump is famously pro-business, and Republicans look extremely likely to have captured both Houses of Congress, so we may be in for a renewed rally in this Index. Undoubtedly, the election results pushed the price strongly into blue sky.

Interestingly, the NASDAQ 100 Index rose slightly more than the broader S&P 500 Index. This suggests that a big rally might be more skewed towards tech stocks, but it is also true the NASDAQ 100 is just more volatile, so this differential might not be very significant.

There is almost no upper wick on the weekly candlestick here, and the candlestick is of a relatively large size, so there seems to be every reason to be long of this Index.

I see the S&P 500 Index as a buy.

Weekly Forex Forecast – 10/11: Bitcoin, NASDAQ 100 (Charts)

Bottom Line

I see the best trading opportunities this week as

  • Long of Bitcoin in USD terms.
  • Long of the S&P 500 Index.
  • Long of the NASDAQ 100 Index.

Ready to trade our Forex weekly analysis? Check out our list of the top 10 Forex brokers in the world.

Source link

11 11, 2024

SOL Surges as Network Outpaces ETH – $50 Next?

By |2024-11-11T12:20:38+02:00November 11, 2024|Crypto News, News|0 Comments

    Summary:

  • SOL climbs near $48 as network activity outpaces Ethereum. Will SOL break $50 resistance? Key chart analysis and outlook.

Solana (SOL) is currently priced at $210.25 after hitting $212.55 earlier today. This surge follows strong network performance and increased investor interest, positioning SOL as one of the top-performing cryptocurrencies of the week. With momentum building, the big question is whether Solana can maintain this trajectory and hit the $220 mark.

Chart Analysis: Key Levels to Watch for SOL

The daily chart for Solana reveals a robust uptrend, with SOL breaking above key resistance levels. Here’s a breakdown of the technical outlook:

  • Support levels:
    • $186.87: A strong support zone, previously acting as resistance, now turned into a key level for bulls.
    • $181.58: The 20-day EMA, which offers dynamic support as the trend remains bullish.
    • $166.97: The 50-day EMA, providing additional backing in case of a deeper pullback.
  • Resistance levels:
    • $212.55: The immediate resistance, marked by today’s intraday high.
    • $220.00: A psychological and technical barrier, with potential to trigger further bullish momentum.
    • $230.00: A long-term resistance zone, last tested in mid-2022.
SOL Surges as Network Outpaces ETH –  Next?
Solana Daily Chart Analysis

What’s Driving Solana’s Momentum?

Solana’s surge is fueled by both technical robustness and fundamental expansion. Recent events, such as exceeding Ethereum in daily fees and a rise in institutional adoption, have strengthened market sentiment regarding SOL.

Can Solana Hit $220?

The existing momentum indicates that hitting the $220 mark is achievable if bulls keep their dominance. Nevertheless, traders must be alert for possible pullbacks, especially if Bitcoin’s surge begins to exhibit signs of deceleration.

Source link

11 11, 2024

Yoga Stretches For Tired Legs and Feet

By |2024-11-11T12:18:11+02:00November 11, 2024|Fitness News, News|0 Comments


Do your legs and feet feel stiff and tired after a long day? Try these yoga stretches for instant relief!

Photographer Irving Martinez

It’s normal for your legs and feet to feel tired and stiff after a long day, even if you didn’t workout, or put obvious strain on them. Most of us feel tight and stiff due to our lifestyle, and simple daily habits that we repeat. Sitting for long periods throughout the day and wearing restrictive shoes can both play a part in how our lower body feels by the end of the day.

Let’s imagine what happens with our legs when we sit for long periods. When seated, your legs are flexed at the hip; the main muscle that does that is your hip flexors. These muscles, which go from your back starting at T12 across the hip to the front of the upper thigh, shorten or contract in the seated position. Because you’re not moving or bearing weight your muscles don’t have to do much work, yet they are in contraction. These shortened muscles become tense or high tone, known as hypertonic and it can make your muscles tired and over time become weak and tight. During the day, it’s a good idea to set a reminder to stand up for 5 minutes every hour, and when you’re sitting down for prolonged periods move positions to avoid hypertonic muscles.

Yoga Stretches For Tired Legs and Feet

Let’s talk about our feet. Do you ever take off your shoes at the end of the day and it’s like your feet are screaming at you THANK YOU! Did you know the soles of your feet are a thick band of tissue called the plantar fascia? Your fascia can be reshaped, so when we wear shoes all day we constrict the movement of our plantar fascia, thereby making them feel tight, the tighter the shoe, the more stiff your feet will feel. The good news is fascia is malleable, so giving yourself a foot massage, taking your fingers between your toes to stretch the tissue, or rolling your foot on a tennis ball is a great way to massage your plantar fascia.

Try this yoga routine after a long day to release tension from your leg muscles and stretch your feet. This will help not only lengthen the tired and tight muscles of your lower body but also increase circulation that has been limited by a sedentary lifestyle or from standing most of the day.

Photographer Sofia Fernandez

Thunderbolt Pose and Toe Stands

Sit in a kneeling position with your hips on top of your heels. You can sit on a blanket for comfort, or sit on a block to relieve any knee discomfort. Take a deep inhale and reach the crown of your head up to lengthen and align your spine. Place your hands on top of your thighs. This gentle posture stretches the quads, front of the shinbone, and tops of the feet. Hold for 1 minute.

Include this variation of thunderbolt with toes curled under to stretch the soles of the feet.

Add a little more intensity with this toe-stand variation. Widening the knees will add an inner thigh stretch

Gorilla Pose

Photographer Irving Martinez

From a standing position feet hip’s distance apart, slide the palm of your hands underneath your feet until your toes reach your wrist crease. Bend your knees as much as needed to get the palms underneath your feet. Allow your upper back to round and stretch. This posture stretches the entire posterior, or backside of your body including your back, gluteus maximus, hamstrings, calves, Achilles heel, and soles of feet. You can gently shift the weight of your feet on your hands to get a massage of both your feet and hands. Hold for 1 minute.

Lizard Lunge

Photographer Irving Martinez

Place your front foot as wide as your outer hip. Bend your front leg knee until it stacks over your ankle. Extend your back leg behind you and allow your hips to sink. Your arms are to the inside of your front bent leg you can stay up on your hands, or for a deeper stretch place your forearms down parallel. Reach your sternum forward to lengthen the spine. This hip opener stretches your inner thighs, hip flexors, and groin. Hold for 1-3 minutes each side.

Reclined Hero’s Pose

Photographer Irving Martinez

Kneel on the floor thighs parallel, and widen your feet out until your heels brush against your outer hips.. Sit hips down in between feet. Spread each toe into the floor. Thighs roll inward. Recline your torso onto the ground. You can also lay on a pillow or bolster if it’s more comfortable. If this stretch is too much for your knees, extend one leg straight and then switch sides. Stretches Quads, hip flexors, knees, ankles, and tops of feet. Hold for 1 minute.

Photographer Irving Martinez

Cobbler’s Pose

From a seated position bring the soles of your feet toward each other and open your knees wide. Rotate your pelvis slightly forward so you’re seated on your sit-bones, and elevate on a blanket if needed. Hands gently grip the top of ankles. Reach the crown of your head up to lengthen the spine, and stack your shoulders over your hips. As your inner thighs stretch and knees widen open your feet. Seated evenly on sit bones. Stretches groin and inner thighs. Hold for 1 minute.

Bio -Cathy Madeo

Cathy Madeo is a yoga expert, entrepreneur, and social media influencer. She founded Cathy Madeo Yoga, an online yoga school where 1000s of students from all over the world take her online yoga series and training. She’s graduated 450 yoga teachers in over 45 countries and counting.

Photographer Irving Martinez

Learn more about Cathy here:
https://www.cathymadeoyoga.com/

And follow her on:
Instagram: https://www.instagram.com/cathymadeoyoga
Youtube: https://www.youtube.com/c/CathyMadeoYoga
TikTok: https://www.tiktok.com/@cathymadeoyoga

Disclaimer
The Content is not intended to be a substitute for professional medical advice, diagnosis, or treatment. Always seek the advice of your physician or other qualified health provider with any questions you may have regarding a medical condition.


Source link

11 11, 2024

Association between dietary intake of iron and heart failure among American adults: data from NHANES 2009–2018 | BMC Nutrition

By |2024-11-11T10:49:13+02:00November 11, 2024|Dietary Supplements News, News|0 Comments


Study population

The NHANES is a nationally representative survey that assesses the health and nutritional status of non-institutionalized civilians in the U.S. It includes demographic data, dietary data, physical examinations, and health-related information. It combines interviews initially conducted at the participant’s home, followed by health examinations conducted at the Mobile Examination Center. The sampling methods, weights, and details of data collection can be found on its official website [15]. To ensure the representativeness and validity of our research findings, we considered the sampling and weighting procedures in our study. All analyses used weighted samples (“wtdr2d”). Furthermore, stratification and primary sampling units (PSUs) were incorporated into our analysis to account for the complex survey design of the NHANES. Stratification ensures that subgroups within the population are adequately represented, whereas PSUs help maintain the integrity of the sampling frame and reduce sampling error. By combining these factors, we were able to generate estimates that are more accurately representative of the U.S. population. The present study was based on the analysis of NHANES data from 2009 to 2018. The NHANES research plan was approved by the Ethics Review Committee of the National Center for Health Statistics (NCHS). Prior to the interview and inspection steps, each participant signed an informed consent form.

Among the 49,693 participants in the NHANES database from 2009 to 2018, 28,835 were adults (age ≥ 20), and 22,119 had complete dietary iron data and HF questionnaire data. Among these 22,119 subjects, 727 were excluded because their iron intake exceeded the tolerable upper intake level of > 45 mg/day [16, 17]. In addition, we excluded pregnant and breastfeeding populations because pregnancy and breastfeeding might alter indicators such as dietary intake and body weight. An extremely small number of missing covariates, such as educational level and smoking were also excluded. Our study ultimately included 20,853 American adult participants. (Fig. 1)

Fig. 1

Flow chart of participant selection. Abbreviations: NHANES, National Health and Nutrition Examination Survey

Assessment of dietary iron intake

Dietary iron intake was assessed via two 24-h dietary recall interviews. The Mobile Examination Center was the site of the initial dietary interview, and the second interview was conducted telephonically after 3–10 days. Each participant’s total daily energy and nutrient intake from food and beverages were calculated, along with data indicating whether their food intake was normal. These details were compiled into the total nutrient intake file for analysis. The 24-h dietary supplement use section was used to obtain information from NHANES participants on the type and amount of dietary supplements consumed 24 h before the interview and to estimate the amount of nutrients consumed from these dietary supplements to estimate nutrient intake. In accordance with the NHANES protocol, the mean total nutrient intake from two 24-h dietary recall interviews and the mean total dietary supplements from two 24-h dietary supplement uses were combined to assess nutrient intake as accurately as possible. Only participants who provided complete data for both 24-hour dietary recall interviews and two 24-hour dietary supplement uses were included in the study. For these participants, the average of the two assessments of total dietary iron intake was calculated and used in the analysis. In this study, dietary iron intake was further divided into quartiles.

Assessment of HF

In accordance with previous NHANES-based studies, participants who were asked in the health questionnaire “Has a doctor or other health professional ever told you that you had congestive HF?,” and those who answered “yes” were considered to have HF [18].

Covariates

We screened nine possible confounding factors related to HF and dietary iron: age, gender, race/ethnicity, educational level, smoking, alcohol consumption, body mass index (BMI), hypertension, and diabetes mellitus (DM). Ethnicity was divided into five categories: non-Hispanic white, non-Hispanic black, Mexican American, other Hispanics, and others. Educational level was divided into three categories: college or above, high school or equivalent, and less than high school. The degree of smoking was classified according to the following indicators: [1] never: smoked fewer than 100 cigarettes in life; [2] former: smoked more than 100 cigarettes in life but did not smoke at all; [3] now: has smoked more than 100 cigarettes in life and smokes some days or every day. The daily alcohol consumption data are the average of the alcohol consumption data from the two 24-hour dietary recall interviews. BMI was calculated by dividing weight in kilograms by the square of height in meters and then rounding it to one decimal place. Hypertension was defined when an individual met at least one of the following three criteria: [1] used antihypertensive drugs [2], was diagnosed with high blood pressure by a doctor, and [3] had a mean blood pressure higher than 130/80 mmHg. The average blood pressure was obtained as described in the NHANES. It was calculated via the following protocol: the diastolic reading with zero was not used to calculate the diastolic average. If all diastolic readings were zero, the average was zero. If only one blood pressure reading was obtained, it was considered the average. In the case of more than one blood pressure reading, the first reading was always excluded from the average. There were four types of diabetes: none, impaired glucose tolerance, impaired fasting glucose, and DM. DM was defined in this article as meeting at least one of the following criteria: having been diagnosed with diabetes by the doctor, glycosylated hemoglobin type A1C (HbA1c) (%) ≥6.5, fasting glucose (mmol/L) ≥7.0, random blood glucose (mmol/L) ≥11.1, 2-h oral glucose tolerance test blood glucose (mmol/L) ≥11.1, or the use of diabetes-related medication or insulin. BMI was measured by experts using routine physical examination techniques.

Statistical analyses

We used the R programming language (version 4.3.2) for all the statistical analyses. The statistical significance was determined as two-tailed, with P < 0.05. The analysis method was similar to that used in a previous study [19] as follows: Participants were divided into four groups according to the quartile of iron intake (Q1–Q4). The continuous variables associated with the covariates are expressed as the means (standard errors), and the categorical variables are expressed as quantities (percentages). The baseline differences between the continuous and categorical variables were assessed using ANOVA and χ2 tests, respectively. We adjusted the weights in the analysis to prevent oversampling and reduce non-response. Univariate and multivariate logistic regression models were used to analyze the relationships between HF and iron intake in all participants and different subgroups, taking covariates into account, and were divided into three models: the model with unadjusted covariates; Model 1 adjusted for gender, age, race and education level; and Model 2 was fully adjusted for covariates. To assess the dose‒response relationship between dietary iron intake and heart failure, restricted cubic spline (RCS) was used. In addition, a stratified analysis was performed, taking into account age, gender, ethnicity, smoking, alcohol consumption, hypertension and DM.


Source link

11 11, 2024

The bearish outlook remains in play near 1.2900: Analytics and Market news from 11 November 2024 05:17

By |2024-11-11T10:24:20+02:00November 11, 2024|Forex News, News|0 Comments

  • GBP/USD softens to around 1.2910 in Monday’s early European session.  
  • The negative view of the pair prevails below the 100-day EMA, with the bear RSI indicator. 
  • The initial support level for the pair emerges at 1.2875; the immediate resistance level is located at 1.2983. 

The GBP/USD pair weakens to near 1.2910 during the early European session on Monday. The stronger US Dollar (USD) following Donald Trump’s election win continues to undermine the major pair as traders expect the inflationary impulses will keep the US Federal Reserve (Fed) from cutting rates as much as they otherwise would have. 

On the other hand, the Bank of England (BoE) reiterated that “a gradual approach to removing policy restraint remains appropriate. Monetary policy will need to continue to remain restrictive for sufficiently long.” Less dovish remarks from the UK central bank could help limit the INR’s losses in the near term. 

According to the daily chart, GBP/USD keeps the bearish vibe unchanged on the daily timeframe, with the price holding below the key 100-day Exponential Moving Average (EMA). Furthermore, the downward momentum is reinforced by the 14-day Relative Strength Index (RSI), which is located below the midline around 43.85, indicating the path of least resistance is to the downside. 

The initial support level for GBP/USD emerges at 1.2875, the low of November 7. Further south, the next contention level is located in the 1.2850-1.2840 zone, representing the lower limit of the Bollinger Band and the low of October 31. 

On the bright side, the 100-day EMA at 1.2983 acts as an immediate resistance level for the major pair. The crucial upside barrier is seen at the 1.3000 psychological level. A decisive break above this level could see a rally to 1.3048, the high of November 6. 

GBP/USD daily chart

Pound Sterling FAQs

The Pound Sterling (GBP) is the oldest currency in the world (886 AD) and the official currency of the United Kingdom. It is the fourth most traded unit for foreign exchange (FX) in the world, accounting for 12% of all transactions, averaging $630 billion a day, according to 2022 data. Its key trading pairs are GBP/USD, also known as ‘Cable’, which accounts for 11% of FX, GBP/JPY, or the ‘Dragon’ as it is known by traders (3%), and EUR/GBP (2%). The Pound Sterling is issued by the Bank of England (BoE).

The single most important factor influencing the value of the Pound Sterling is monetary policy decided by the Bank of England. The BoE bases its decisions on whether it has achieved its primary goal of “price stability” – a steady inflation rate of around 2%. Its primary tool for achieving this is the adjustment of interest rates. When inflation is too high, the BoE will try to rein it in by raising interest rates, making it more expensive for people and businesses to access credit. This is generally positive for GBP, as higher interest rates make the UK a more attractive place for global investors to park their money. When inflation falls too low it is a sign economic growth is slowing. In this scenario, the BoE will consider lowering interest rates to cheapen credit so businesses will borrow more to invest in growth-generating projects.

Data releases gauge the health of the economy and can impact the value of the Pound Sterling. Indicators such as GDP, Manufacturing and Services PMIs, and employment can all influence the direction of the GBP. A strong economy is good for Sterling. Not only does it attract more foreign investment but it may encourage the BoE to put up interest rates, which will directly strengthen GBP. Otherwise, if economic data is weak, the Pound Sterling is likely to fall.

Another significant data release for the Pound Sterling is the Trade Balance. This indicator measures the difference between what a country earns from its exports and what it spends on imports over a given period. If a country produces highly sought-after exports, its currency will benefit purely from the extra demand created from foreign buyers seeking to purchase these goods. Therefore, a positive net Trade Balance strengthens a currency and vice versa for a negative balance.


Source link

11 11, 2024

BTC reaches a new all-time high near $81,800

By |2024-11-11T10:19:29+02:00November 11, 2024|Crypto News, News|0 Comments

  • Bitcoin’s price reaches a new all-time high of $81,846 on Monday, following a rally of over 17% the previous week.
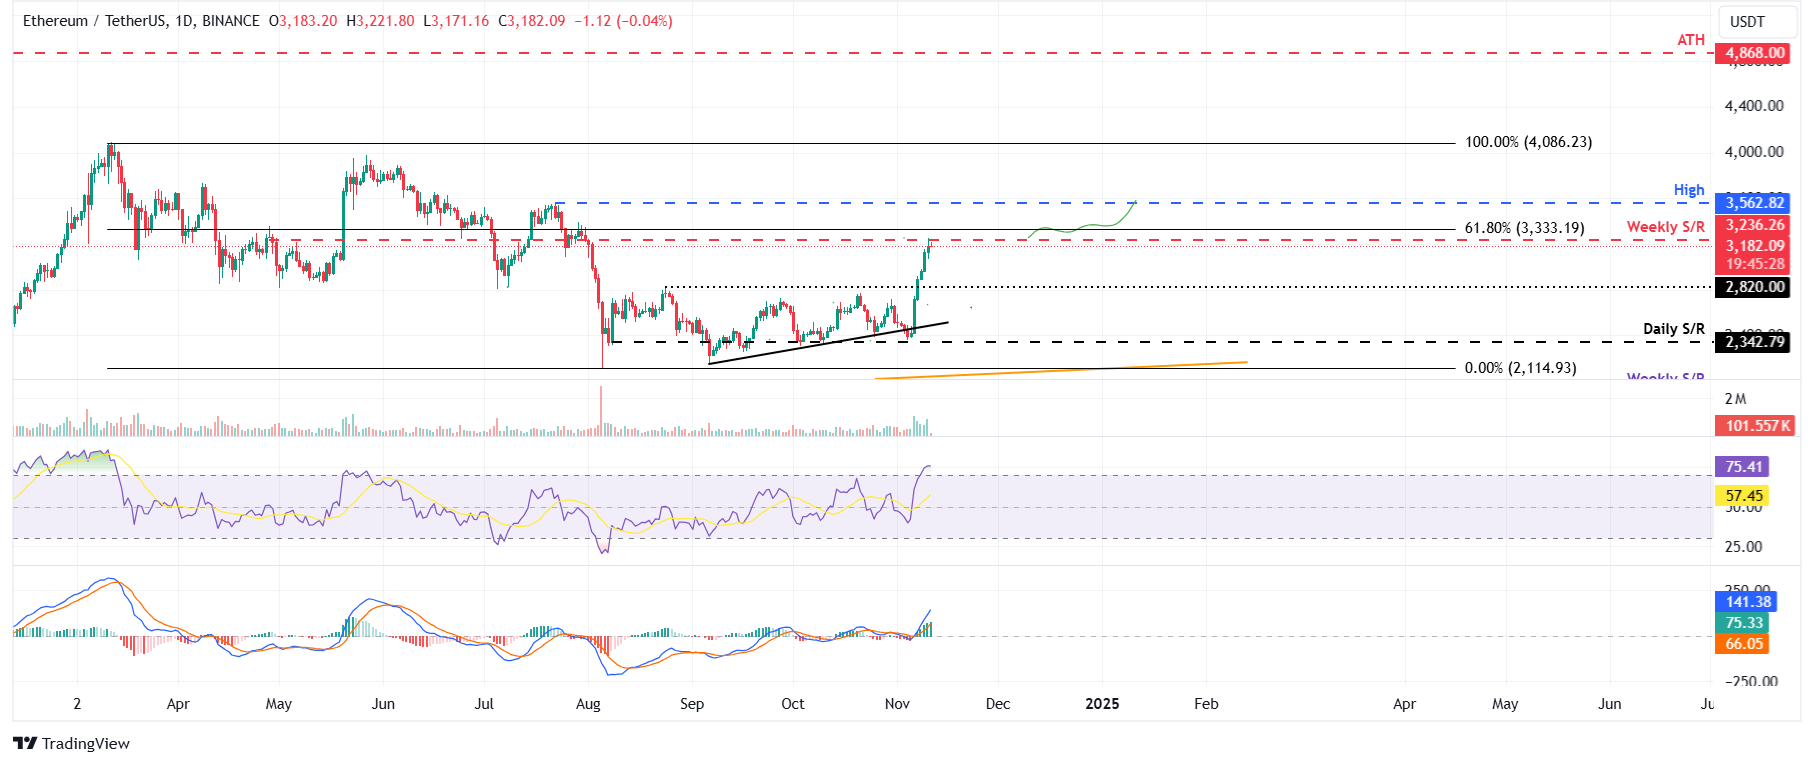
  • Ethereum’s price is nearing its weekly resistance at $3,236, and a firm close above it would continue its rally.
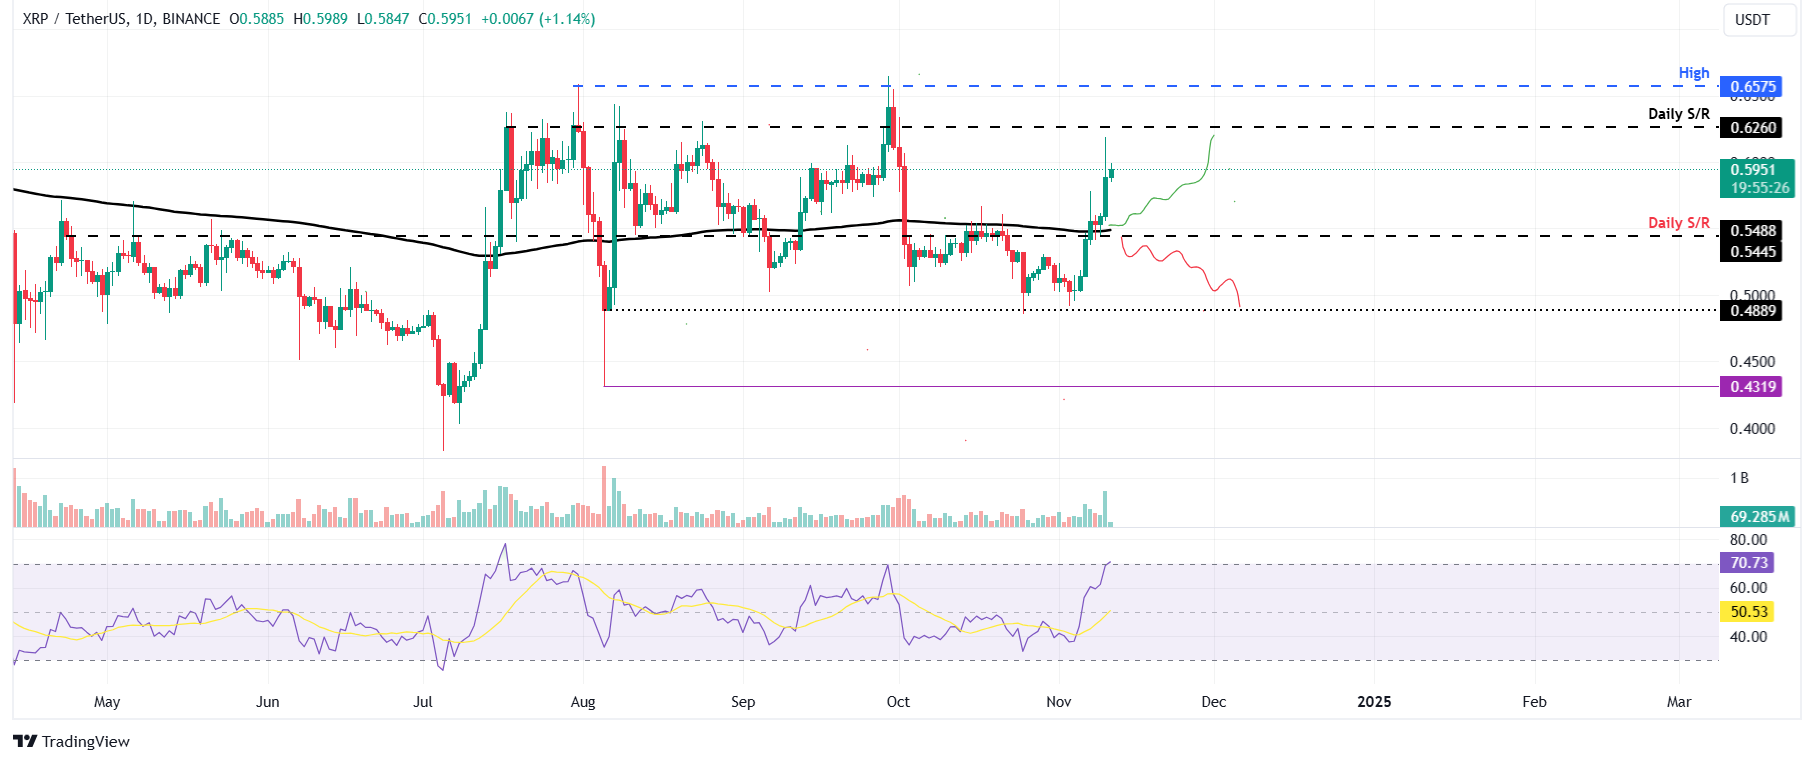
  • Ripple price is approaching its daily resistance at $0.626; a close above this level could signal the continuation of its rally.

Bitcoin (BTC) reached a new all-time high of $81,846 on Monday, while Ethereum (ETH) and Ripple (XRP) are following suit and nearing their crucial resistance levels; a strong close above these levels could fuel further rally for both assets.

Bitcoin bulls eye for $83,000 

Bitcoin reached an all-time high (ATH) of $81,500 on Sunday last week after rallying over 17% following Donald Trump’s decisive victory in the US presidential election. At the time of writing on Monday, it reaches a new ATH of $81,846.

If BTC continues its upward momentum, it would extend the rally to retest its 161.8% Fibonacci extension level (drawn from July’s high of $70,079 to August’s low of $49,072) at $83,062.

The Relative Strength Index (RSI) stands at 78, trading above its overbought level of 70. Traders should be cautious because the chances of a price pullback are increasing. If RSI exits overbought territory, it would give a clear selling signal. Another possibility is that the rally continues, and the RSI remains above the overbought level.

BTC/USDT daily chart

However, if BTC closes below $78,000, it could extend the decline and retest its key daily support at $73,072.

Ethereum price is poised for a rally if it closes above $3,200 

Ethereum’s price broke above the daily resistance level of $2,820 on Thursday and rallied over 7.7% until Sunday, retesting its weekly resistance at $3,236. At the time of writing on Monday, it trades slightly below $3,182.

If ETH closes above the weekly resistance at $3,236, it would extend the rally by 9.8% to retest its July 22 high of $3,562.

The RSI stands at 75, trading above its overbought 70, like Bitcoin’s. 

ETH/USDT daily chart

ETH/USDT daily chart

If the weekly resistance continues to hold as resistance, ETH would decline to retest its next daily support at $2,820.

Ripple price shows potential for a rally ahead

Ripple price broke above the daily resistance level at $0.544 and its 200-day Exponential Moving Average (EMA) at $0.548 on Thursday and rallied over 6.3% in three days. As of Monday, it trades slightly above around $0.595.

If XRP continues its upward momentum, it could extend the rally to retest its daily resistance at $0.626. A successful close above this level could extend an additional rally of 4% to retest its July 31 high of $0.657.

The RSI stands at 70, around its overbought level. If the RSI tilts down, traders should be cautious because the chances of a price pullback increase.

XRP/USDT daily chart

XRP/USDT daily chart

However, if the 200-day EMA at $0.548 fails, XRP could extend the decline to retest its next key support at $0.488.

Bitcoin, altcoins, stablecoins FAQs

Bitcoin is the largest cryptocurrency by market capitalization, a virtual currency designed to serve as money. This form of payment cannot be controlled by any one person, group, or entity, which eliminates the need for third-party participation during financial transactions.

Altcoins are any cryptocurrency apart from Bitcoin, but some also regard Ethereum as a non-altcoin because it is from these two cryptocurrencies that forking happens. If this is true, then Litecoin is the first altcoin, forked from the Bitcoin protocol and, therefore, an “improved” version of it.

Stablecoins are cryptocurrencies designed to have a stable price, with their value backed by a reserve of the asset it represents. To achieve this, the value of any one stablecoin is pegged to a commodity or financial instrument, such as the US Dollar (USD), with its supply regulated by an algorithm or demand. The main goal of stablecoins is to provide an on/off-ramp for investors willing to trade and invest in cryptocurrencies. Stablecoins also allow investors to store value since cryptocurrencies, in general, are subject to volatility.

Bitcoin dominance is the ratio of Bitcoin’s market capitalization to the total market capitalization of all cryptocurrencies combined. It provides a clear picture of Bitcoin’s interest among investors. A high BTC dominance typically happens before and during a bull run, in which investors resort to investing in relatively stable and high market capitalization cryptocurrency like Bitcoin. A drop in BTC dominance usually means that investors are moving their capital and/or profits to altcoins in a quest for higher returns, which usually triggers an explosion of altcoin rallies.


Source link

Go to Top