The XRP price has come under the spotlight following Ripple’s recent $250 million XRP transfer. This comes amid bullish predictions for the coin, with analysts saying that its price could enjoy a parabolic rally following Donald Trump’s win.
The XRP Price At Risk With Ripple’s $250 Million Transfer
The XRP price is at risk of a decline following Ripple’s transfer of $250 million worth of XRP to an unknown wallet. Onchain data shows that the crypto firm transferred 470 million XRP to this wallet (rP4X2…sKxv3). This unknown wallet has since transferred 100 million XRP to another wallet (rhWt2…E32hk).
The purpose of the $250 million transfer remains unclear. However, it could relate to Ripple’s On-Demand Liquidity (ODL) services or the ongoing SEC appeal case.
This development comes just a day after XRP whales moved $814 million, indicating whale accumulation. While the Ripple transfer is unlikely to impact the XRP price since it will likely be done over the counter (OTC) if it is a potential sale, it could still create a bearish sentiment among XRP investors.
However, crypto analysts are confident that XRP is currently in bullish territory following Donald Trump’s win in the US presidential elections. The coin could surge up to 3,336% as crypto analyst StephIsCrypto predicted a major above $2 following Trump’s victory.
A Price Surge Above $20 By Year-End
In an X post, Crypto analyst Amonyx made a bold prediction, stating that the XRP price will rise above $20 by year-end. In another X post, the analyst suggested that he was confident that this price surge would happen with the US SEC chair Gary Gensler set to be removed following Donald Trump’s victory.
Gensler’s removal is bullish for the XRP price because he has spearheaded the long-running legal battle against Ripple. The legal battle could have negatively impacted XRP all this time, creating doubts in investors’ minds.
However, with Gensler gone and the Ripple SEC lawsuit likely to end, investors could again become bullish on XRP and look to invest more in the crypto. Crypto analyst Ross Vandermeer also predicted that the XRP price could eventually rise to $1,000 thanks to Donald Trump’s US election victory.
Ripple CEO Brad Garlinghouse recently called on the US president-elect to fire Gary Gensler on day 1, just like he promised. Meanwhile, Ripple chief legal officer (CLO) Stuart Alderoty urged Trump to end the regulation-by-enforcement approach to position the US as the crypto capital.
✓ Share:
Boluwatife Adeyemi
Boluwatife Adeyemi is a well-experienced crypto news writer and editor who has covered topics that cut across DeFi, NFTs, smart contracts, and blockchain interoperability, among others. Boluwatife has a knack for simplifying the most technical concepts and making it easy for crypto newbies to understand. Away from writing, He is an avid basketball lover and a part-time degen.
Disclaimer: The presented content may include the personal opinion of the author and is subject to market condition. Do your market research before investing in cryptocurrencies. The author or the publication does not hold any responsibility for your personal financial loss.
Silver breaks below key support levels, including 50-day SMA at $31.27.
Daily close below $31.00 may lead to further decline toward 100-day SMA at $30.23.
Resistance levels to watch: July 11 high at $31.75 and May 20 peak at $32.51.
Silver price slumped sharply on Wednesday after US President Donald Trump wins the 2024 presidential election. Additionally, the Republican party sweep seems likely as they hold the majority in the Senate, while the House of Representatives is still early to be called. The XAGU/USD trades at $31.16, down over 4.50%.
XAG/USD Price Forecast: Technical outlook
Silver’s price uptrend remains in play, even though Trump’s victory boosted the Greenback. Consequently, the XAG/USD tumbled below key support levels, including the 50-day Simple Moving Average (SMA) at $31.27, which opened the door to hit a daily low of $30.84.
If XAG/USD achieves a daily close below $31.00, it could trigger a potential slump to the 100-day SMA at $30.23. If surpassed, the next stop would be the $30.00 figure.
On the upside, the next key resistance would be the July 11 high at $31.75. A breach of the latter will expose $32.00, followed by May’s 20 peak at $32.51.
XAG/USD Price Chart – Daily
Silver FAQs
Silver is a precious metal highly traded among investors. It has been historically used as a store of value and a medium of exchange. Although less popular than Gold, traders may turn to Silver to diversify their investment portfolio, for its intrinsic value or as a potential hedge during high-inflation periods. Investors can buy physical Silver, in coins or in bars, or trade it through vehicles such as Exchange Traded Funds, which track its price on international markets.
Silver prices can move due to a wide range of factors. Geopolitical instability or fears of a deep recession can make Silver price escalate due to its safe-haven status, although to a lesser extent than Gold’s. As a yieldless asset, Silver tends to rise with lower interest rates. Its moves also depend on how the US Dollar (USD) behaves as the asset is priced in dollars (XAG/USD). A strong Dollar tends to keep the price of Silver at bay, whereas a weaker Dollar is likely to propel prices up. Other factors such as investment demand, mining supply – Silver is much more abundant than Gold – and recycling rates can also affect prices.
Silver is widely used in industry, particularly in sectors such as electronics or solar energy, as it has one of the highest electric conductivity of all metals – more than Copper and Gold. A surge in demand can increase prices, while a decline tends to lower them. Dynamics in the US, Chinese and Indian economies can also contribute to price swings: for the US and particularly China, their big industrial sectors use Silver in various processes; in India, consumers’ demand for the precious metal for jewellery also plays a key role in setting prices.
Silver prices tend to follow Gold’s moves. When Gold prices rise, Silver typically follows suit, as their status as safe-haven assets is similar. The Gold/Silver ratio, which shows the number of ounces of Silver needed to equal the value of one ounce of Gold, may help to determine the relative valuation between both metals. Some investors may consider a high ratio as an indicator that Silver is undervalued, or Gold is overvalued. On the contrary, a low ratio might suggest that Gold is undervalued relative to Silver.
The Vitamin Shoppe’s parent company has filed for bankruptcy protection in a surprise move that appears to be unrelated to the performance of the retailer of nutritional supplements.
The parent company, known as Franchise Group (FRG) filed for Chapter 11 bankruptcy in a Delaware court, and the filing features a restructuring agreement with the holders of 80% of the company’s debt. In addition to The Vitamin Shoppe, the company also owns Pet Supplies Plus and Buddy’s Home Furnishings.
According to court documents, the company listed almost $2 billion of debt.
The first lien holders have agreed to convert the full value of their notes into equity. They have also committed, subject to court approval, to plow an additional $250 million into the company to maintain liquidity for the restructured company’s brands.
The “announcement to de-lever our balance sheet is a pivotal step forward in enabling our market-leading businesses Pet Supplies Plus, The Vitamin Shoppe and Buddy’s Home Furnishings to realize their full potential,” FRG President and CEO Andrew Laurence said. “Each of these businesses has a demonstrated value proposition and provides great products and services to customers, which they will continue to do seamlessly during this process. Strengthening FRG’s balance sheet will allow us to enhance our support for these businesses as they advance their growth trajectories.”
One of the company’s brands will not survive: American Freight, which is a furniture and appliance retailer.
Strong category performance
As late as July 2024, The Vitamin Shoppe announced a partnership with longtime direct-to-consumer sales platform iHerb, in which The Vitamin Shoppe’s products would be featured on the iHerb platform.
Part of that announcement centered on The Vitamin Shoppe’s dominant position within the sports nutrition category, which is one of the strongest growth areas of the dietary supplement industry. According to Nutrition Business Journal’s 2024 Sports Nutrition and Weight Management Report, in the domestic market alone, sports nutrition supplements sales are estimated to reach $9 billion on 11.6% growth.
At the time of the announcement of the deal, Muriel Gonzalez, The Vitamin Shoppe’s president, said, “Our collection of exclusive brands and products are consistently top sellers across our U.S. business, due to their trusted quality, innovation and value.”
Turmoil at parent company
The seeds of FRG’s problems were planted when the company became a private entity. The Franchise Group was taken private in a $2.6 billion management takeover led by then-CEO Brian Kahn. The deal closed in August 2023 and included financing provided by B. Riley Financial Inc, an investment bank.
However, Kahn stepped down as CEO in January amid a Securites and Exchange Commission investigation of B. Riley Financial over the collapse of a hedge fund known as Prophecy Asset Management. Kahn was replaced by Laurence as FRG CEO.
According to some of the final financial statements filed before the company went private, in December 2022, Franchise Group reported having about 8,500 full-time employees and more than 5,000 part-time workers. The company had reported more than $1 billion in quarterly revenue in early 2023 but also revealed it was carrying more than $1.4 billion in debt.
The Vitamin Shoppe did not respond to a request for comment in time for publication.
The Aussie dollar rallied in the early hours on Tuesday as we continue to see consolidation between the 99.50 yen level below and the 101.50 yen level above.
In general, this is a market that I think continues to see a lot of questions asked about risk appetite, but it’s worth noting that overnight, the Reserve Bank of Australia chose to keep its interest rates level.
So with that, I think there was a little bit of a relief rally in the Australian dollar.
Now, the question is, will risk appetite benefit the Aussie or will people run to the Japanese yen? A move above the 101.50 yen level, I believe, unless it’s a huge move to the upside, perhaps all the way back to the 109 yen level for some time. This is a market that will continue to be noisy, but at this point in time – I suppose that I favor the upside in general.
A Break Down Coming?
If we were to turn around and break down below the 99.50 yen level, then it’s possible that we could go down to the 98.50 yen level, maybe even lower. In general, the interest rate differential between the two countries continues to favor Australia and probably will for the foreseeable future. So, I do think you have a situation where SWAP continues to favor the Aussie. So therefore, carry traders will continue to favor the upside. I have no interest in shorting this pair, at least not at the moment, but we’ll have to wait and see. With the US elections and the inability of Americans to have an election in a 24 hour period, it’s possible that we see a lot of volatility over the next couple of days. Because of this, you need to be cautious about position sizing, as this could be very disruptive over the next few sessions. On its face, this is a market that is looking to determine where it wants to go overall.
Bitcoin soars to a new all-time high of $75,407 on Wednesday as Trump wins the US presidential election.
The technical outlook suggests that BTC’s next target could be the 141.40% Fibonacci extension level above $78,000.
Reports show the so-called Trump trade – long positions in the US Dollar, crypto, and higher Treasury yields – gaining momentum.
Bitcoin (BTC) soared over 7% to a new all-time high of $75,407 on Wednesday as Donald Trump was elected as the 47th President of the United States, the candidate that was seen as more favorable for crypto markets due to his pro-crypto stances.
Technical indicators suggest BTC could head to the next target at the $78,777-$78,955 region, with reports highlighting the growing momentum of the so-called Trump trade, which is based on long positions in the US Dollar (USD), crypto, and higher Treasury yields.
Bitcoin hits fresh all-time high as Trump wins
Bitcoin breaks above the all-time high of $73,777 on Wednesday and soars to a new all-time high of $75,407 as Donald Trump has been elected as the next US president.
Trump’s win in Wisconsin – among other key swing states – put him over the 270 threshold needed to clinch the presidency, according to the Associated Press.
“The ‘Trump trade’ – encompassing long positions in the dollar, crypto, and bets on higher Treasury yields – has gained traction leading up to the election, buoyed by Trump’s lead in prediction markets,” says a report from crypto-asset trading firm QCP.
“USD is gaining due to the market view that Donald Trump’s economic agenda and tariffs will strengthen the US Dollar. This, in turn, is negative for Gold since it is mainly priced and traded in USD. Investors’ preference for other riskier assets, including Bitcoin (BTC) and equities, also sees flows exiting Gold,” says Joaquin Monfort, analyst at FXStreet.
Donald Trump is considered more pro-crypto than Kamala Harris. Trump did great outreach to the crypto industry by speaking at a Bitcoin conference. Trump proposed creating a strategic national Bitcoin stockpile to position the US as a leader in cryptocurrency adoption, announced plans to establish a Bitcoin and crypto presidential advisory council for clearer regulatory guidelines, and made other statements appealing to the industry, including promising to fire Securities and Exchange Commission (SEC) Chair Gary Gensler.
Bitcoin ETFs post outflows, profit-taking increases
Coinglass ETF data shows that US spot Exchange Traded Funds (ETFs) recorded a second day of outflow totaling $657.9 million until Tuesday, hinting at a decline in institutional demand for Bitcoin. Still, the data is backward-looking as it doesn’t reflect yet the results of the US presidential election.
Total Bitcoin Spot ETF Net Inflow chart. Source: Coinglass
Moreover, Santiment’s Network Realized Profit/Loss (NPL) shows that some holders booked some profits, and the indicator spiked from 35.75 million to 909.41 million from Tuesday to Wednesday. This uptick indicates that the holders were, on average, taking profits.
Bitcoin Price Forecast: New all-time high of $78,777 on the cards
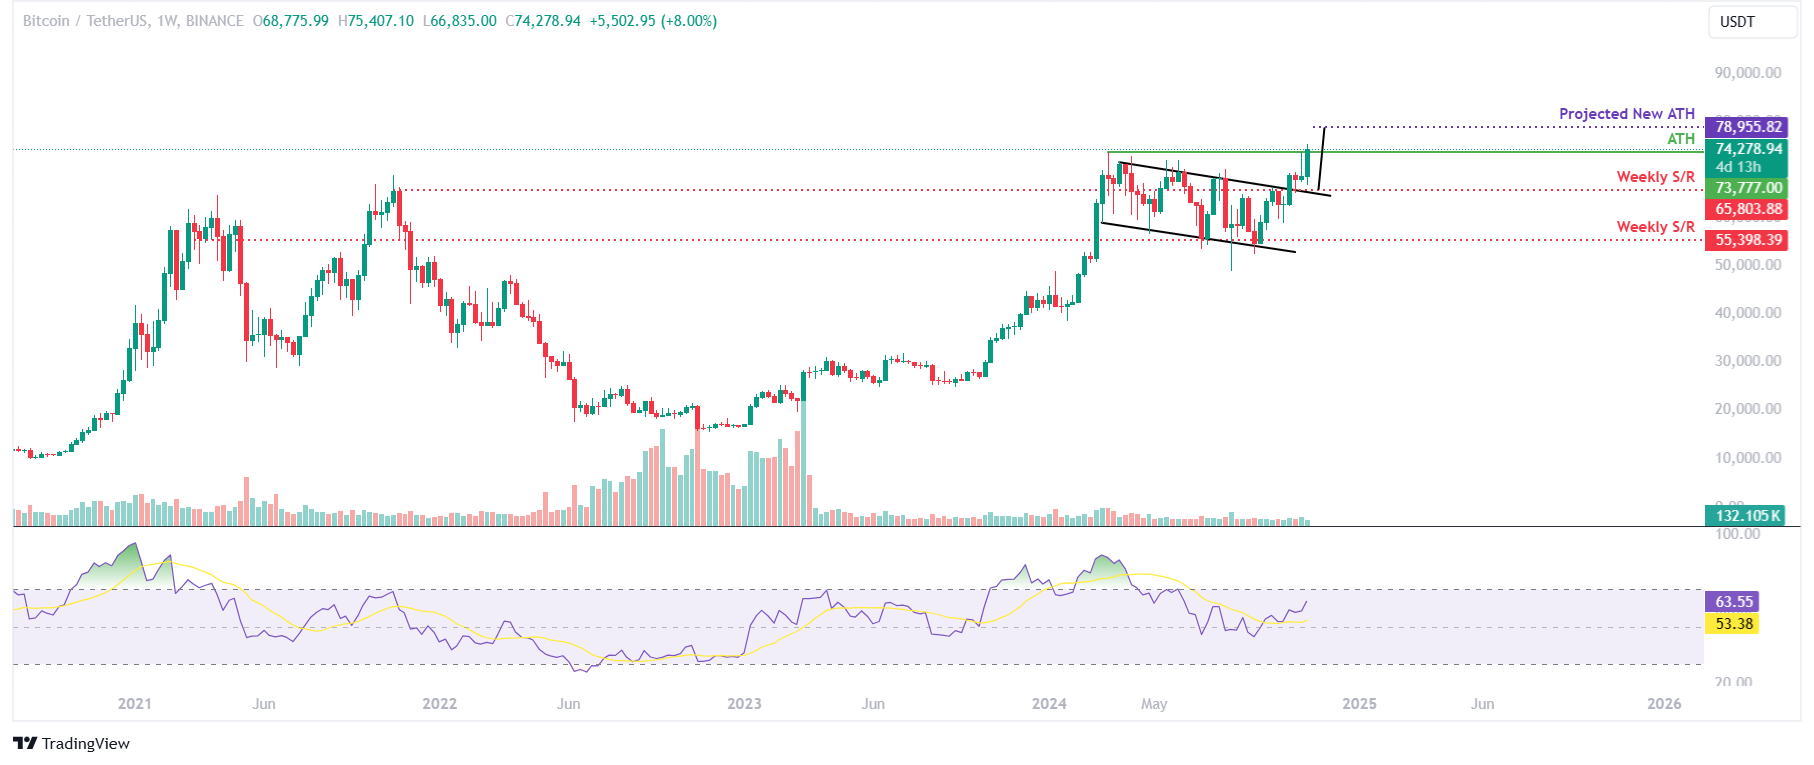
Bitcoin’s weekly chart shows that the biggest crypto asset by market capitalization broke above the downward-slopping parallel channel pattern and successfully retested the breakout level at around $67,800 in mid-October. It rallied but was rejected around its all-time high of $73,777 last week. As of this week, it continues to rally, breaking above its ATH and forming a new one at $75,407.
If BTC continues to rally, the pattern’s technical target (obtained by measuring the distance between the two trendlines and extrapolating it higher) projects a new ATH of $78,955.
The Relative Strength Index (RSI) momentum indicator on the weekly chart trades at 63, above its neutral level of 50 and still far below overbought conditions, suggesting bullish momentum is gaining traction.
BTC/USDT weekly chart
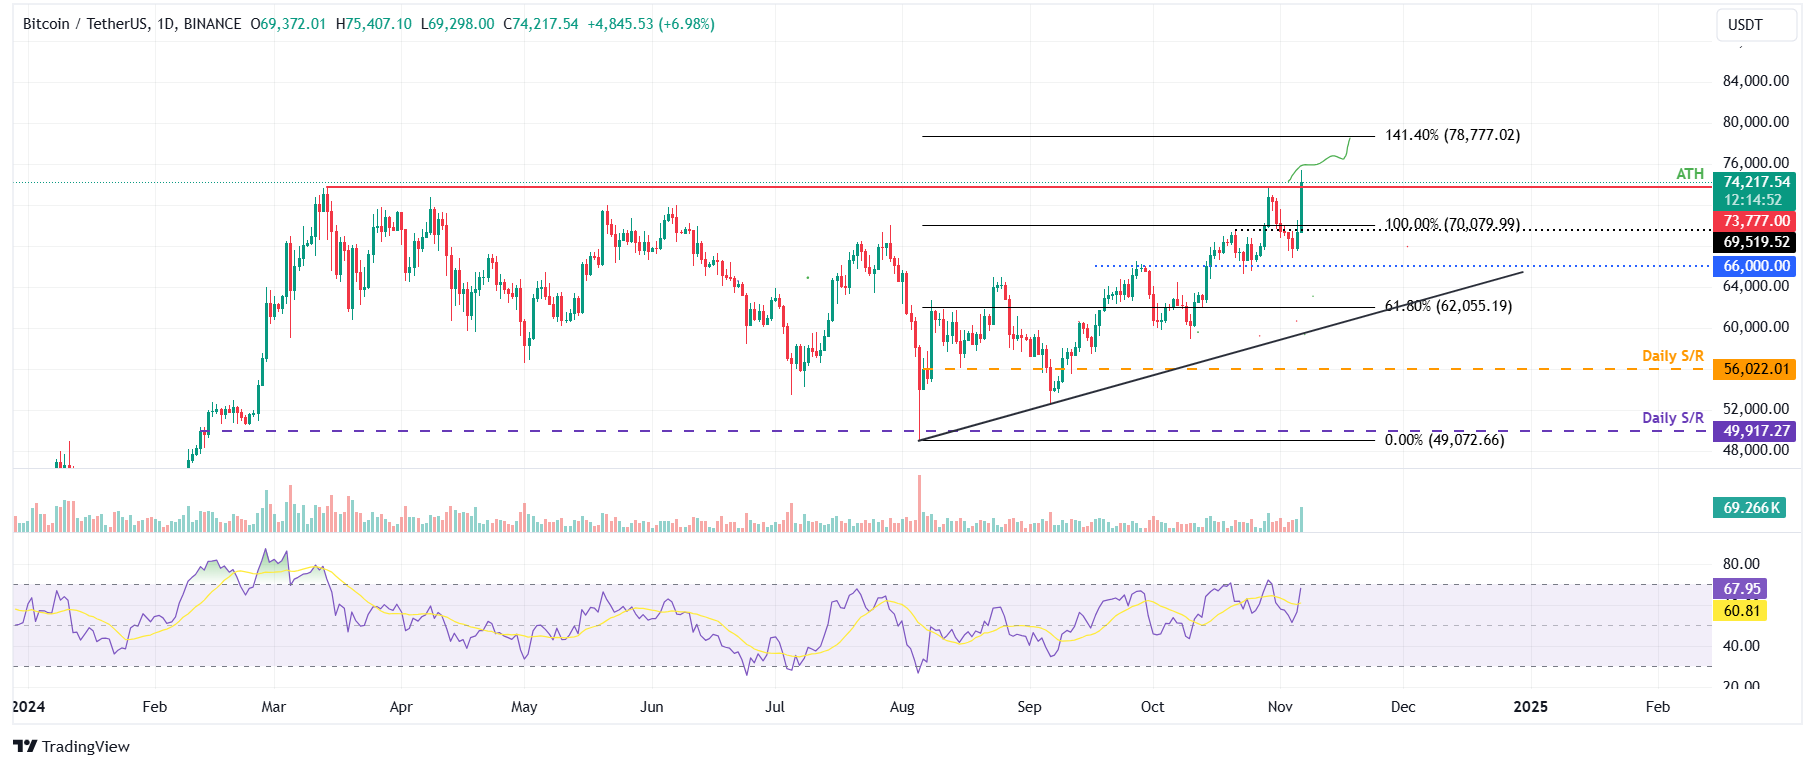
The daily chart also shows that bulls are in control, hinting at a rally ahead. Bitcoin found support around $67,000 on Monday and rose 2.24% until Tuesday. On Wednesday, it breaks above its ATH of $73,777 and forms a new all-time high of $75,407.
A successful daily close above its former ATH of $73,777 could pave the way for BTC to target the 141.40% Fibonacci extension level (drawn from July’s high of $70,079 to August’s low of $49,072) at $78,777, which closely aligns with the technical target of the downward-sloping parallel channel pattern around $78,955 seen on the weekly chart.
The Relative Strength Index (RSI) on the daily chart has bounced off from its neutral level of 50 and reads 68.
BTC/USDT daily chart
However, if BTC fails to close above $73,777 and declines, it may retest the key psychological level of $70,000.
Bitcoin, altcoins, stablecoins FAQs
Bitcoin is the largest cryptocurrency by market capitalization, a virtual currency designed to serve as money. This form of payment cannot be controlled by any one person, group, or entity, which eliminates the need for third-party participation during financial transactions.
Altcoins are any cryptocurrency apart from Bitcoin, but some also regard Ethereum as a non-altcoin because it is from these two cryptocurrencies that forking happens. If this is true, then Litecoin is the first altcoin, forked from the Bitcoin protocol and, therefore, an “improved” version of it.
Stablecoins are cryptocurrencies designed to have a stable price, with their value backed by a reserve of the asset it represents. To achieve this, the value of any one stablecoin is pegged to a commodity or financial instrument, such as the US Dollar (USD), with its supply regulated by an algorithm or demand. The main goal of stablecoins is to provide an on/off-ramp for investors willing to trade and invest in cryptocurrencies. Stablecoins also allow investors to store value since cryptocurrencies, in general, are subject to volatility.
Bitcoin dominance is the ratio of Bitcoin’s market capitalization to the total market capitalization of all cryptocurrencies combined. It provides a clear picture of Bitcoin’s interest among investors. A high BTC dominance typically happens before and during a bull run, in which investors resort to investing in relatively stable and high market capitalization cryptocurrency like Bitcoin. A drop in BTC dominance usually means that investors are moving their capital and/or profits to altcoins in a quest for higher returns, which usually triggers an explosion of altcoin rallies.
Important DisclaimersThe content provided on the website includes general news and publications, our personal analysis and opinions, and contents provided by third parties, which are intended for educational and research purposes only. It does not constitute, and should not be read as, any recommendation or advice to take any action whatsoever, including to make any investment or buy any product. When making any financial decision, you should perform your own due diligence checks, apply your own discretion and consult your competent advisors. The content of the website is not personally directed to you, and we does not take into account your financial situation or needs.The information contained in this website is not necessarily provided in real-time nor is it necessarily accurate. Prices provided herein may be provided by market makers and not by exchanges.Any trading or other financial decision you make shall be at your full responsibility, and you must not rely on any information provided through the website. FX Empire does not provide any warranty regarding any of the information contained in the website, and shall bear no responsibility for any trading losses you might incur as a result of using any information contained in the website.The website may include advertisements and other promotional contents, and FX Empire may receive compensation from third parties in connection with the content. FX Empire does not endorse any third party or recommends using any third party’s services, and does not assume responsibility for your use of any such third party’s website or services.FX Empire and its employees, officers, subsidiaries and associates, are not liable nor shall they be held liable for any loss or damage resulting from your use of the website or reliance on the information provided on this website.Risk DisclaimersThis website includes information about cryptocurrencies, contracts for difference (CFDs) and other financial instruments, and about brokers, exchanges and other entities trading in such instruments. Both cryptocurrencies and CFDs are complex instruments and come with a high risk of losing money. You should carefully consider whether you understand how these instruments work and whether you can afford to take the high risk of losing your money.FX Empire encourages you to perform your own research before making any investment decision, and to avoid investing in any financial instrument which you do not fully understand how it works and what are the risks involved.
Important DisclaimersThe content provided on the website includes general news and publications, our personal analysis and opinions, and contents provided by third parties, which are intended for educational and research purposes only. It does not constitute, and should not be read as, any recommendation or advice to take any action whatsoever, including to make any investment or buy any product. When making any financial decision, you should perform your own due diligence checks, apply your own discretion and consult your competent advisors. The content of the website is not personally directed to you, and we does not take into account your financial situation or needs.The information contained in this website is not necessarily provided in real-time nor is it necessarily accurate. Prices provided herein may be provided by market makers and not by exchanges.Any trading or other financial decision you make shall be at your full responsibility, and you must not rely on any information provided through the website. FX Empire does not provide any warranty regarding any of the information contained in the website, and shall bear no responsibility for any trading losses you might incur as a result of using any information contained in the website.The website may include advertisements and other promotional contents, and FX Empire may receive compensation from third parties in connection with the content. FX Empire does not endorse any third party or recommends using any third party’s services, and does not assume responsibility for your use of any such third party’s website or services.FX Empire and its employees, officers, subsidiaries and associates, are not liable nor shall they be held liable for any loss or damage resulting from your use of the website or reliance on the information provided on this website.Risk DisclaimersThis website includes information about cryptocurrencies, contracts for difference (CFDs) and other financial instruments, and about brokers, exchanges and other entities trading in such instruments. Both cryptocurrencies and CFDs are complex instruments and come with a high risk of losing money. You should carefully consider whether you understand how these instruments work and whether you can afford to take the high risk of losing your money.FX Empire encourages you to perform your own research before making any investment decision, and to avoid investing in any financial instrument which you do not fully understand how it works and what are the risks involved.
Since Donald Trump’s victory has now been confirmed, the GBP/USD price attempted a rebound, but gains were limited, reaching only the 1.3037 level.
This marks a recovery for the third consecutive trading session from last week’s losses, which had extended to the 1.2843 support level, its lowest in three months.
In general, this uncertainty will affect the behaviour of financial markets, as it tends to favor “safe haven” assets such as the US dollar, the Japanese yen and the Swiss franc, while weighing on stock markets and “high beta” currencies such as the Australian dollar.
The GBP/EUR exchange rate also tends to lose value when market fears rise, and we’ve seen the pair fall from a week-opening high of 1.1928 to a low of 1.1870 in the past 24 hours.
The final poll by Five Thirty-Eight shows Harris at 48% and Trump at 46.8%, indicating a statistical tie. Betting markets have seen Trump’s lead over Harris shrink over the past ten days, with PredictIt showing a near-even race on election day. Trump was previously the Favorite in October, strengthening the dollar. However, as the race tightened, the dollar has traded below recent highs.
Markets continue to unwind “Trump trades” on the back of the latest Des Moines Register US election poll, which gives Harris a lead over Trump in Iowa. “Trump trade” are in the dollar’s favour given the higher inflationary implications associated with the former president’s policies of tariffs and tax cuts. In general, uncertainty about the outcome is likely to prevent financial markets from making a big move, and we may see some movement tonight as the first results start to come in. If the initial results show that Trump does well, we expect the GBP/USD exchange rate to fall below 1.30, as the move accelerates towards any confirmation of his victory.
Commenting on the event and the outlook, Robert Thompson, chief economist at IBOSS, said: “If Trump wins, the market reaction will be more ambiguous. A Trump victory is likely to strengthen the US dollar and push up government bond yields because his plans to raise tariffs sharply would boost inflation and reduce the Fed’s willingness to cut interest rates.”
In terms of the pound, we expect pairs like GBP/AUD and GBP/NZD to also rise on such an outcome as investors start to worry about US-China relations, which has implications for the Australian currencies. According to analysts at Société Générale: “The Australian dollar is already trading at a discount due to concerns about the impact of a Trump victory on China.” The impact of a Trump victory on GBP/EUR will be more contained, and the pair could rise, especially if we see a rally in the stock market.
The question for the euro is whether Trump pushes for trade tariffs on the eurozone, which could impact EUR/USD more than GBP/USD, meaning the GBP/EUR exchange rate could rise.
Citibank warns that if early results suggest Harris performs better than expected, there could be a panic unwinding of long US dollar positions (tariff positions such as the US dollar versus the euro, the Chinese yuan, the Mexican peso and the Korean won). Also, equity markets will do well here as uncertainty fades and “business as usual” returns to calm fears, boosting currencies such as the Australian dollar, the New Zealand dollar and the euro. Furthermore, we could see GBP/EUR come under pressure as the euro shows relief that the eurozone will not face a potential tariff war with the US.
Furthermore, financial markets would react negatively, with the U.S. dollar gaining and risk-sensitive currencies under pressure. GBP/EUR could also be negatively impacted, potentially falling below 1.19.
In the same vein, Citibank’s pre-election analysis says that vote counting will be faster than in 2020 but counting in a few larger counties could continue later in the week. Pennsylvania polls close at 20:00 EST, with Nevada being the last to close among the swing states. Analysts expect results for Georgia, Michigan, North Carolina and Wisconsin to be released overnight, but may need to wait until the following day for Arizona and Pennsylvania, given historical timing and election processing rules.
Citibank adds that some early market action could focus on some key county vote results that could provide a glimpse into broader trends. Expect volatility to increase when these deals start to appear.
Disclaimer: The opinions expressed by our writers are their own and do not represent the views of U.Today. The financial and market information provided on U.Today is intended for informational purposes only. U.Today is not liable for any financial losses incurred while trading cryptocurrencies. Conduct your own research by contacting financial experts before making any investment decisions. We believe that all content is accurate as of the date of publication, but certain offers mentioned may no longer be available.
Bulls are controlling the situation on the market, according to CoinStats.
On the bigger time frame, the picture is unclear. Even if today’s bar closes bullish, the price of XRP might need more time to accumulate energy for a further move. In this case, sideways trading in the area of $0.52-$0.54 is the more likely scenario.
From the midterm point of view, none of the sides is dominating. If the weekly candle closes around the current prices, traders may witness ongoing consolidation in the range of $0.50-$0.56.
Former President Donald Trump won the 2024 presidential election.
The Federal Reserve will announce its decision on monetary policy on Thursday.
XAU/USD trades near its daily low, more slides likely despite near-term oversold conditions.
In one of the tight races in the United States (US) history, Donald Trump has been elected the 47th President of the world’s largest economy. Trump will return to the White House in January 2025, pulling off a stunning victory. By the time of writing, Trump has secured 277 electoral votes, more than the 270 needed to take office.
As a result, the US Dollar soared, pushing Gold prices to fresh three-week lows. XAU/USD trades near an intraday low of $2,652.29 in the mid-American session without signs of losing its downward momentum.
But not only the Greenback benefited from Trump’s victory. US indexes also run, reaching record highs, while government bonds plunged, sending Treasury yields to fresh multi-week highs. It is worth noting, however, that the 2-year note offers 4.28%, while the 10-year note yields 4.46%, the latter advancing at a faster pace and keeping the yield curve in the right place.
Excitement is far from over, given that the Federal Reserve (Fed) will announce its decision on monetary policy on Thursday. The Fed is widely anticipated to cut the benchmark interest rate by 25 basis points. The focus, however, will be on what Chairman Jerome Powell has to say about Trump’s return as the expected shift in fiscal and financial policies is likely to take its toll on US economic developments.
XAU/USD short-term technical outlook
From a technical point of view, XAU/USD daily chart shows bearish pressure is in full shape. Technical indicators maintain their downward slopes after crossing their midlines into the negative territory, heading south almost vertically. Even further, the pair broke below a bullish 20 Simple Moving Average (SMA), which now stands at around $2,714. The 100 and 200 SMAs maintain their bullish slopes far below the current level, suggesting there is still a chance for bulls.
The pair seems to have found an intraday bottom, according to the 4-hour chart. XAU/USD plummeted below all its moving averages, with the 20 SMA accelerating its slump above, but still above the 100 and 200 SMAs. As for the longer moving averages, they have lost their upward strength. Technical indicators, in the meantime, have pared their slides but stand within extremely oversold readings.






%20[16.21.58,%2006%20Nov,%202024]-638664938788224488.png)





✓ Share: