Today, Solana’s price is up 7% over the last 24 hours trading above $155 amid the Uptober bull run. On-chain data from CoinGecko shows SOL trading in a fourth consecutive bullish session on the daily timeframe.
Solan price performance in October
Solana is one of the top trending tokens in the crypto market. The token forged its identity in 2024 for harboring some of the famous meme coins. According to a post by Santiment, speculation regarding the corporate giant Apple building on Solana has given the coin the break it needed.
Santiment reports, “As the vast majority of crypto has enjoyed Friday gains, $SOL stands out as an asset seeing a major spike in bullish crowd sentiment. There are very loose rumors of Apple potentially building on Solana’s blockchain, triggering the latest hype train.”
Solan Price Uptober Sentiment
SOL’s rally today also coincides with an ongoing recovery in memecoins. Most coins are posting double-digit weekly gains, as shown in the figure below.
In addition, the recent uptick in memecoin prices is closely linked to a notable increase in on-chain activity within the Solana ecosystem, as evidenced by the data from the Dune dashboard pump.fun.
According to our current SOL price prediction, the price of SOL is predicted to rise by 13.73% and reach $167.62 by November 13, 2024. Per technical indicators, the current sentiment is bullish, while the Fear & Greed Index is showing 48 (neutral). Solana recorded 14/30 (47%) green days with 5.05% price volatility over the last 30 days.
The US Dollar maintained its positive traction at the beginning of the week.
Investors await for Canada and UK inflation updates and the ECB monetary policy decision.
XAU/USD holds near record highs, but bulls are giving signs of giving up.
Spot Gold is under mild pressure on Monday, trading with modest losses after peaking at $2,666.71 earlier in the day. XAU/USD is stable at around $2,650 a troy ounce, as the positive tone of Wall Street limits the US Dollar (USD) demand. The Greenback, however, started the week with a firm footing amid persistent geopolitical tensions in the Middle East and news coming from China.
The Chinese Finance Minister Lan Fo’an offered a press conference over the weekend, but failed to provide details on additional support to the battered economy, leaving investors with a sour taste in their mouths. Additionally, Chinese data missed expectations, creating doubts about the economic future of the Asian giant.
Other than that, European equities posted modest gains as investors await clearer clues. This week, Canada and the United Kingdom (UK) will publish inflation updates, while the European Central Bank (ECB) will announce its decision on monetary policy next Thursday. In the meantime, Federal Reserve’s (Fed) officials will be on the wires and may or may not provide fresh clues on what the central bank may do next.
XAU/USD short-term technical outlook
From a technical point of view, the daily chart for XAU/USD shows bulls may be a bit exhausted. The pair stands near its recent highs, but the Momentum indicator heads south and is currently crossing its midline into negative territory. The Relative Strength Index (RSI) indicator also turned lower but holds near overbought territory. At the same, the pair is developing above all its moving averages, which maintain moderated bullish slopes. Overall, the risk of a downward extension seems limited, yet bulls seem to have moved to the sidelines.
In the near term, and according to the 4-hour chart, the technical picture is quite similar. XAU/USD is finding intraday buyers around a flat 100 Simple Moving Average (SMA) while a mildly bullish 20 SMA advances below the longer one. Technical indicators, on the contrary, turned lower within positive levels, showing uneven bearish strength. The risk of a bearish continuation should increase on a break below the $2,636.00 region, the immediate support area.
Editor’s note: This is a regular column written by attorneys with the law firm Amin Wasserman Gurnani LLP.
Although the weather is (finally) cooling down, states around the country are turning up the heat on hemp products. Most notable is a recent emergency regulation in California that prohibits hemp food and supplements from containing detectable THC (delta-9-tetrahydrocannabinol)or having more than five servings per package. The regulation also restricts sales of hemp products to those 21 and older (hemp seed products are excluded).
The hemp industry, led by the U.S. Hemp Roundtable, vowed to challenge the basis for the regulation and filed a temporary restraining order (TRO) to block enforcement of the regulation.
On the East Coast, New Jersey Gov. Phil Murphy signed into law legislation that classifies hemp products with more than 0.5 milligrams (mg) of total THC per serving or 2.5 mg per package as “intoxicating hemp products” that can only be sold by licensed cannabis retailers, with 21-plus age restrictions for products containing any detectable THC. However, a last-minute amendment to the bill introduced confusion as to whether it applies to products produced outside the Garden State, which the governor noted would thwart the intent of the bill.
In the Midwest, Missouri Gov. Michael Parson’s attempt to ban intoxicating hemp products also faced a battle, while legal challenges have been filed in several states, including Arkansas, Iowa, Maryland, New York, Virginia and Wyoming (with the hemp industry successful in only a few of these). State attorneys general have also stepped in, issuing a variety of legal opinions and even filing lawsuits against distributors of allegedly illegal hemp products.
Since the passage of the 2018 Farm Bill, states have taken an increasingly active role in regulating hemp products. Approaches have been varied, with states like Minnesota, Tennessee and Utah allowing a wide range of products and THC levels of up to 5 mg per serving. Other states have taken approaches similar to California, Missouri and New Jersey (and Alaska and Washington state) by prohibiting any THC in hemp products or setting very low THC limits. Products exceeding these levels are classified as “cannabis” or “marijuana” and could be deemed a controlled substance if the product is sold outside the regulated cannabis market (in states that have one in place).
Regulators in these more restrictive states point to public health concerns associated with potentially intoxicating products and synthetically-derived cannabinoids such as delta-8 THC, and in particular minors’ access to such products. While sales-related age restrictions can help address this issue, one important player (the marijuana industry) has raised concerns about the equity of state laws related to cannabis — especially in states where the adult-use cannabis/marijuana industry is struggling.
Although marijuana remains a Schedule I controlled substance at the federal level, for many years, marijuana companies have operated in states that have established frameworks for regulating these products. As long as activities don’t cross state lines, the feds have been mostly hands off. With the rise of hemp — and specifically products that may mimic some of the effects of marijuana but are arguably legal at the federal level — these products have been subject to a different standard of regulation that allows for a free flow of products across state lines, or no regulation at all depending on the state. The 2018 Farm Bill also included language that protects interstate transport products that are lawfully produced. In the various lawsuits challenging state-based hemp product restrictions, industry has argued that such restrictions violate the Farm Bill’s language as well as other federal protections for interstate commerce.
Marijuana operators have seen sales go down, and the unequal (or, in some cases, lack of) regulation at the state level hasn’t gone unnoticed. The rise in more restrictive approaches to hemp products and especially restrictions on THC is in part being driven by the marijuana industry seeking to level the playing field. However, some in the hemp industry would say it’s marijuana seeking to protect its monopoly in the states.
While it’s possible we could see federal legislation on the horizon that sets guardrails around intoxicating levels of cannabinoids, that isn’t likely to happen soon. In the 2025 state legislative session, it’s likely we’ll see a continued push by states to restrict THC-containing hemp products in key states like Illinois, Ohio and Texas.
Finally, given the lack of clarity around the overlap of state and federal regulation of hemp products and the lack of consensus regarding how hemp products should be regulated, we may also see an additional wave of legal challenges to follow. In fact, following a lawsuit filed by the hemp industry, a federal judge in New Jersey has enjoined enforcement of the state’s new hemp law prohibiting the sale of “intoxicating hemp products” after determining that it violates both the dormant Commerce Clause and the 2018 Farm Bill preemption provision, as it discriminates against “otherwise compliant out-of-state hemp and hemp products.” The 21+ age restriction was not challenged and will remain in place.
However, just a day later, a judge in California denied the U.S. Hemp Roundtable’s TRO after considering similar arguments. In that case, the judge found the emergency regulation was not preempted by the 2018 Farm Bill, and “the State of California can prohibit the manufacture, storage and sale of final form food products containing THC within its borders.”
At the end of last week, the Euro traded around $1.09, its weakest level in about two months, driven by the overall strength of the US dollar amid expectations that the US Federal Reserve will cut borrowing costs at a slower pace than expected.
In Europe, the European Central Bank is expected to cut its deposit rate by 25 basis points when it meets this week, following similar moves in both September and June.
In general, traders are now betting that the ECB will continue to cut costs by a quarter point at each meeting until March. Annual inflation in the Eurozone fell to 1.8% in September 2024, its lowest level since April 2021.
According to stock trading platforms, Eurozone stocks closed the week in the green. European stocks closed higher on Friday, benefiting from a positive start to the session for their North American counterparts, supported by a positive start to the US earnings season, while investors evaluated a range of economic data. The French budget for 2025, which includes spending cuts and tax increases on corporations, the wealthy, and energy, has also been under close scrutiny. The Stoxx 50 Eurozone index rose 0.7% to close at 5003, and the Stoxx 600 European index added 0.5% to close at 522. Shares of large industrial companies led the gains, with Siemens, Schneider, Airbus, and Safran adding between 4% and 1%. Bank and insurance stocks in the region also closed strongly in the green, with Munich Re and Intesa Sanpaolo adding more than 1% each. On the other hand, Stellantis shares fell by about 4% after announcing a series of changes in its leadership.
According to the economic calendar, with the ECB’s decisions awaited. In the United States, all eyes will be on retail sales, which are expected to show a 0.3% increase in September, up from a 0.1% increase in August. On the other hand, US industrial production is likely to contract by 0.1%, following a strong 0.8% increase in August.
On the other hand, US industrial production is likely to contract by 0.1%, after a strong increase of 0.8% in August. Other key economic data to follow include the Empire State Manufacturing Index in New York, the Philadelphia Fed Manufacturing Index, consumer inflation expectations, export and import prices, the National Association of Home Builders Housing Market Index, building permits and housing starts. Several US Federal Reserve officials are also scheduled to appear. In addition, the earnings season will be in full swing with several companies announcing quarterly results including UnitedHealth, J&J, Bank of America, Goldman Sachs, Citigroup, Charles Schwab, Abbott, Morgan Stanley, Netflix, Blackstone, P&G, and American Express.
EUR/USD Technical analysis and forecast:
This week, the European Central Bank will take centre stage as it is set to deliver another 25-basis-point cut in the main deposit rate, in line with previous cuts in September and June. Ahead of the important event, the EUR/USD pair is stabilizing downwards, and according to the daily chart, the downward channel formation is gaining strength towards the current prominent support level of 1.0880, which in turn will push technical indicators towards oversold levels. Today is a US holiday, so liquidity will be lower, and therefore the EUR/USD pair may move in narrow ranges with a downward bias until any new developments.
Conversely, for the bulls to exit the downward channel, the EUR/USD pair must move towards the resistance levels of 1.1055 and 1.1130, respectively.
Ethereum’s (ETH) price has been on a downward trend lately, catching the attention of investors and traders. As the market watches closely, many are wondering what’s next for one of the top cryptocurrencies. Is this just a short-term dip, or could it signal something more? In this Ethereum Price Prediction article, we’ll explore the current price movement of Ethereum
How has the Ethereum Price Moved Recently?
As of today, Ethereum (ETH) is valued at $2,616.36, with a 24-hour trading volume of $45.90 billion, a market cap of $314.93 billion, and a market dominance of 13.94%. In the past 24 hours, its price has dropped by 1.27%.
Ethereum hit its peak on November 10, 2021, when it reached an all-time high of $4,867.17. In contrast, its lowest point was on October 21, 2015, at $0.420897. Since reaching its all-time high, the lowest price recorded was $897.01 (cycle low), while the highest price since that low was $4,094.18 (cycle high). The current price prediction sentiment for Ethereum is bearish, with the Fear & Greed Index indicating a value of 61, suggesting a state of “Greed.”
The circulating supply of Ethereum stands at 120.37 million ETH. Over the past year, the supply has grown by 0.11%, with 130,818 ETH newly created.
Ethereum’s price is currently experiencing a dip as a result of external pressures, particularly those stemming from developments in the Japanese market. These pressures have caused a ripple effect across major cryptocurrencies, including Bitcoin, which struggled to maintain its position above $65,000.
For Ethereum, the price hovers around its 50-day Exponential Moving Average (EMA) of $2,594, a critical support level. After breaking through its descending trendline on September 19, Ethereum saw an 11% rally, but this upward momentum faces challenges.
If the 50-day EMA holds as a support, Ethereum may have the potential to rebound and retest its previous high of $2,820 from August 24. The success of this upward movement, however, is closely tied to the market’s sentiment and trading indicators.
The Relative Strength Index (RSI), currently around 57 on the daily chart, shows a decrease in bullish momentum. To sustain any rally, the RSI would need to rise above 60, signaling renewed strength among buyers. Should the RSI not recover, the current support level could fail, leading to a further decline in Ethereum’s price.
Predictively, the direction of Ethereum’s price will depend on two key factors: the resilience of its 50-day EMA as a support line and an improvement in its RSI. If buyers can maintain this crucial support level and the RSI trends upwards, we may see Ethereum testing the $2,820 resistance and potentially pushing even higher.
However, if the selling pressure from market developments continues and the RSI remains subdued, Ethereum could see more downward movement in the short term. This uncertainty underscores the importance of monitoring both market trends and technical indicators closely.
How high can Ethereum Price go?
ETH/USD 1 Hr chart- TradingView
Ethereum has demonstrated impressive growth over the past year, with its price increasing by 58%, indicating substantial interest and activity from investors. The cryptocurrency also exhibited a strong performance over the last month, with 17 green days out of 30 (57%), suggesting short-term momentum.
However, despite these positive signs, Ethereum’s overall performance is somewhat mixed. It has underperformed compared to 51% of the top 100 crypto assets over the same period and has lagged behind Bitcoin, which typically sets the tone for the broader crypto market.
Moreover, Ethereum is currently trading below its 200-day Simple Moving Average (SMA), a key indicator often used to determine the overall trend. Trading below this long-term average suggests a bearish sentiment in the broader context, which could limit the upside potential in the short term.
The high liquidity of Ethereum, driven by its market cap and trading volume, provides a foundation for significant price movements, both upward and downward. Additionally, Ethereum’s low yearly inflation rate of 0.11% makes it an attractive asset for investors seeking long-term value retention, as the limited increase in supply helps maintain its price level.
If Ethereum can maintain its support around the 50-day EMA and regain bullish momentum reflected by an RSI above 60, there is potential for Ethereum to test its August high of $2,820. Breaking above this level could set the stage for further gains, particularly if the broader market sentiment turns more bullish.
In the long term, Ethereum’s ability to push higher will depend on a combination of technical factors and market conditions. If Ethereum can break above its 200-day SMA, this would signal a potential reversal into a long-term bullish trend. In this scenario, Ethereum could aim to revisit its previous all-time high of around $4,867.17, provided that broader market conditions, such as Bitcoin’s performance and global economic developments, are favorable.
Conversely, without a shift above the 200-day SMA or a significant increase in bullish momentum, Ethereum’s price may struggle to achieve substantial gains beyond its recent highs, leading to more consolidated or sideways movement.
Overall, Ethereum has strong upward potential, but how high it can go will largely depend on its ability to overcome current resistance levels and regain positive momentum in line with the overall crypto market.
A sustained rally would require not only technical indicators to align in its favor but also a supportive macroeconomic backdrop and positive developments in the crypto sector as a whole.
Hormones, which are chemicals in your body, act like messengers to help control your cells and organs. And endocrine disruptors are chemicals that interfere with the way hormones work.
Some endocrine disruptors occur naturally and others are made by humans. The Endocrine Society estimates that there are nearly 85,000 human-made chemicals in the world — and 1,000 or more of them may be endocrine disruptors.
Endocrine disruptors can block normal hormonal functions or mimic them so that they “trick” the body to overproduce or underproduce the hormones it needs to function normally.
These chemicals are thought to be linked to several developmental or biological issues, including endometrial cancer.
The link between endocrine disruptors and endometrial cancer
Endometrial cancer, which grows in the lining of the uterus, is the most common cancer that affects women’s reproductive systems. And some types of endometrial cancers are driven by estrogen.
“Recent research has shown that endocrine disruptors appear to be associated with endometrial cancer in women by increasing the amount of estrogen in their bodies,” said Dana M. Chase, M.D., a gynecologic oncologist at UCLA Health.
Exposure to estrogen can cause the endometrial lining to grow too much and eventually turn cancerous.
Endocrine disruptors are everywhere
Many research studies have shown that we all have contact with endocrine disruptors in multiple ways, including through the:
Air we breathe
Food we eat
Water we drink
Things we touch
Endocrine disruptors are found in many everyday products. Common types of endocrine disruptors and where they’re used include:
BPA – Used to help manufacture plastic products like shatter-proof windows, eyewear, water bottles; also coatings that line some metal cans and bottle tops.
Dioxins – Released into the air during wildfires, backyard fires and industrial processes like herbicide manufacturing and paper bleaching. Most exposure comes from eating animal fats in meat, dairy products and fish.
PFAs – These coatings are used to make cookware non-stick and clothing stain-resistant and waterproof.
Phthalates – Known as “plasticizers,” these compounds make cosmetics, fragrances, nail polishes, hair sprays, aftershave lotions, cleansers and shampoos last longer.
PCBs – Banned in the United States since 1979, products made before the ban may still contain PCBs, including electrical equipment, oil-based paint, plastics, adhesives and caulking.
Triclosan – Used to prevent bacterial contamination in products like antibacterial soaps, body washes and toothpastes.
Phytoestrogens can also be endocrine disruptors
Phytoestrogens are naturally occurring estrogens from plants that we eat. They are considered endocrine disruptors because they may have a similar effect as estrogen produced by the body. Therefore, phytoestrogens can upset the balance between estrogen and progesterone by acting on the endometrial lining.
However, the effect of phytoestrogens on the body has not been determined. It was once thought that phytoestrogens might contribute to certain cancers. However, research has indicated that there is no increased risk if you get your phytoestrogens from naturally occurring plant sources rather than from synthetic sources.
In fact, plant-based phytoestrogens may even have protective benefits against certain conditions, like osteoporosis, heart disease, breast cancer, endometrial cancer and vasomotor symptoms of menopause.
Foods that may contain phytoestrogens include:
Soy products like tofu and soy milk
Peanuts and peanut butter
Flax seed
Peas
Beans
Beer
Avoiding endocrine disruptors
Because endocrine disruptors are literally everywhere, there’s no way to remove them from your environment or avoid them completely.
However, the Endocrine Society suggests simple steps to reduce your family’s exposure:
Drink filtered — not bottled — water.
Minimize consumption of processed foods as much as possible.
Don’t store canned foods in areas where excessive heat can cause endocrine disruptors to leach into the can’s contents.
Reduce pesticide use in your home and yard.
The alphabet soup of endocrine disruptors
A 2022 review article examined possible connections between endometrial cancer and endocrine disruptors, including bisphenol A (BPA), polychlorinated biphenyls (PCBs) and polycyclic aromatic hydrocarbons (PAHs).
The authors concluded that links exist between these chemicals and endometrial cancer on a molecular level. However, it is not currently possible to know how much exposure individual people are getting to these chemicals and what amount is dangerous.
More recently, a different group of researchers compared the total estrogen load in the blood of more than 300 women. Approximately half the women had endometrial cancer and half did not. The researchers were able to determine how much estrogen each woman’s body made versus estrogen that came from several types of endocrine disruptors.
Women who had higher estrogen levels from endocrine disruptors were more likely to have endometrial cancer than those with the lowest levels. This study has identified, for the first time, a positive association between estrogen levels from outside the body and endometrial cancer risk.
These conclusions are what Chase expected, at least for now. “Correlation is not causation so, at this point, the link between endocrine disruptors and endometrial cancer is just an interesting association,” she said. “We do know that excess estrogen in the body puts women at risk for endometrial cancer and that we have products in our environment that alter the amount of estrogen in our bodies. But it’s important for people to understand that they won’t avoid endometrial cancer just because they stop drinking out of plastic bottles. It’s not that simple.”
This educational resource was created with support from Merck.
There are several lower price levels to keep an eye on where support may eventually be seen. The maximum for the bulls would be a test of support around the 200-Day MA, currently at 2.25. The 200-Day line was recaptured in early-September leading to an accelerated advance that culminated with the recent swing high of 3.02. This would be the first pullback towards the 200-Day line following the recent advance. Therefore, the 200-Day line has a good chance of marking the maximum low-price zone for the current retracement.
Breakdown Points to Lower Prices
Today’s decline took natural gas below the 38.2% Fibonacci retracement at 2.58, which was near last week’s low. It most likely leads to a test of support around the 50% retracement at 2.45, at a minimum. That price level should be considered along with a prior interim trend high at 2.44. Further down from there is the 50-Day MA, now at 2.37. Moreover, consider the 50-Day line to begin a potential support zone down to the 200-Day MA. However, in between those two moving averages is the 61.8% Fibonacci retracement at 2.31. The 2.31 price zone is also indicated as a potential support area by the mid-August swing high at 2.30.
Bigger Picture – Consolidation
In the bigger picture, natural gas remains within a large symmetrical triangle pattern that defines a consolidation range. A failed bullish breakout attempt occurred in the most recent rally that ended at the recent high of 3.02. However, since a consolidation triangle exists, there is always the possibility of an eventual test of support at the lower boundary line of the pattern.
For a look at all of today’s economic events, check out our economic calendar.
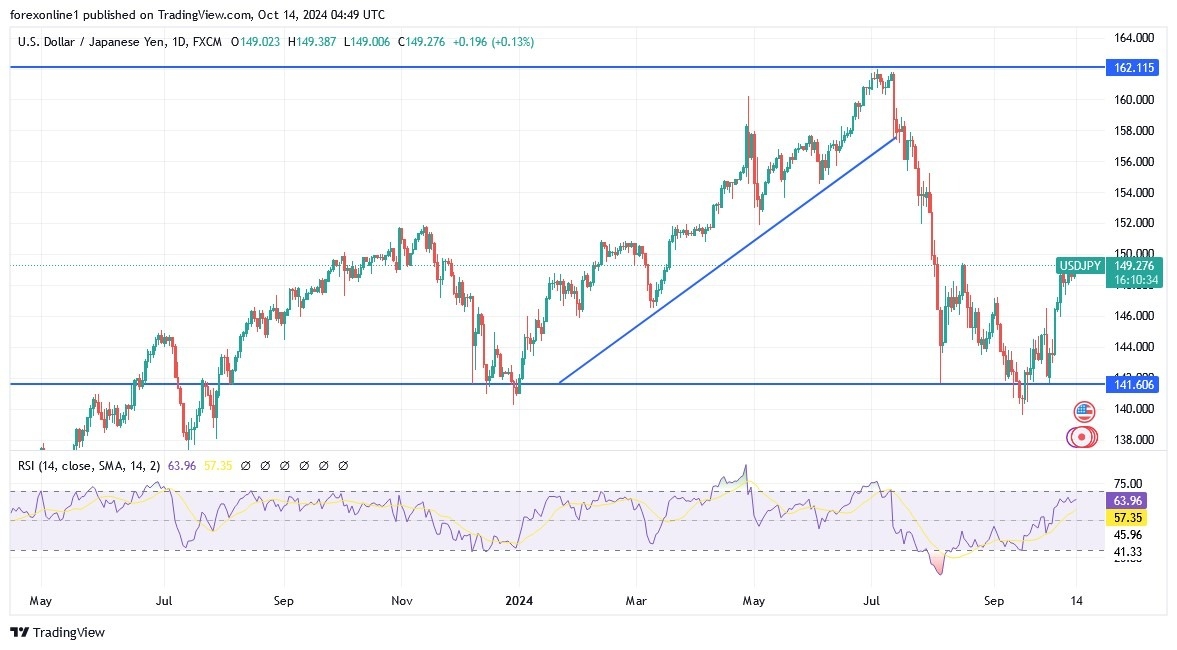
Despite US inflation figures exceeding consensus and hawkish comments from Fed policymakers failing to give the US dollar a new upward momentum, suggesting that the October rally is fading, the yen’s recent weakening.
However, the Bank of Japan’s abandonment of its tightening stance have given bulls an opportunity to push the USD/JPY pair towards the resistance level of 149.28, closer to testing the psychological resistance of 150.00, which supports the strength of the uptrend.
At the same time, technical indicators are moving towards oversold levels.
According to reliable trading platforms, the US dollar exchange rate has fluctuated after US producer price inflation rose 1.8% year-on-year in September, exceeding expectations of a modest 1.6% increase, while the August figure was revised upwards to 1.9%. The producer price index measures inflation rates in US factories and is seen as a key indicator of core inflation, which recorded a number higher than the consensus of 2.4% year-on-year just 24 hours earlier.
Financial markets are also grappling with new communications from Fed members: Atlanta Fed President Raphael Bostic said, “I’m perfectly comfortable skipping a meeting if the data suggests that’s appropriate.” And on Wednesday, San Francisco Fed President Mary Daly also said there is room to keep US interest rates unchanged next month, saying, “It’s likely that rates will be cut once or twice this year.”
Commenting on this, Paul Ashworth, chief economist at Capital Economics, said: “Along with unexpectedly strong Labor market data, September’s price data suggests that more than one Fed official may regret starting the easing cycle with a 50-basis-point rate cut.” He added, “We expect a more modest 25-basis-point cut at the FOMC meeting in early next month. The data is not strong enough to justify leaving rates unchanged.”
Neither the economic data nor the comments by Daly and Bostic had a significant impact on the US dollar price, suggesting that the markets have already moved to price in less than two more cuts in 2024 before the comments. The market expects US interest rates to be cut by about 40 basis points for the rest of the year, meaning that less than two full 25-basis-point rate cuts are expected. This can certainly still be adjusted downwards, which would strengthen the US dollar, but it now seems that the lion’s share of the adjustment in Favor of the dollar has occurred.
According to analysts, the rise in US yields has almost ended, and what we will continue to see is a volatile, not a volatile, exchange rate market, and next month’s jobs report will be distorted by hurricanes, which may argue for a 25-basis point cut instead of a stop.
Meanwhile, the rise of the US dollar is likely to pause temporarily until US Treasury yields resume their rise. Jonas Goltermann, Deputy Chief Economist for Financial Markets at Capital Economics, says: “With financial markets now shifting towards discounting the potential halt to the Fed’s intended rate-cutting cycle – which seems unlikely in our view – we see limited further upside for the dollar from US interest rate expectations in the near term.”
USD/JPY Technical Analysis and Expectations Today:
USD/JPY has now retreated to trade at its 100-hour moving average. Previously, Last Thursday’s decline had pushed the pair close to oversold levels on the 14-hour Relative Strength Index (RSI). In the near term, based on the hourly chart, USD/JPY is trading within a descending channel formation. Also, the 14-hour RSI supports a bearish bias as it approaches oversold levels. Therefore, bears will target extended declines around 148.51 or lower at 147.80. On the other hand, bulls will look to pounce on rebounds around 149.65 or higher at 150.59 resistance.
In the long term, based on the performance on the daily chart, USD/JPY is trading within an ascending channel formation. Technically, the 14-day RSI seems to support the bullish bias as it approaches overbought conditions. Therefore, bulls will look to extend the current winning streak towards 153.14 or higher to the 157.93 resistance. On the other hand, bears will look to pounce on pullbacks around 144.14 or lower at the 139.49 support.
Created as a fun token inspired by the Shiba Inu meme, Dogecoin has since gained the attention of major investors. With recent Dogecoin price fluctuations, many have noticed the asset stagnation and are wondering what’s next for this beloved meme coin.
A whale tracking system recently observed a large movement of Dogecoin to a new and potentially promising contender in RCO Finance (RCOF). As the new SHIB competitor, RCOF is gaining much attention because of its proposition and high ROI potential. Investors want to profit from its unique products and services and future earning capacity.
Whale Activity: A Catalyst for Dogecoin Price Movement?
Dogecoin, the popular meme coin, has shown potential for a significant price surge amid increasing whale activity and a bullish on-chain metric. Crypto analysts have pointed out that the Dogecoin price is now exiting a descending triangle pattern that has existed for many years and has always led to a massive surge in the price of digital currency.
Previous breakouts saw the Dogecoin price jump by as much as 200% and a 60% correction before going on another run. Experts believe that if history is anything to go by, Dogecoin could surge towards $0.2236, a level reached in December last year.
Whale activity has ramped up to this positivity, with more than 2 billion DOGE purchased weekly, the most active since January. This rise in whale interest and active addresses shows investors are more active in cryptocurrency.
While high market fluctuations persist, the continuously growing and supportive Dogecoin community and its increasing use may indicate that it has the potential to grow beyond just a meme coin in the future.
RCO Finance (RCOF): The SHIB Rival Targeting Dogecoin’s Dominance
Whales’ actions can impact the market, and RCO Finance (RCOF) is a good example of a beneficiary. Unlike meme coins with no utility value, RCOF aims to challenge Dogecoin and SHIB as a DeFi asset with a roadmap and actual application in the decentralized finance space.
Unlike Dogecoin, RCOF is not hype based but a project reliant on WEB3 innovation and DeFi development. It offers DeFi trading, DeFi lending, liquidity, yield farming, and RWAs integration, which gives it functionality surpassing Dogecoin’s potential.
Integral to RCOF’s proposition is this AI-driven trading platform, which employs machine learning to offer a highly refined investment service. One new addition to its system is a high-level AI robo-advisor that analyzes market data in real-time to find profitable trades.
The robo-advisor tool helps to minimize the impact of human errors in trading and, at the same time, increases productivity. Traders can now automate strategies once used by large investors to execute profitable trades without requiring in-depth trading knowledge or market analysis.
As the demand for all-in-one trading platforms increases, RCO Finance has embraced the trend, offering a platform that allows the trading of both cryptos and tokenized real-world assets (RWAs) such as real estate, stocks, bonds, and art, among others.
By aggregating more than 120,000 assets in 12,500 classes, RCOF provides users with the most extensive portfolio diversification compared to meme coin counterparts. The leverage ratio reaches 1000x on some assets, allowing traders to use various assets and the robo advisor to earn significantly with lower risks.
RCO Finance also pays much attention to users’ privacy and does not require any KYC procedures. This approach brings the concept of DeFi to privacy-conscious investors, who otherwise could not participate in DeFi. Furthermore, for the RCOF token smart contract, SolidProof audits the asset for its security and integrity
Why Consider Investing in RCO Finance (RCOF)
RCO Finance features a unique tokenomics and deflationary model designed to assure the project’s longevity and drive the growth of the RCOF token. This has attracted Dogecoin investors seeking a utility-based investment with long-term returns, especially considering the current Dogecoin price instability.
Currently priced at $0.0344, the presale has generated immense investments, with over $.1 million being invested. The listing price is anticipated to reach $0.4 and $0.6, which will be very profitable for those who invest in the project at the initial stage. As crypto AI and tokenized RWAs adoption increases, RCOF is expected to skyrocket to above $1.
Furthermore, the RCOF holders receive a staking reward of up to 88% APY, encouraging users to hold the token for an extended period and gain the right to govern the platform.
The similarities between RCOF and SHIB, including the shape of the chart and the community’s enthusiasm, indicate that RCOF may see similar growth.
For more information about the RCO Finance (RCOF) Presale:
Al igual que para la mayoría de cánceres, el cáncer ovárico tiene mejores desenlaces clínicos si se trata en forma temprana. Sin embargo, es difícil detectar cánceres ováricos en forma temprana porque frecuentemente no hay síntomas. Solo en EE.UU., hay casi 20,000 casos nuevos de cáncer ovárico y más de 14,000 muertes cada año.
El cáncer ovárico, el cual ocurre cuando células anormales en los ovarios crecen sin control, es más común en mujeres de raza blanca, pero las mujeres de raza negra tienen las menores tasas de supervivencia. Y la diferencia es muy grande. La tasa de supervivencia a cinco años de las mujeres de raza negra es el 41%, 7% menos que la tasa de supervivencia a cinco años del 48% que se observa para mujeres de raza blanca.
Y para los cánceres ováricos en etapas tempranas y tardías, las tasas de supervivencia de las mujeres de raza negra son peores que los de las mujeres de raza blanca y que los de las demás razas y etnias.
Nos comunicamos con Holly Harris, MPH, ScD, jefa de investigación de un estudio de 2022 diseñado para entender de mejor forma porque las mujeres de raza negra tienen peores tasas de supervivencia y desenlaces clínicos de cáncer ovárico que las de otras razas y etnias.
Las disparidades de acceso empeoran los desenlaces clínicos de las mujeres de raza negra
Harris, una profesora adjunta de epidemiología en Fred Hutchinson Cancer Research Center [Centro de investigación del cáncer Fred Hutchinson], dijo que bastantes disparidades de los desenlaces clínicos de cánceres ováricos de mujeres de raza negra se deben al acceso. Desafortunadamente, las mujeres de raza negra tienen menos posibilidades de tener acceso a tratamientos recomendados en las pautas profesionales médicas. De hecho, un estudio de 2019 determinó que mujeres de raza negra tienen un 25% menos de probabilidades de recibir tratamientos recomendados de cáncer ovárico en comparación con mujeres de raza blanca.
“Las mujeres de raza negra son menos propensas a recibir atención que se adhiere a las pautas y eso se debe probablemente a las áreas en las que viven y a la falta de acceso a varios recursos”, dijo Harris.
Determinantes sociales de la salud empeoran los desenlaces clínicos de cáncer ovárico para las mujeres de raza negra
Determinantes sociales de la salud (DSS) pueden contribuir con las disparidades y desigualdades médicas que las mujeres de raza negra enfrentan. Los DSS son factores no médicos, tales como factores socioeconómicos (tipo de trabajo, nivel de educación e ingresos), dónde vives, trabajas y juegas, los cuales afectan la calidad de vida, las oportunidades y los desenlaces clínicos.
Según el National Women’s Law Center [Centro legal nacional de la mujer], en casi todos los estados, las mujeres de raza negra son más propensas a no tener seguro médico, a vivir en pobreza, a tener acceso limitado a alimentos y a tener dificultades de acceso a viviendas en comparación con mujeres no hispanas de raza blanca. Todos estos factores pueden dificultar el acceso o la asequibilidad de la atención médica para mujeres de raza negra.
“Factores socioeconómicos posiblemente causan las disparidades [que las mujeres de raza negra con cáncer ovárico enfrentan]”, dijo Harris. “El área en la que vives afecta [tu capacidad para recibir] atención de buena calidad. En lo que se refiere al cáncer ovárico, es verdaderamente importante que las personas puedan recibir atención que se adhiere a las pautas y eso es algo que el estatus socioeconómico posiblemente afecta”.
Racismo estructural podría afectar los desenlaces clínicos de cáncer ovárico
Incluso con una buena atención, Harris señaló que las mujeres de raza negra podrían enfrentar racismo de los proveedores de atención médica (HCP, por sus siglas en inglés) cuando tratan de obtener tratamiento. Indica que el racismo estructural podría jugar un papel importante en las disparidades de las mujeres de raza negra en lo que se refiere al cáncer ovárico. El término racismo estructural se refiere a las varias formas mediante las cuales la sociedad limita los recursos, las oportunidades, el poder y el bienestar de personas en función de su raza o etnia.
Un artículo de una investigación de 2022 determinó que el racismo estructural que afecta las finanzas de mujeres de raza negra hizo que algunas no cuenten con atención de la salud reproductiva o que enfrenten barreras cuando tratan de obtener atención, lo cual podría incluir:
No tener instalaciones de atención de la salud reproductiva en su vecindario.
No tener acceso a transporte confiable a las instalaciones más cercanas de atención de la salud reproductiva.
Medicaid no cubre servicios específicos de atención de la salud reproductiva.
Los copagos de Medicaid para servicios de la atención de la salud reproductiva son muy caros, lo cual hace que se retrasen o que no tengan acceso a la atención.
Investigadores también descubrieron que el racismo individual hizo que algunas mujeres opten por recibir atención de proveedores de atención médica de su misma raza.
Puesto que el racismo puede jugar un papel importante en los desenlaces clínicos de las mujeres de raza negra, Harris también dijo que los proveedores de atención médica deben abordar sus prejuicios para proporcionar una mejor atención a pacientes de raza negra.
“[Los proveedores de atención médica deben] identificar sus propios prejuicios inconscientes y asegurarse de proporcionar la mejor atención posible a sus pacientes”, dijo Harris.
En qué forma las mujeres de raza negra pueden tratar de obtener una mejor atención para cánceres ováricos
Aquí encontrarás formas en las que puedes defender tus propios derechos para obtener la atención médica que necesitas y mejorar tus probabilidades de supervivencia en lo que se refiere al cáncer ovárico:
Defiende tus derechos: Si sientes que tu proveedor de atención médica ignora tus preocupaciones, di lo que piensas. Acude a las citas médicas con preguntas preparadas con anticipación, mantén tus expedientes médicos a la mano, pídeles que te expliquen resultados de pruebas que no entiendas y obtén una segunda opinión si fuese necesario.
Trata de obtener atención de un centro contra el cáncer reconocido por el NCI: Según Harris, las mujeres de raza negra podrían incrementar sus tasas de supervivencia de cáncer ovárico si tratan de obtener atención de instituciones contra el cáncer que tienen buena reputación y calidad. “Si puedes obtener atención de un centro contra el cáncer reconocido por el NCI [Instituto nacional del cáncer], entonces tendrás más probabilidades de recibir atención de buena calidad”, dijo Harris. Puedes buscar en la base de datos del NCI para encontrar un centro contra el cáncer reconocido por el NCI en tu comunidad o cerca de esta.
Encuentra proveedores de atención médica que sean culturalmente competentes: Es importante que encuentres un proveedor de atención médica que pueda proporcionar atención de buena calidad y que considere siempre tu raza, etnia, idioma y creencias culturales, todo lo cual puede afectar tu experiencia como paciente. Puedes buscar en el Internet para encontrar proveedores de atención médica de tu raza y etnia en sitios tales como Black Doctor.Org o la Association of Black Women Physicians [Asociación de médicas de raza negra] para encontrar proveedores de atención médica que te hagan sentir que te ven y te entienden.
Considera participar en un ensayo clínico: Participar en un ensayo clínico puede darte acceso a los tratamientos más nuevos y te permitirá contribuir con investigaciones que podrían beneficiar a otras mujeres de raza negra con cáncer ovárico. Puedes preguntarle a tu oncólogo o visitar ClinicalTrials.gov o BlackDoctor.org para encontrar un ensayo clínico apropiado para que hables sobre eso con tu proveedor de atención médica.
Comunícate con redes de apoyo y grupos de concientización: Organizaciones tales como SHARE Cancer Support pueden proporcionar recursos y apoyo que serán útiles mientras recibes tratamientos de cáncer ovárico.
Este recurso educativo se preparó con el apoyo de Merck.