About Editorial team of BIPNs

Main team of content of bipns.com. Any type of content should be approved by us.
11 10, 2024

CAD/JPY Forecast Today 11/10: JPY Gains Strength (Video)

By |2024-10-11T15:58:01+03:00October 11, 2024|Forex News, News|0 Comments

  • The Canadian dollar initially tried to rally against the yen, but then fell rather hard as we continue to see a lot of volatility.
  • That’s not a huge surprise as this is a market that is going to have a lot of crosswinds, not the least of which is going to be the fact that Friday features the Canadian jobs report. So do keep that in mind.

That being said, the Japanese yen strengthening could be due to a little bit of risk off, or it could just simply be due to the fact that the market had rallied so significantly against the yen over the last week or so. And when I say the market, I am referring to the currency markets in general. It’s not just the Canadian dollar that’s been positive.

The 200 Day EMA

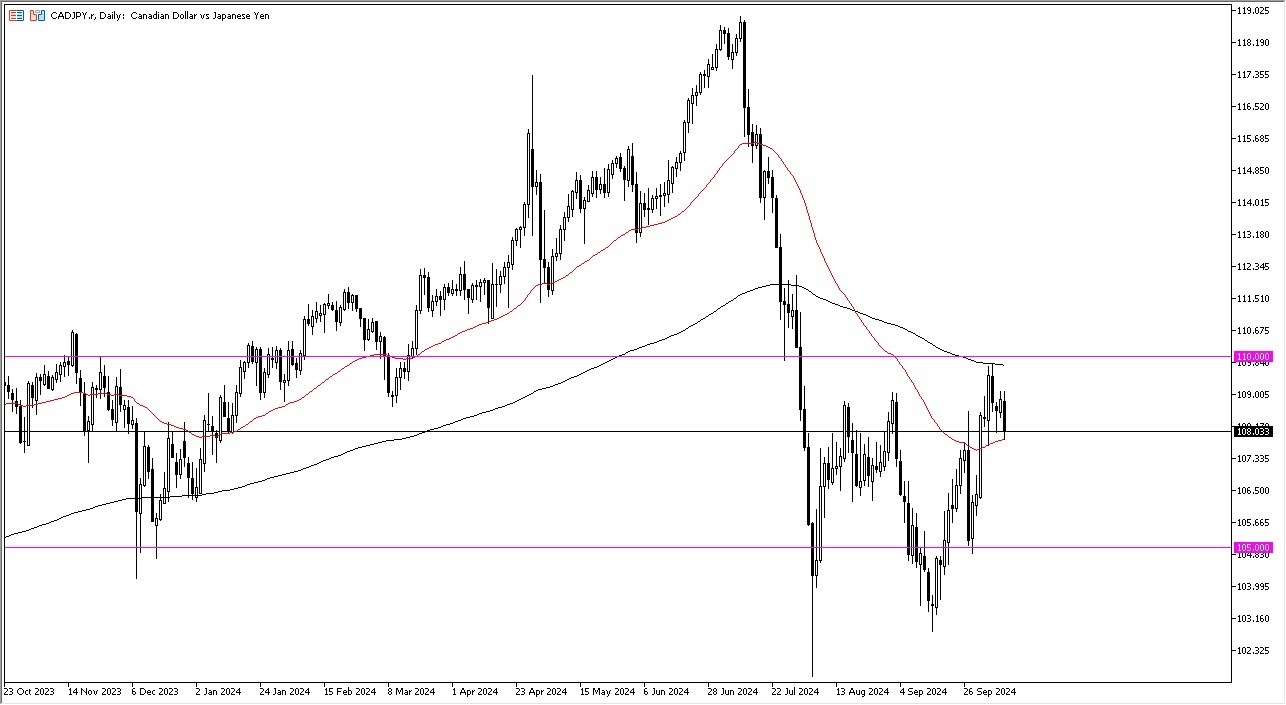
It’s probably worth noting that we pulled back from the 200 day EMA, but if we can break higher from here, then I think we challenge that indicator again. Remember, the 200 day EMA is typically watched by technical traders rather closely for an eye on what happens with the trend. Above there, we have the 110 yen level, which of course is a large round psychologically significant figure, and also an area that sees a little bit of market memory. If we can get above that level, then 112 yen is your target. On a pullback below the 50-day EMA, perhaps somewhere around 107.50 yen, you could see buyers come in. Anything below there opens up a door back down to the 105 yen level, which would obviously be very negative as market participants continue to try to gauge what the risk appetite around the world is.

Furthermore, keep in mind this is almost a pure play on crude oil because Canada is an oil exporter and Japan imports 100% of its crude oil, so this might move with the oil markets as well.

Ready to trade our Forex daily forecast? We’ve shortlisted the best forex broker list for you to check out. 

Source link

11 10, 2024

Copper prices in 2024 and 2025: a global overview and analysis 

By |2024-10-11T15:27:18+03:00October 11, 2024|Forex News, News|0 Comments


Copper is one of the most versatile and essential metals in today’s world. With applications ranging from electrical wiring to renewable energy infrastructure, its demand remains robust. But what does the future hold for copper prices?

We will draw on insights from our in-house experts (Boris Mikanikrezai and Andrew Cole) when exploring the current global picture. We will provide a copper price forecast for 2024 and a long-term outlook for 2025.

Global copper market outlook

As we navigate through 2024, the copper market presents a complex global picture, influenced by varying economic climates in major regions such as the US, China and Europe.

In the United States, the price of copper remains stable yet subdued, largely due to the seasonal summer lull, with premiums holding steady in the Midwest. Despite challenges, long-term optimism prevails, buoyed by potential supply imbalances and increasing demand for copper in green energy projects.

China, a major player in the copper market, witnessed a mild recovery in its physical market during August 2024. The copper grade A cathode premium in Shanghai saw an uptick, reflecting improved market conditions. This recovery is driven by expectations for better import arbitrage conditions post-LME price decline, although challenges remain due to fluctuating prices.

In Europe, the copper market remains weak, particularly in Germany – Europe’s largest consumer. Despite some demand from green energy projects, overall market conditions are bearish, with ample stock levels and sluggish performance in the manufacturing, automotive and construction sectors.

For more information on our long-term price analysis of the global copper market, see Fastmarkets’ copper 10-year long-term forecast.

Short-term copper price forecast for the remainder of 2024

In Q4 2024, copper prices are expected to experience upward pressure, driven by a more favorable macroeconomic sentiment (Federal Reserve rate cuts, stimulus in China), tighter market fundamentals (on expectations for smelter production cuts, a recovery in physical demand in China), positive seasonality (the fourth quarter typically being the strongest) and speculative positioning (rapid rebuilding of long positions). Given these factors, Fastmarkets analysts view the risk-reward profile skewed to the upside for the fourth quarter.

In China, the Shanghai premium should continue its recovery in the final quarter of the year, largely due to the improved sentiment following the substantial stimulus measures implemented by the country’s authorities.

In the US, spot market activity is projected to remain stable until the year-end, although supply availability could become a little tighter. Meanwhile, Europe might also see quiet spot activity until the remainder of the year, as most consumers are adequately covered by long-term contracts.

Improved macroeconomic conditions

China’s stimulus package, announced in September, represents a significant injection of liquidity totaling 3.95 trillion yuan ($560 billion), equivalent to over 3% of China’s GDP. The size of this package is substantial, nearing the level of support provided during the Covid-19 crisis. Alongside the Federal Reserve’s recent rate cuts, this should increase liquidity in the financial system in the coming months. Speculators have already begun to re-engage on the long side of the copper market in response. Given that the fourth quarter is historically the strongest for copper, we expect prices to average around $10,265 per tonne in Q4 2024, which would mark a record high.

Short-term challenges

Lower trading volumes and potential market volatility suggest caution. Despite the expected rise, the market remains sensitive to macroeconomic conditions and geopolitical events. Investors should keep an eye on these factors as they could impact short-term price movements.

The video below shows the relationship between global refined copper supply and demand, from 2022 through 2025.

Long-term copper price forecast for 2025 and beyond

Beyond the immediate future, the copper market and the price of copper is poised for a bullish long-term trajectory, driven by the energy transition’s escalating demand. For instance, by 2025 the copper grade A cathode premium in Rotterdam is projected to rise by approximately 25%, reflecting tighter regional fundamentals and a recovering European market.

Fastmarkets’ copper long-term outlook remains optimistic. As we move toward 2034, refined copper consumption is set to be driven significantly by sectors linked to the energy transition, including electric vehicles and renewable energy applications. The anticipated structural supply deficit will likely necessitate increased investments in production facilities, further underpinning a bullish outlook for copper prices.

Key drivers of copper demand and projected growth rates

As mentioned, refined copper consumption will be supported by demand from sectors linked to the energy transition. Some of its uses are listed below:

∙ To help connect batteries to electric vehicle (EV) powertrains
∙ For use in electric motors in the EV charging infrastructure
∙ Solar energy and wind power applications
∙ Grid connections

We expect total apparent demand for copper to rise at a compound annual growth rate (CAGR) of 2.6% in the decade to 2034. Copper consumption from energy transition sectors should grow at a CAGR of 10.7%, including 14.3% for the EV sector, 5.6% for the solar power industry and 9.3% in wind power applications. Traditional non-energy transition sectors should see a growth rate of 1.4%.

Regional copper price projections for 2025

The US copper market is expected to see a modest increase in demand, driven by government infrastructure projects and a growing emphasis on renewable energy. The supply-demand balance is likely to tighten, supporting higher copper prices.

China remains a critical player in the global copper market. The country’s focus on green energy and electric vehicles will drive significant demand. We project the Shanghai premium will average approximately $27 per tonne in 2025, reflecting a 25% decline from the estimated 2024 average. However, the long-term outlook remains positive, with expected stabilization and growth.

Key takeaways regarding copper price forecasts

The forecast for copper prices in the next 12 months is bullish. However, there are key risks to monitor, including a potential US economic recession and increased trade protectionism. The long-term forecast is also very constructive, driven by robust demand from the energy transition sectors and constrained supply dynamics.

Economists, analysts and investors should keep an eye on macroeconomic conditions, geopolitical events and industry-specific developments that could impact copper prices.


Source link

11 10, 2024

Herbal Tea Market Growth Fueled by Rising Demand for Natural

By |2024-10-11T14:30:42+03:00October 11, 2024|Dietary Supplements News, News|0 Comments


Herbal Tea Market

Herbal Tea Market Market Overview:

Maximize Market Research is a Business Consultancy Firm that has published a detailed analysis of the “Herbal Tea Market”. The report includes key business insights, demand analysis, pricing analysis, and competitive landscape. The report provides the current state of the Herbal Tea market by thorough analysis, and projections are made up to 2030.

Estimated Growth Rate for Herbal Tea Market Market:

Herbal Tea Market size was valued at US$ 3.83 Bn in 2023 and the total revenue is expected to grow at 4.94 % through 2024 to 2030, reaching nearly US$ 5.36 Bn.

Get your sample copy of this report now: https://www.maximizemarketresearch.com/request-sample/69258/

Herbal Tea Market Market Report Scope and Research Methodology:

The scope of the Herbal Tea Market market analysis encompasses diverse factors, including geographical regions, industry segments, traveller types, and travel service offerings. Research methodologies integrate primary and secondary data collection, employing surveys, interviews, and analysis of industry reports and databases. Assessing the Herbal Tea Market market scope involves examining the volume and value of business travel transactions, covering expenditures on transportation, accommodation, dining, and ancillary services. Methodologies aim to identify key trends, challenges, and opportunities influencing the market landscape. This comprehensive approach provides valuable insights for strategic decision-making, aiding businesses in navigating the complexities of the Herbal Tea Market sector and capitalizing on growth prospects.

Herbal Tea Market Market Regional Insights:

Improved dependability and increasing demand drive growth in the Herbal Tea Market Market, particularly in North America, Europe, Asia Pacific, Latin America, the Middle East, and Africa. Geographical observations help investors identify opportunities, with regional evaluations highlighting crucial strategies like mergers and acquisitions. Understanding regional dynamics enables stakeholders to tailor their approaches, leveraging growth prospects and addressing specific Herbal Tea Market market needs. This insight is vital for informed decision-making and strategic planning across diverse geographic landscapes.

Curious to peek inside? Grab your sample copy of this report now: https://www.maximizemarketresearch.com/request-sample/69258/

Herbal Tea Market Market Segmentation:

by Type

Cinnamon

Dandelion

Chamomile

Ginger

Turmeric

Blends

Others

by Raw Materials

Green Tea

Black Tea

Yellow Tea

The global herbal tea market is divided into three segments based on raw materials: green tea, black tea, and yellow tea. In 2023, the green tea sector had the greatest market share of xx% in the worldwide herbal tea industry. Because it is considered a healthy beverage. Green tea includes polyphenols, which can help to reduce edema and prevent cancer. As a result, these significant benefits will drive the expansion of the table lamp segment in the global Herbal Tea market during the forecast period. According to the Food and Drug Administration, global green tea output is predicted to increase by 7.5% every year, owing to the growing popularity of antioxidant-rich beverages. So, these key advantages will boost the expansion of the green tea industry.

by Packaging Type

LooseTtea

Paper Pouches

Tea Bags

Carton Packs

Can Packaging

The global herbal tea market is divided into five segments based on packaging type: loose tea, paper pouches, tea bags, carton packs, and can packaging. The tea bags segment is predicted to develop at the fastest CAGR in the global herbal tea market over the forecast period. Commercial areas are becoming increasingly widespread, so their ambiance is being emphasized. While implementing steps to improve employee health, productivity, and wellness, most corporate organizations maintain an office feel. As a result, the commercial segment in the global Herbal Tea market is expected to develop significantly over the forecast period.

by Application

Commercial Consumption

Individual Consumption

Inquire for More Details: https://www.maximizemarketresearch.com/request-sample/69258/

Table of Content: Herbal Tea Market Market

Part 01: Executive Summary

Part 02: Scope of the Herbal Tea Market Market Report

Part 03: Global Herbal Tea Market Market Landscape

Part 04: Global Herbal Tea Market Market Sizing

Part 05: Global Herbal Tea Market Market Segmentation by Type

Part 06: Five Forces Analysis

Part 07: Customer Landscape

Part 08: Geographic Landscape

Part 09: Decision Framework

Part 10: Drivers and Challenges

Part 11: Market Trends

Part 12: Vendor Landscape

Part 13: Vendor Analysis

Want a comprehensive market analysis? Check out the summary of the research report: https://www.maximizemarketresearch.com/market-report/global-herbal-tea-market/69258/

Herbal Tea Market Market Key Players:

1. Nestle

2. Unilever

3. Mothers Parkers Tea

4. Global Herbitech

5. Typhoo

6.Coffee Inc.

7. Green Earth Products Pvt. Ltd

8. Martin Bauer Group

9. Tata Global Beverages

10. Adagio Teas

Key questions answered in the Herbal Tea Market Market are:

Who are the leading companies and what are their portfolios in Herbal Tea Market Market?

What segments are covered in the Herbal Tea Market Market?

Who are the key players in the Herbal Tea Market market?

What is Herbal Tea Market?

What was the Herbal Tea Market market size in 2023?

What is the growth rate of the Herbal Tea Market Market?

Which are the factors expected to drive the Herbal Tea Market market growth?

What are the different segments of the Herbal Tea Market Market?

What growth strategies are the players considering to increase their presence in Herbal Tea Market?

What are the upcoming industry applications and trends for the Herbal Tea Market Market?

What are the recent industry trends that can be implemented to generate additional revenue streams for the Herbal Tea Market Market?

What segments are covered in the Herbal Tea Market Market?

Key Offerings:

Past Market Size and Competitive Landscape (2018 to 2023)

Past Pricing and price curve by region (2018 to 2023)

Market Size, Share, Size & Forecast by different segment | 2024-2030

Market Dynamics – Growth Drivers, Restraints, Opportunities, and Key Trends by Region

Market Segmentation – A detailed analysis by segment with their sub-segments and Region

Competitive Landscape – Profiles of selected key players by region from a strategic perspective

Competitive landscape – Market Leaders, Market Followers, Regional player

Competitive benchmarking of key players by region

PESTLE Analysis

PORTER’s analysis

Value chain and supply chain analysis

Legal Aspects of Business by Region

Lucrative business opportunities with SWOT analysis

Recommendations

Discover What’s Trending:

Global Neem Oil Market https://www.maximizemarketresearch.com/market-report/global-neem-oil-market/100072/

India Electric Motor Market https://www.maximizemarketresearch.com/market-report/india-electric-motor-market/63069/

Diesel Engine Market https://www.maximizemarketresearch.com/market-report/diesel-engine-market/14704/

Gate Driver IC Market https://www.maximizemarketresearch.com/market-report/gate-driver-ic-market/126324/

Global Hardware in the Loop Market (HIL) https://www.maximizemarketresearch.com/market-report/global-hardware-in-the-loop-market/22511/

Latin America Ventilator Market https://www.maximizemarketresearch.com/market-report/ventilator-market-latin-america/1970/

Global Small interfering RNA (siRNA) Therapeutics Market https://www.maximizemarketresearch.com/market-report/global-small-interfering-rna-sirna-therapeutics-market/91788/

Global Synthetic Aggregates Market https://www.maximizemarketresearch.com/market-report/global-synthetic-aggregates-market/72228/

Global Recycled Plastic Tiles Market https://www.maximizemarketresearch.com/market-report/global-recycled-plastic-tiles-market/10829/

Global Rust Preventive Oil Market https://www.maximizemarketresearch.com/market-report/global-rust-preventive-oil-market/79161/

Contact Maximize Market Research:

3rd Floor, Navale IT Park, Phase 2

Pune Banglore Highway, Narhe,

Pune, Maharashtra 411041, India

sales@maximizemarketresearch.com

+91 96071 95908, +91 9607365656

About Maximize Market Research:

Maximize Market Research is a multifaceted market research and consulting company with professionals from several industries. Some of the industries we cover include medical devices, pharmaceutical manufacturers, science and engineering, electronic components, industrial equipment, technology and communication, cars and automobiles, chemical products and substances, general merchandise, beverages, personal care, and automated systems. To mention a few, we provide market-verified industry estimations, technical trend analysis, crucial market research, strategic advice, competition analysis, production and demand analysis, and client impact studies.

This release was published on openPR.


Source link

11 10, 2024

GBP/USD Price Analysis: UK GDP Growth Sparks Rebound

By |2024-10-11T13:56:21+03:00October 11, 2024|Forex News, News|0 Comments

  • The UK economy expanded by 0.2%, coming in line with economists forecasts.
  • The CPI report in the US revealed that inflation was higher than expected in September.
  • US unemployment claims rose more than expected, indicating a weaker labor market. 

The GBP/USD price analysis shows a small rebound in the pound after data revealed growth in the UK economy. Meanwhile, the dollar hovered near yesterday’s peaks after inflation numbers came in higher than expected.  

–Are you interested to learn more about day trading brokers? Check our detailed guide-

Data on Friday revealed that the UK economy expanded by 0.2%, coming in line with economists forecasts. However, investors maintained bets for a Bank of England rate cut during the November meeting. 

Meanwhile, the CPI report in the US revealed that inflation was higher than expected in September. On a monthly basis, consumer prices increased by 0.2%, above forecasts of 0.1%. Meanwhile, annually, prices increased by 2.4%, above estimates of 2.3%. The unexpected jump led to a decline in Fed rate cut expectations, boosting the US dollar. 

However, unemployment claims rose more than expected, indicating a weaker labor market. The mix of data put bets for a 25-bps November Fed rate cut at 80%. At the same time, market participants are pricing a 20% chance that the Fed will keep rates unchanged. 

The next major report will be the Producer Price Index. Economists expect wholesale inflation to increase by 0.1%, down from 0.2% in August. If wholesale inflation also beats forecasts, rate cut expectations will keep falling. 

Meanwhile, markets are paying close attention to Middle East tensions. The likelihood of a ceasefire between Israel and Hezbollah eased fears of escalation. However, there is still a risk of retaliation after Iran attacked Israel.

GBP/USD key events today

  • US Core PPI m/m
  • US PPI m/m

GBP/USD technical price analysis: Bearish momentum fades near 1.3051 support

GBP/USD Price Analysis: UK GDP Growth Sparks Rebound
GBP/USD 4-hour chart


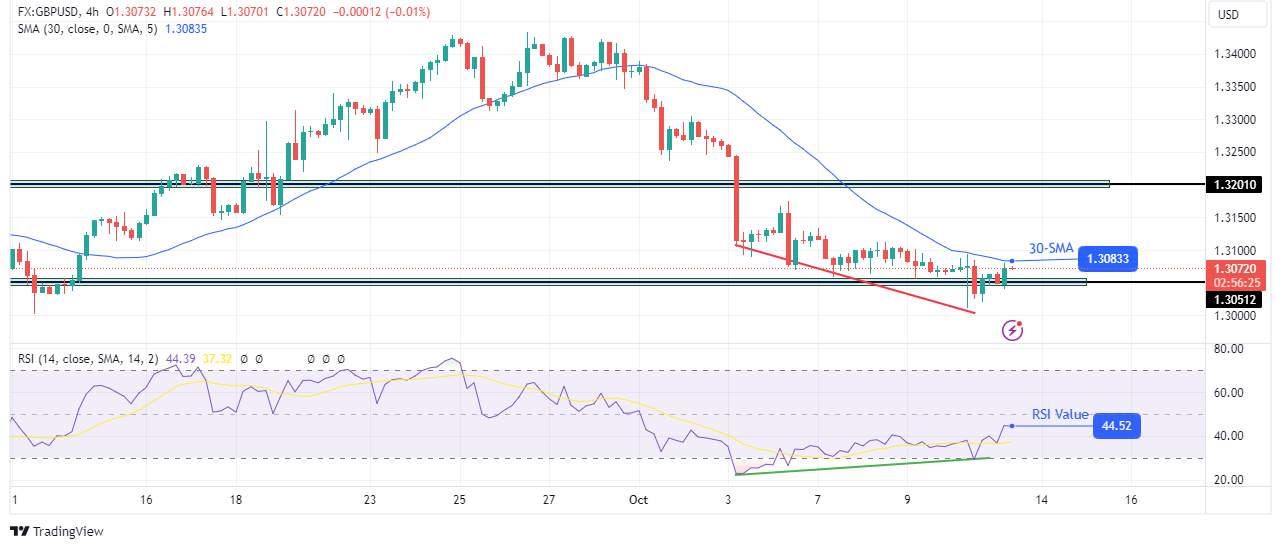
On the technical side, the GBP/USD price remains in a tight consolidation near the 1.3051 support level. The bias is bearish because the price sits slightly below the 30-SMA. At the same time, the RSI trades below 50, supporting bearish momentum. 

-Are you looking for the best AI Trading Brokers? Check our detailed guide-

However, the RSI has made a bullish divergence, indicating weakness in the downtrend. If it plays out, the price might break above the 30-SMA, showing a bullish reversal. A break above the SMA would allow GBP/USD to revisit the 1.3201 level.

Looking to trade forex now? Invest at eToro!

67% of retail investor accounts lose money when trading CFDs with this provider. You should consider whether you can afford to take the high risk of losing your money.

Source link

11 10, 2024

XRP price prediction – Here’s what’s next after altcoin’s latest pattern break

By |2024-10-11T13:53:35+03:00October 11, 2024|Crypto News, News|0 Comments

  • XRP’s recent downtrend provoked a bearish crossover on the 20-day and 50-day EMAs
  • Derivates data skewed slightly in favor of bulls, especially as the altcoin approached its near-term support level

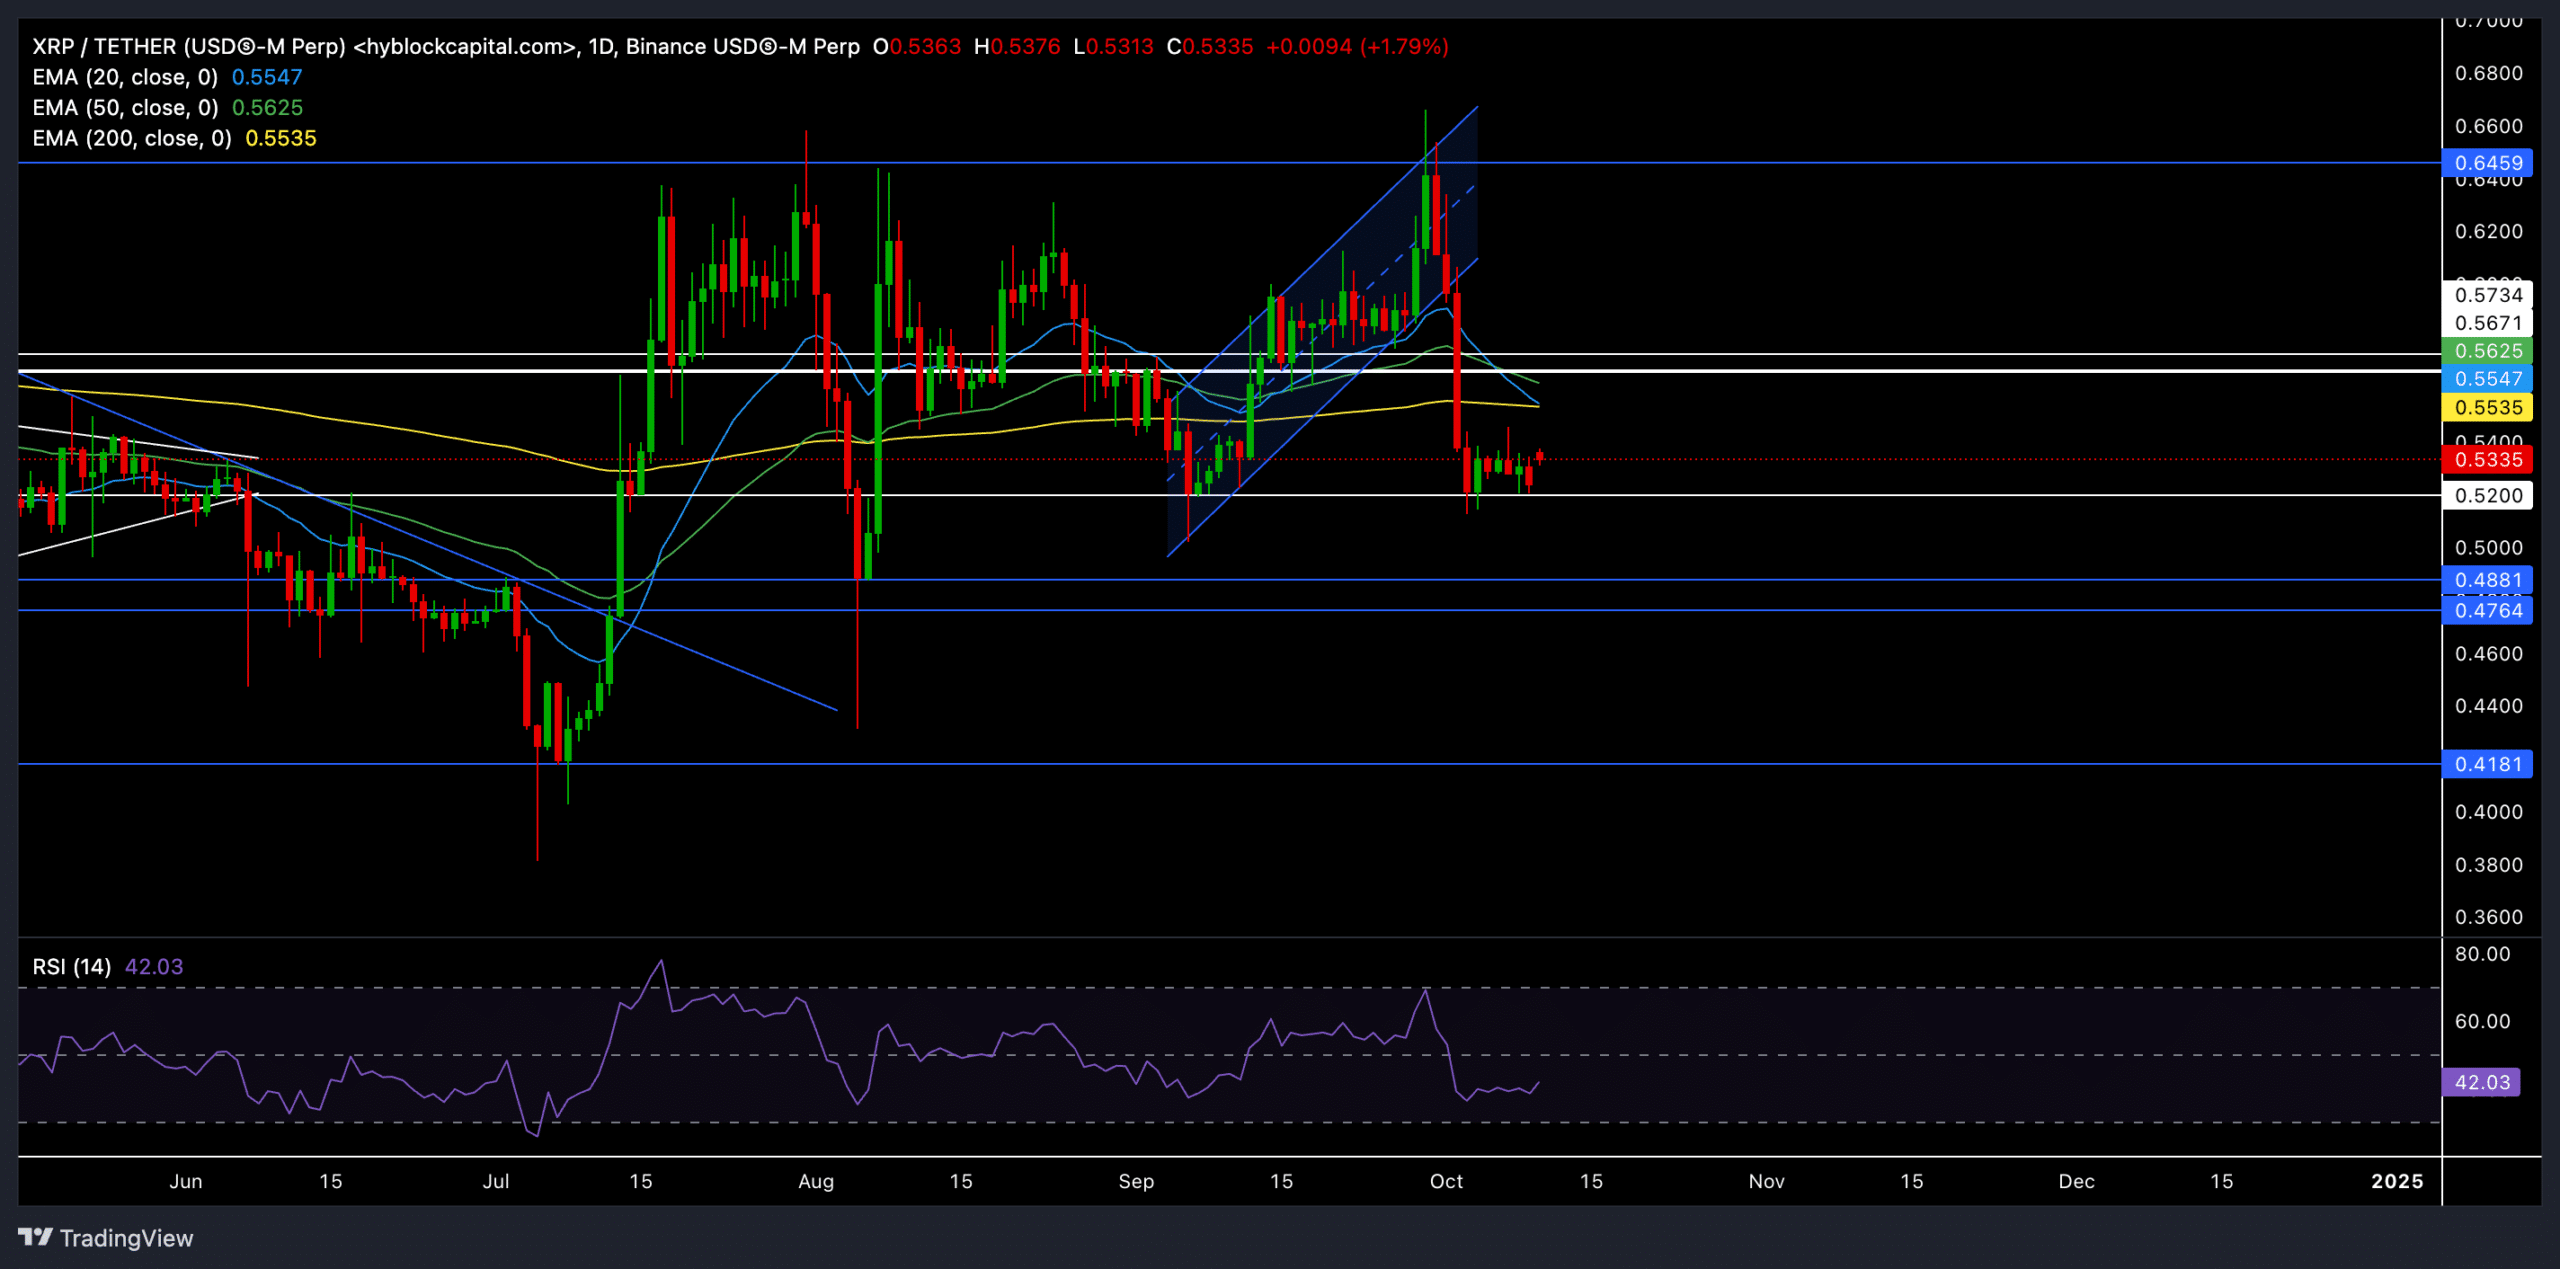
XRP continued its sideways trajectory after repeatedly facing rejection at the $0.60 resistance level for nearly three months. The recent pullback from this level resulted in an ascending channel breakout on the daily chart, highlighting a potential shift in sentiment.

At press time, XRP was trading at approximately $0.5328, up 1.66% over the last 24 hours.

Can XRP bulls make a comeback?

XRP price prediction – Here’s what’s next after altcoin’s latest pattern break

Source: TradingView, XRP/USDT

XRP has consistently faced resistance at the $0.60 level, resulting in a prolonged consolidation. The recent rejection from this level triggered a classic ascending channel breakout, leading to a drop below the 20-day EMA and the 50-day EMA – Levels that are now acting as immediate resistances.

The 20-day EMA’s downward trend and its likely bearish crossover with the 200-day EMA suggested that bearish power has been increasing. If this crossover materializes, XRP could continue consolidating below the $0.56 resistance level, limiting the scope for an immediate recovery.

However, XRP showed strong rebound tendency from the $0.52 support level. A sustained bounce from this support could help it reclaim its EMAs, potentially paving the way for a near-term recovery. If momentum strengthens, a retest of the $0.56 resistance could be on the cards, followed by $0.6.

The RSI was at 41.79 at press time, reflecting a rather bearish sentiment. The RSI’s recent movement showed flatter lows, compared to the higher lows on the price action since August – Indicating a mild bullish divergence. This alluded to potential recovery if the bulls step in, although this remains largely contingent on a broader sentiment shift.

Derivatives data revealed THIS

Source: Coinglass

The derivatives market sentiment for XRP appeared mixed, but leaned slightly towards a bullish outlook. The 24-hour long/short ratio stood at around 0.9662, at the time of writing. However, this ratio on Binance and OKX revealed a strong bullish edge— At 3.8216 and 3.11, respectively.

Interestingly, XRP’s Options volume surged by over 753%, pointing to a rise in speculative activity. The Open Interest hiked by 3.3% too and the huge uptick in Options Open Interest (+27.2%) indicated renewed interest among traders, despite the recent downturn.

Here, it’s worth noting that long liquidations were higher, pointing to profit-taking behavior as XRP failed to sustain its gains above $0.56. However, the prominent long positions among top traders implied that a potential recovery might still be in play.

Source link

11 10, 2024

UAE-based Web3 gaming startup PiP World lands $10 million in seed funding

By |2024-10-11T13:29:51+03:00October 11, 2024|News, NFT News|0 Comments


  • Key offerings include PiP Trader, a trading strategy game; PiP Academy, a gamified financial learning app; and StockRise, Roblox’s top stock simulator


Stay Informed

Get Industry News In Your Inbox…

Sign Up Today

Web3 gaming and Edtech ecosystem PiP World has raised $10 million in seed funding from fintech firm Exinity. 

PiP World aims to address the global financial literacy gap, particularly in the UAE, where the literacy rate is 30.7%, below the global average. 

Supported by Exinity, PiP World is combining video games, education, and Web3 technology to provide a platform for improving financial literacy. 

The UAE-based startup’s key offerings include PiP Trader, a trading strategy game; PiP Academy, a gamified financial learning app; and StockRise, Roblox’s top stock simulator.

Empowering individuals 

“This investment will enable us to expand our offerings and reach more users globally, particularly in the emerging markets where financial tools and knowledge are scarce,” said PiP World CEO and co-founder Saad Naja. 

“Our goal is to empower individuals with the financial knowledge and skills necessary to navigate the complexities of today’s economy and financial markets, and this partnership with Exinity brings us one step closer to achieving that vision.”

Exinity managing partner Lex Webster added: “By integrating our robust financial and trading technologies with PiP World’s immersive gaming and  learning environment, we are catalysing a paradigm shift in how financial literacy is perceived and attained.”


Source link

11 10, 2024

XAG/USD looks indecisive, flat lines above $31.00 mark: Analytics and Market news from 11 October 2024 09:03

By |2024-10-11T13:25:24+03:00October 11, 2024|Forex News, News|0 Comments


  • Silver oscillates in a range on the last trading day of the week. 
  • A mixed technical setup warrants caution for aggressive traders.
  • Acceptance above $32.00 will set the stage for additional gains.

Silver (XAG/USD) struggles to capitalize on its modest intraday uptick and trades around the $31.15 region during the first half of the European session on Friday, nearly unchanged for the day.

Looking at the broader picture, this week’s bounce from the vicinity of the $30.00 psychological mark and a subsequent strength back above the $31.00 mark favors bullish traders. That said, the recent repeated failures to capitalize on momentum beyond the $32.00 mark constitute the formation of a bearish multiple-tops pattern. This, along with mixed oscillators on the daily chart, warrants caution before positioning for any meaningful appreciating move for the XAG/USD. 

From current levels, the $31.55 region is likely to act as an immediate hurdle ahead of the $31.75-$31.80 area and the $32.00 mark. This is followed by resistance near the 32.25 supply zone, which if cleared decisively has the potential to lift the XAG/USD back towards the multi-year peak, just ahead of the $33.00 round figure touched last Friday. Some follow-through buying should pave the way for a move towards the December 2012 swing high, around the $33.85 region. 

On the flip side, weakness below the $31.00 round figure now seems to find some support near the $30.70-$30.65 region ahead of the $30.35-$30.25 area and the $30.00 mark. The next relevant support is pegged near the $29.80-$29.70 confluence – comprising the 100-day Simple Moving Average (SMA) and the 50-day SMA. This should act as a key pivotal point, which if broken will set the stage for an extension of the recent decline from the highest level since December 2012. 

The XAG/USD might then accelerate the downfall towards the $29.00 mark before eventually dropping to test the $28.60-$28.50 zone. The descending trend could extend further towards the $28.10-$28.00 region en route to the September monthly swing low, around the $27.70 area.

Silver daily chart


Source link

11 10, 2024

DOGE and this Altcoin Rival Aim for 2,000% Rally, Analyst Predicts

By |2024-10-11T11:52:52+03:00October 11, 2024|Crypto News, News|0 Comments

Crypto markets are notoriously volatile. Price shifts that would have traditional investors panicking are normal here, where fortunes are made and lost as quickly. But even in this chaos, patterns emerge, offering valuable insight into the future movement of digital assets. Take the Dogecoin price actions, for instance. 

This memecoin’s recent history reveals it could be on the verge of a potential bull run. However, as DOGE enthusiasts wait for the coin’s optimistic projections, this RCOF altcoin aims for an even more bullish 2000% rally. 

Dogecoin Price Historical Patterns: A Blueprint for Success?

Dogecoin has transcended its meme status and evolved into a serious contender in the crypto sphere. Like traditional assets, it”s showing predictable patterns even in this sea of uncertainty. 

One notable pattern is its breakout from a multi-year descending triangle, which often signals a reversal in trend. Following this breakout, DOGE experienced an impressive 200% surge, driven by retail investor enthusiasm, social media buzz, and celebrity endorsements. After came a 60% retracement that would normally indicate slowing activity, and cause worry, but it set the stage for a bull run. 

The altcoin recently had another 65% pullback. Could this be signaling a potential bull run? History often repeats itself, and understanding these phases could be the key to predicting future Dogecoin price movements.

RCO Finance: The Altcoin Rival Aiming for a 2000% Rally

Even though this potential rise in Dogecoin price has captured much of the spotlight, another altcoin rival is looking to make a 2000% rally. RCO Finance (RCOF) is gaining traction for its innovative approach and competitive edge. 

One of the unmatched features garnering RCO Finance so much attention is its innovative use of AI through its various trading tools, such as the robo-advisor. 

This AI tool tailors investment strategies based on your financial goal and risk tolerance by analyzing data to decipher underlying patterns in market behavior. 

With these insights, it monitors the markets and can make real-time adjustments to your portfolio when needed to capitalize on market movement. 

Also, with AI-powered market predictions, even newbies can invest without a lack of investment knowledge or experience. Moreover, seasoned investors can overcome limitations such as limited access to financial data or navigating complex financial markets to develop investment strategies. 

The AI-powered platform facilitates automated market making (AMM) through decentralized exchanges (DEXs). By providing liquidity to trading pairs, you can earn rewards. AMM utilizes complex algorithms to dynamically adjust prices based on changes in supply and demand, mitigating the risk of losses. 

Security and privacy are crucial factors that can make or break a crypto’s performance. RCO Finance’s smart contracts are audited by a third party, SolidProof, underscoring its commitment to building trust, security, and transparency in its ecosystem. 

RCOF’s tokenomics are well-structured and designed to support the project’s long-term growth and sustainability. This includes its balanced distribution, strong utility focus and community-centric approach, innovative staking mechanism, liquidity provision, and modest team allocation.   

Other RCOF benefits include rewards and incentives such as cashback rewards, staking bonuses, and more. Users also get access to over 120.000 tradable assets, including real-world assets, crypto lending, liquidity pools, pre-derivatives, debit cards, and more. 

Want To Cash In On This 2000% Rally? 

Investors are eager for potential gains with the Dogecoin price on the rise and a promising altcoin rival in the mix.

To make the most of this altcoin’s 2000% rally, secure your spot by joining RCO Finance’s presale and gaining early access to premium investment opportunities.

With tokens going for $0.034 and a projected launch price of between $0.4 and $0.6, take advantage of this limited-time offer to maximize your returns. Act now and join a thriving community of successful investors. 

For more information about the RCO Finance Presale:

Visit RCO Finance Presale

Join The RCO Finance Community


Source link

11 10, 2024

AI Emerges as Top Player, Gaming Fades

By |2024-10-11T11:27:25+03:00October 11, 2024|News, NFT News|0 Comments


AI Drives dApp Growth to New Heights

Decentralised applications (dApps) are gaining traction, with a 70% surge in daily unique active wallets (UAW) between the second and third quarters of this year, reaching an all-time high of 17.2 million. According to DappRadar’s latest report, the main driver behind this impressive growth is the rise of AI-powered applications, which saw a 71% increase in usage. 

Two key platforms, DIN and Alaya AI, played a pivotal role in pushing the AI sector to new heights, drawing an average of 4.3 million daily UAWs. This trend showcases the increasing enthusiasm surrounding AI’s integration into blockchain technology.

Source: dappradar.com

Gaming Takes a Backseat

While gaming remains the most dominant sector within the dApp ecosystem, its overall market share dropped slightly from 28% to 26% in the last quarter. This shift could indicate that users are beginning to explore more innovative applications like AI and social platforms. 

Among the most active dApps, Toncoin-based gamified wallet HOT Game led with 1.64 million UAW, while Ronin-based Pixels was the only pure gaming title to make it into the top five with 656,000 UAW. Social dApps are also gaining ground, with CARV, a modular data layer, capturing 1.24 million UAW in the third quarter, making it the most active social application.

Source: dappradar.com

DEX Growth Despite DeFi Challenges

Interestingly, despite a 12% decline in total value locked (TVL) in the decentralised finance (DeFi) sector—falling from over $150 billion to $133 billion—decentralised exchanges (DEXs) like Raydium and Uniswap experienced significant growth. Memecoin trading contributed to Raydium’s impressive 1.18 million daily UAWs last quarter, while Uniswap saw 459,000 daily UAWs across its V2 and V3 versions. 

Additionally, Jupiter Exchange added to the DEX momentum with 216,000 daily UAWs, solidifying its position as the third-largest DeFi application by user engagement. This growth suggests that DEXs may continue to thrive despite broader DeFi market challenges.

Key Highlights

  • AI Surge: 71% growth in AI-powered dApps, driven by DIN and Alaya AI.                                   
  • Gaming Decline: Gaming’s market share dropped from 28% to 26%.
  • DEX Growth: Raydium and Uniswap showed robust user activity despite a drop in DeFi’s TVL.

US Supreme Court Clears Sale of Seized Bitcoin

The U.S. government has received the go ahead from the U.S. Supreme Court for control over 69,370 BTC seized from criminal cases like Silk Road. This large sale worth approximately $4.33 billion (yes billion) is likely to put downward pressure on the crypto market, as such significant liquidations often impact prices. 

Source: coinmarketcap.com

On October 7, the U.S. Supreme Court chose not to hear the case from Battle Born Investments regarding their claim to ownership of Bitcoin.

The government has been known to auction off these assets in stages, which helps to minimise market disruptions. However, traders are still watching closely for any immediate effects on Bitcoin’s price, as it could add volatility to an already fluctuating market.

Two months ago, the U.S. government made a major Bitcoin transaction, moving approximately 29,800k BTC, including 10,000 BTC valued at $594 million, to Coinbase Prime. Currently, the government holds a significant 203,239 BTC, which is worth around $12.63 billion.

Bitcoin drops 5.3% to $58,900

Bitcoin’s price saw a significant drop of 5.3% between Oct. 9 and 10, reaching a low of $58,900, as economic uncertainty clouded market sentiment. The trigger? Higher-than-expected U.S. inflation data for September, which raised concerns that the Federal Reserve may pause its interest rate cuts. The Consumer Price Index (CPI) rose by 0.2%, hinting at possible stagflation – a mix of rising prices and stagnant economic growth.

Further weighing on Bitcoin is the sharp rise in U.S. jobless claims, hitting a 14-month high, signalling broader economic concerns. These factors have dampened investor confidence, especially given Bitcoin’s 88% price correlation with the S&P 500. With outflows from U.S. Bitcoin ETFs and a lawsuit against market maker Cumberland DRW, Bitcoin traders are approaching the market with caution, fearing that tighter monetary policies could negatively impact both crypto and traditional markets.

As these macroeconomic pressures mount, Bitcoin’s short-term outlook may hinge on global recession risks and the actions of the U.S. Federal Reserve.

On the daily chart, Bitcoin is showing the 200-day moving average (MA200) acting as resistance. Although there was a false breakout above this level in late September, this time the resistance is holding firm. Yesterday, Bitcoin attempted to push higher but failed to break above MA200, closing the day with a bearish candle—a long upper wick and a close at the session’s low—indicating strong selling pressure. This suggests a negative outlook in the near term.


Source link

11 10, 2024

XAU/USD recaptures key 21-day SMA, as buyers refuse to give up

By |2024-10-11T11:24:46+03:00October 11, 2024|Forex News, News|0 Comments


  • Gold price looks to extend the bounce from three-week lows ahead of US PPI data.    
  • The US Dollar gives back US CPI-led uptick amid employment concerns, hawkish Fedspeak ignored.
  • Gold price finds footing again above 21-day SMA at $2,627, more recovery likely?

Gold price is looking to build on the previous recovery from three-week lows of $2,604 early Friday. Broad risk aversion and a modest US Dollar (USD) downtick support Gold price heading into the US Producer Price Index (CPI) data release due later on Friday.

US jobs worries outweigh hot inflation, lifting Gold price

Gold price continues to cheer the unfazed odds of a 25 basis points (bps) interest rate cut by the US Federal Reserve (Fed)  in November. Markets currently price in about an 86% chance of such a move next month, according to the CME Group’s FedWatch Tool.

The health of the US labor market remains a concern for investors after Initial Jobless Claims surged by 33,000 last week to a seasonally adjusted 258,000 for the week ended October. 5. Discouraging US jobs data overshadowed the hot Consumer Price Index (CPI) inflation data for September, keeping the November rate cut hopes alive and kicking.

 US annual CPI inflation dropped from 2.5% in August to 2.4% in September, the lowest level since February 2021, although still came in above the estimated 2.3% print. The CPI increased by 0.2% over the month in September, matching August’s increase and surpassing 0.1% expectations. 

Therefore, the US Dollar failed to sustain its recovery momentum and pullback from two-month highs against its major rivals, as short-term two-year US Treasury bond yields tumbled. This helped Gold price stage a comeback from multi-week troughs.

The USD retracement was partly sponsored by the USD/JPY slide, fuelled by hawkish comments from Bank of Japan (BoJ) Deputy Governor Ryozo Himino, who said on Thursday that “if the outlook for economic activity and prices presented in the July report is achieved, the BoJ will accordingly raise interest rates.”

Late Thursday, slightly hawkish commentary from Atlanta Fed President Raphael Bostic was unable to lift the sentiment around the Greenback, leaving the buck on the back foot ahead of Friday’s US PPI inflation data.

Bostic said in a Wall Street Journal (WSJ) interview that he would be “totally comfortable” skipping an interest-rate cut at an upcoming meeting of the US central bank. He added that the “choppiness” in recent data on inflation and employment may warrant leaving rates on hold in November.

The dovish sentiment around the Fed rate cut expectations could be tested on the US PPI report, significantly impacting the value of the US Dollar and Gold price. The US PPI is seen easing to 1.6% YoY in September while the annual core PPI inflation is set to rise to 2.7% in the same period, against a 2.4% growth reported previously.

Gold price could continue to draw support from increased optimism about China’s fiscal stimulus package due to be rolled out on Saturday. Meanwhile, speeches from several Fed policymakers will also keep Gold traders entertained.

Gold price technical analysis: Daily chart

Buyers refused to give up on Thursday and jumped back into the game even after Gold price closed Wednesday below the key 21-day Simple Moving Average (SMA) support, then at $2,619.

Gold price recaptured the 21-day SMA support-turned-resistance, now at $2,628, on a daily closing basis on Thursday, reviving the uptrend.

The 14-day Relative Strength Index (RSI) looks north above the 50 level, suggesting that there is scope for more upside.

The next bullish targets for Gold price are seen at the $2,650 psychological barrier and the intermittent highs near $2,670.

On the downside, the immeddate support is seen at the three-week lows near the $2,600 threshold. A sustained break below the latter could extend the downside toward the September 20 low of $2,585.

Further declines could challenge the $2,550 demand area, where the 50-day SMA aligns.

Gold FAQs

Gold has played a key role in human’s history as it has been widely used as a store of value and medium of exchange. Currently, apart from its shine and usage for jewelry, the precious metal is widely seen as a safe-haven asset, meaning that it is considered a good investment during turbulent times. Gold is also widely seen as a hedge against inflation and against depreciating currencies as it doesn’t rely on any specific issuer or government.

Central banks are the biggest Gold holders. In their aim to support their currencies in turbulent times, central banks tend to diversify their reserves and buy Gold to improve the perceived strength of the economy and the currency. High Gold reserves can be a source of trust for a country’s solvency. Central banks added 1,136 tonnes of Gold worth around $70 billion to their reserves in 2022, according to data from the World Gold Council. This is the highest yearly purchase since records began. Central banks from emerging economies such as China, India and Turkey are quickly increasing their Gold reserves.

Gold has an inverse correlation with the US Dollar and US Treasuries, which are both major reserve and safe-haven assets. When the Dollar depreciates, Gold tends to rise, enabling investors and central banks to diversify their assets in turbulent times. Gold is also inversely correlated with risk assets. A rally in the stock market tends to weaken Gold price, while sell-offs in riskier markets tend to favor the precious metal.

The price can move due to a wide range of factors. Geopolitical instability or fears of a deep recession can quickly make Gold price escalate due to its safe-haven status. As a yield-less asset, Gold tends to rise with lower interest rates, while higher cost of money usually weighs down on the yellow metal. Still, most moves depend on how the US Dollar (USD) behaves as the asset is priced in dollars (XAU/USD). A strong Dollar tends to keep the price of Gold controlled, whereas a weaker Dollar is likely to push Gold prices up.


Source link

Go to Top