About Editorial team of BIPNs

Main team of content of bipns.com. Any type of content should be approved by us.
8 10, 2024

OTC Drug and Dietary Supplement Market Opportunities and

By |2024-10-08T13:45:22+03:00October 8, 2024|Dietary Supplements News, News|0 Comments


Dublin, Oct. 08, 2024 (GLOBE NEWSWIRE) — The “OTC Drug and Dietary Supplement Market Opportunities and Strategies to 2033” report has been added to ResearchAndMarkets.com’s offering.

The global OTC drug and dietary supplement market reached a value of nearly $310.96 billion in 2023, having grown at a compound annual growth rate (CAGR) of 6.8% since 2018. The market is expected to grow from $310.96 billion in 2023 to $438.25 billion in 2028 at a rate of 7.1%. The market is then expected to grow at a CAGR of 7.6% from 2028 and reach $632.1 billion in 2033.

Growth in the historic period resulted from rise in pharma research and development (R&D) expenditure, rising healthcare expenditure, growing fitness industry and growing use of telemedicine services. Factors that negatively affected growth in the historic period were lack of awareness.

Going forward, increase in health consciousness, increasing demand for dietary supplements, rising government initiatives, increasing aging population worldwide and expansion of the e-commerce industry will drive the growth. Factor that could hinder the growth of the OTC drug and dietary supplement market in the future include side effects and safety concerns.

The OTC drug and dietary supplement market is segmented by category into vitamin and dietary supplements, cough and cold dosage forms, analgesics, gastrointestinal dosage forms, skin and other categories. The vitamin and dietary supplement market was the largest segment of the OTC drug and dietary supplement market segmented by category, accounting for 38.5% or $119.71 billion of the total in 2023. Going forward, the vitamin and dietary supplement segment is expected to be the fastest growing segment in the OTC drug and dietary supplement market segmented by category, at a CAGR of 8.2% during 2023-2028.

The OTC drug and dietary supplement market is segmented by dosage form into tablets, hard capsules, powders, ointments, soft capsules, liquids and other dosage forms. The tablets market was the largest segment of the OTC drug and dietary supplement market segmented by dosage form, accounting for 33.2% or $103.26 billion of the total in 2023. Going forward, the soft capsules segment is expected to be the fastest growing segment in the OTC drug and dietary supplement market segmented by dosage form, at a CAGR of 8.3% during 2023-2028.

The OTC drug and dietary supplement market is segmented by distribution channel into pharmacies, grocery stores, vitamin and health food stores and online pharmacies. The pharmacies market was the largest segment of the OTC drug and dietary supplement market segmented by distribution channel, accounting for pharmacies % or $144.13 billion of the total in 2023. Going forward, the online pharmacies segment is expected to be the fastest growing segment in the OTC drug and dietary supplement market segmented by distribution channel, at a CAGR of 8.5% during 2023-2028.

North America was the largest region in the OTC drug and dietary supplement market, accounting for 42.7% or $132.84 billion of the total in 2023. It was followed by Asia-Pacific, Western Europe and then the other regions. Going forward, the fastest-growing regions in the OTC drug and dietary supplement market will be Asia-Pacific and Africa where growth will be at CAGRs of 9.9% and 9.3% respectively. These will be followed by the Middle East and South America where the markets are expected to grow at CAGRs of 8.7% and 7.9% respectively.

The global OTC drug and dietary supplement market is fairly fragmented, with a large number of players operating in the market. The top ten competitors in the market made up 21.5% of the total market in 2023. Nestle S.A. was the largest competitor with a 4.5% share of the market, followed by Procter & Gamble Co. with 3.4%, Haleon plc with 2.9%, Abbott Laboratories with 2.4%, Sanofi S.A. with 1.8%, Reckitt Benckiser Group plc with 1.7%, Bayer AG with 1.6%, Church & Dwight Co. Inc. with 1.2%, Nature’s Bounty Co. with 1% and Perrigo Company plc with 0.9%.

The top opportunities in the OTC drug and dietary supplement market segmented by category will arise in the vitamin and dietary supplements segment, which will gain $57.73 billion of global annual sales by 2028. The top opportunities in the OTC drug and dietary supplement market segmented by dosage form will arise in the tablets segment, which will gain $46.76 billion of global annual sales by 2028. The top opportunities in the OTC drug and dietary supplement market segmented by distribution channel will arise in the pharmacies segment, which will gain $60.26 billion of global annual sales by 2028. The OTC drug and dietary supplement market size will gain the most in the USA at $32.63 billion.

Market-trend-based strategies for the OTC drug and dietary supplement market include expansion of production capabilities in dietary supplements and OTC drugs, new over-the-counter option for opioid overdose reversal, launch of natural herb-based supplement for nursing mothers, introduction of OTC drug line for pain and allergy relief, innovation in women’s health pharmaceuticals.

Player-adopted strategies in the OTC drug and dietary supplement market include focuses on focus on expanding its business expertise through new product solutions, strengthening its business operations through strategic partnerships, and strengthening its business capabilities through the launch of new products.

The report covers market characteristics; size and growth; segmentation; regional and country breakdowns; competitive landscape; market shares; trends and strategies for this market. It traces the market’s history and forecasts market growth by geography. It places the market within the context of the wider OTC drug and dietary supplement market; and compares it with other markets.

Key Attributes:

Report Attribute Details
No. of Pages 324
Forecast Period 2023 – 2033
Estimated Market Value (USD) in 2023 $311 Billion
Forecasted Market Value (USD) by 2033 $632.1 Billion
Compound Annual Growth Rate 7.4%
Regions Covered Global

Key Topics Covered:

OTC Drug and Dietary Supplement Market Definition and Segmentations

  • Market Segmentation by Category
    • Vitamin and Dietary Supplements
    • Cough and Cold Products
    • Analgesics
    • Gastrointestinal Products
    • Skin
    • Other Categories
  • Market Segmentation by Dosage Form
    • Tablets
    • Hard Capsules
    • Powders
    • Ointments
    • Soft Capsules
    • Liquids
    • Other Dosage Forms
  • Market Segmentation by Distribution Channel
    • Pharmacies
    • Grocery Stores
    • Vitamin and Health Food Stores
    • Online Pharmacies

Major Market Trends

  • Expansion of Production Capabilities in Dietary Supplements and OTC Drugs
  • New Over-the-Counter Option for Opioid Overdose Reversal
  • Launch of Natural Herb-Based Supplement for Nursing Mothers
  • Introduction of OTC Drug Line for Pain and Allergy Relief
  • Innovation in Women’s Health Pharmaceuticals

Global Market Size and Growth

  • Market Size
  • Historic Market Growth, 2018-2023, Value ($ Million)
  • Forecast Market Growth, 2023-2028, 2033F Value ($ Million)

Global OTC Drug and Dietary Supplement Market Segmentation

  • Global OTC Drug and Dietary Supplement Market, Segmentation by Category, Historic and Forecast, 2018-2023, 2028F, 2033F, Value ($ Million)
  • Global OTC Drug and Dietary Supplement Market, Segmentation by Dosage Form, Historic and Forecast, 2018-2023, 2028F, 2033F, Value ($ Million)
  • Global OTC Drug and Dietary Supplement Market, Segmentation by Distribution Channel, Historic and Forecast, 2018-2023, 2028F, 2033F, Value ($ Million)

OTC Drug and Dietary Supplement Market, Regional and Country Analysis

  • Global OTC Drug and Dietary Supplement Market, by Region, Historic and Forecast, 2018-2023, 2028F, 2033F, Value ($ Million)
  • Global OTC Drug and Dietary Supplement Market, by Country, Historic and Forecast, 2018-2023, 2028F, 2033F, Value ($ Million)

Competitive Landscape and Company Profiles

  • Nestle
  • The Procter & Gamble Company
  • Haleon
  • Abbott Laboratories
  • Sanofi

Other Major and Innovative Companies

  • Reckitt Benckiser Group
  • Bayer
  • Church & Dwight
  • Nature’s Bounty Co
  • Perrigo Company
  • GNC Holdings
  • Sun Pharmaceutical Industries
  • Novartis
  • Pfizer Inc
  • Merck & Co. Inc
  • Pharmavite LLC
  • Hain Celestial Group Inc
  • Blackmores Limited
  • Cipla Inc
  • Amway

Key Mergers and Acquisitions

  • Dr. Reddy’s Laboratories Acquired MenoLabs
  • Dexcel Pharma Acquired Teva Pharmaceutical Industries Ltd
  • Cipla Limited Acquired Actor Pharma
  • SGS S.a. Acquired Nutrasource Pharmaceutical and Nutraceutical Services Inc.
  • The Kirin Holdings Company Limited Acquired Blackmores Limited
  • Balchem Corporation Acquired Bergstrom Nutrition
  • Glenmark Pharmaceuticals Ltd Acquired Wockhardt Ltd
  • Acino Acquired Aspen Pharmacare Holdings Limited
  • Douglas Acquired Disapo
  • Merieux NutriSciences Acquired Dyad Labs
  • Laboratorios Rubio Acquired Fisiopharma S.r.l.
  • Fidia Farmaceutici Acquired Sanofi

Opportunities and Strategies

  • Global OTC Drug and Dietary Supplement Market in 2028 – Countries Offering Most New Opportunities
  • Global OTC Drug and Dietary Supplement Market in 2028 – Segments Offering Most New Opportunities
  • Global OTC Drug and Dietary Supplement Market in 2028 – Growth Strategies
    • Market Trend-based Strategies
    • Competitor Strategies

OTC Drug and Dietary Supplement Market, Conclusions and Recommendations

For more information about this report visit https://www.researchandmarkets.com/r/2r4s70

About ResearchAndMarkets.com
ResearchAndMarkets.com is the world’s leading source for international market research reports and market data. We provide you with the latest data on international and regional markets, key industries, the top companies, new products and the latest trends.


Source link

8 10, 2024

Pound Sterling remains fragile as markets turn cautious

By |2024-10-08T13:11:27+03:00October 8, 2024|Forex News, News|0 Comments

  • GBP/USD trades in a narrow channel below 1.3100 in the European session on Tuesday.
  • The pair’s near-term technical outlook suggests that the bearish bias remains intact.
  • The US economic calendar will not offer any high-impact data releases.

After closing in negative territory on Monday, GBP/USD staged a modest recovery early Tuesday but lost its traction after meeting resistance near 1.3100. The pair’s technical outlook suggests that sellers look to retain control in the near term.

British Pound PRICE Last 7 days

The table below shows the percentage change of British Pound (GBP) against listed major currencies last 7 days. British Pound was the weakest against the US Dollar.

  USD EUR GBP JPY CAD AUD NZD CHF
USD   1.29% 2.11% 2.90% 0.85% 2.73% 3.68% 1.04%
EUR -1.29%   0.80% 1.58% -0.43% 1.42% 2.35% -0.27%
GBP -2.11% -0.80%   0.77% -1.23% 0.60% 1.55% -1.05%
JPY -2.90% -1.58% -0.77%   -1.97% -0.14% 0.77% -1.79%
CAD -0.85% 0.43% 1.23% 1.97%   1.86% 2.80% 0.19%
AUD -2.73% -1.42% -0.60% 0.14% -1.86%   0.92% -1.67%
NZD -3.68% -2.35% -1.55% -0.77% -2.80% -0.92%   -2.54%
CHF -1.04% 0.27% 1.05% 1.79% -0.19% 1.67% 2.54%  

The heat map shows percentage changes of major currencies against each other. The base currency is picked from the left column, while the quote currency is picked from the top row. For example, if you pick the British Pound from the left column and move along the horizontal line to the US Dollar, the percentage change displayed in the box will represent GBP (base)/USD (quote).

The negative shift seen in risk mood at the start of the week caused GBP/USD to edge lower. Early Tuesday, investors adopt a cautious stance amid growing concerns over an economic downturn in China.

The National Development and Reform Commission (NDRC), China’s state planner, said on Tuesday that the downward pressure on China’s economy is increasing, adding that they are facing more complex internal and external environments.

Reflecting the souring mood, the UK’s FTSE 100 Index is down more than 1% on the day. Meanwhile, US stock index futures trade virtually unchanged.

In case the market atmosphere remains risk-averse in the second half of the day, GBP/USD could come under renewed bearish pressure.  NFIB Business Optimism Index for September and RealClearMarkets/TIPP Economic Optimism Index data for October will be featured in the US economic docket on Tuesday, which are unlikely to trigger a noticeable market reaction.

GBP/USD Technical Analysis

The Relative Strength Index (RSI) indicator on the 4-hour chart stays below 40, suggesting that sellers look to retain control. Interim support seems to have formed at 1.3070 before 1.3050 (static level) and 1.3000 (round level, static level).

If GBP/USD manages to rise above 1.3100 (Fibonacci 78.6% retracement level of the latest uptrend) and starts using this level as support, sellers could be discouraged. In this scenario, next resistance could be spotted at 1.3170 (Fibonacci 61.8% retracement).

Pound Sterling FAQs

The Pound Sterling (GBP) is the oldest currency in the world (886 AD) and the official currency of the United Kingdom. It is the fourth most traded unit for foreign exchange (FX) in the world, accounting for 12% of all transactions, averaging $630 billion a day, according to 2022 data. Its key trading pairs are GBP/USD, also known as ‘Cable’, which accounts for 11% of FX, GBP/JPY, or the ‘Dragon’ as it is known by traders (3%), and EUR/GBP (2%). The Pound Sterling is issued by the Bank of England (BoE).

The single most important factor influencing the value of the Pound Sterling is monetary policy decided by the Bank of England. The BoE bases its decisions on whether it has achieved its primary goal of “price stability” – a steady inflation rate of around 2%. Its primary tool for achieving this is the adjustment of interest rates. When inflation is too high, the BoE will try to rein it in by raising interest rates, making it more expensive for people and businesses to access credit. This is generally positive for GBP, as higher interest rates make the UK a more attractive place for global investors to park their money. When inflation falls too low it is a sign economic growth is slowing. In this scenario, the BoE will consider lowering interest rates to cheapen credit so businesses will borrow more to invest in growth-generating projects.

Data releases gauge the health of the economy and can impact the value of the Pound Sterling. Indicators such as GDP, Manufacturing and Services PMIs, and employment can all influence the direction of the GBP. A strong economy is good for Sterling. Not only does it attract more foreign investment but it may encourage the BoE to put up interest rates, which will directly strengthen GBP. Otherwise, if economic data is weak, the Pound Sterling is likely to fall.

Another significant data release for the Pound Sterling is the Trade Balance. This indicator measures the difference between what a country earns from its exports and what it spends on imports over a given period. If a country produces highly sought-after exports, its currency will benefit purely from the extra demand created from foreign buyers seeking to purchase these goods. Therefore, a positive net Trade Balance strengthens a currency and vice versa for a negative balance.


Source link

8 10, 2024

Will Settlement Speculation & SEC Appeal Affect XRP Price?

By |2024-10-08T13:07:56+03:00October 8, 2024|Crypto News, News|0 Comments

Ripple Vs SEC: The XRP price has noted volatile trading lately, especially after the agency’s appeal in the ongoing legal battle. Notably, the appeal has sparked speculations in the broader crypto market over the potential motive behind the agency’s move. In addition, many in the crypto community also stayed on the sideline, as the appeal is likely to extend the long-running legal battle further.

Ripple Vs SEC Settlement Speculation

The discussions over a potential settlement between the two parties in the Ripple Vs SEC battle have sparked market interest. Although many in the XRP community anticipate the settlement will happen in the near future, some have denied claims.

For instance, recently ex-SEC lawyer Marc Fagel predicted that the Ripple SEC settlement is unlikely, citing several reasons. Having said that, it is expected that the case will be extended further in the coming days, potentially weighing on the market sentiment.

Meanwhile, in another X post, the former SEC lawyer said that the agency’s primary goal is to reverse the lower court’s decision that programmatic and non-cash sales of XRP are not securities sales. Ripple was recently fined $125 million for defrauding institutional investors, significantly less than the $2 billion penalty sought by the SEC. Despite this, the SEC is pushing forward with the appeal, which may result in higher penalties if successful.

Fagel notes that the SEC’s true interest lies in establishing a legal precedent requiring registration for Ripple’s sales, rather than seeking financial penalties. This development has sparked concerns among investors and industry experts, who are closely watching the case’s outcome.

XRP Price To Witness Further Dip?

The appeal’s implications in the Ripple Vs SEC battle extend beyond XRP price impact. In other words, it could potentially influence the regulatory landscape for digital assets and set important precedents for the cryptocurrency sector.

Besides, Ripple’s native crypto has noted volatile trading lately, sparking discussions in the market. As of writing, XRP price fell over 2% to $0.5282, with its one-day trading volume soaring 45% to $1.15 billion. The crypto has touched a high of $0.5454 in the last 24 hours while crossing the brief $0.66 mark at September’s end.

Meanwhile, this ongoing volatility has sparked discussions over a further decline in the crypto price, especially amid soaring uncertainties in the legal battle. However, Ripple CLO Stuart Alderoty appears to have remained confident and said that the firm might consider a cross-appeal in the case.

In addition, many top experts remained bullish on the crypto’s future, given the recent developments. For instance, Bitwise XRP ETF filing has fueled speculations with a top expert predicting XRP price to hit $5.

✓ Share:

Rupam Roy

Rupam is a seasoned professional with three years of experience in the financial market, where he has developed a reputation as a meticulous research analyst and insightful journalist. He thrives on exploring the dynamic nuances of the financial landscape. Currently serving as a sub-editor at Coingape, Rupam’s expertise extends beyond conventional boundaries. His role involves breaking stories, analyzing AI-related developments, providing real-time updates on the crypto market, and presenting insightful economic news.
Rupam’s career is characterized by a deep passion for unraveling the complexities of finance and delivering impactful stories that resonate with a diverse audience.

Disclaimer: The presented content may include the personal opinion of the author and is subject to market condition. Do your market research before investing in cryptocurrencies. The author or the publication does not hold any responsibility for your personal financial loss.


Source link

8 10, 2024

Crypto wallets deter gamers from trying Web3 games: Report — TradingView News

By |2024-10-08T12:49:32+03:00October 8, 2024|News, NFT News|0 Comments


The complicated process of using cryptocurrency wallets is one of the main reasons some gamers haven’t tried Web3 games.

Web3 gaming protocol Elympics collaborated with the Blockchain Game Alliance (BGA) and blockchain game data tracker PlayToEarn to produce an industry report titled: “The Future of Web3 Gaming is Competitive: Global Gaming Report 2024.” The report examined the current state of blockchain gaming and surveyed 1,000 gamers worldwide to gather their thoughts on Web3 games.

The report asked gamers why they play games and why some survey participants have not tried playing blockchain-based games. 

Crypto wallets deter gamers from trying Web3 games

More than 10% of survey participants said complicated cryptocurrency wallets are the primary reason they haven’t played a blockchain game. Meanwhile, 7.3% of those surveyed said they don’t understand the value behind Web3 gaming.

Another 2.4% of gamers said they are content with Web2 gaming and feel it’s enough for them. Additionally, 9.1% of participants said blockchain-based gaming doesn’t appeal to them.

When asked why they play games, many participants cited airdrops and the potential to earn money as their primary reasons. Another popular reason was the opportunity to compete with other players. 

In the report, Elympics CEO Michal Dabrowski said that Web3 gaming has “struggled” to appeal to mainstream gamers. However, the executive believes that there’s a significant shift coming. Dabrowski wrote: 

“The entry of infrastructure players like TON into the web3 gaming space is introducing powerful social distribution networks and highly engaged communities.”

Dabrowski added that as more developers choose to build within Web3, high-quality games will gain more traction.

Highlighting the importance of convenience

While complications with crypto wallets may have prevented some gamers from trying out Web3 gamers, crypto projects like The Open Network (TON) have been trying to solve this barrier to adoption. 

On April 19, TON Foundation director of investments Justin Hyun told Cointelegraph that Telegram’s Mini Apps would be so convenient that users would interact with crypto without noticing it.

Since then, many users have been flocking to the TON ecosystem to play clicker games. Projects like Hamster Kombat have attracted over 300 million users, onboarding Telegram users to Web3 games. 


Source link

8 10, 2024

Best Weight Loss Supplements of 2024: 11 Products That Work

By |2024-10-08T11:44:26+03:00October 8, 2024|Dietary Supplements News, News|0 Comments


Do you feel like you don’t eat much but still aren’t losing weight? Many reach weight loss plateaus, and it’s only natural to lose sight of your goals when you are down in motivation. That’s where one needs to turn to the best weight loss supplements that may help in shedding those stubborn extra pounds.

This guide aims to help you choose the best option for your needs, overviews top fat loss products like PhenQ and offers tips on what to look out for. Let’s get started!  

Best Weight Loss Supplements 

1. PhenQ – Best Weight Loss Supplement Overall

(credit: FitLiving graphics team)

Pros 

  • Capsimax promotes fat-burning
  • Offers multiple weight loss benefits
  • Innoslim helps reduce cravings
  • Caffeine boosts energy levels

Cons 

  • Some ingredients are part of proprietary blends, which do not list the exact doses

Who Is PhenQ Best For?

PhenQ is one of the best weight loss supplements for people who need extra fat-burning support, since it has thermogenic effects and a multi-pronged approach. It may work as an appetite suppressant, elevate your energy levels, and burn body fat. 

It contains ingredients such as a-Lacys Reset, Capsimax powder, caffeine, chromium picolinate, L-carnitine fumarate, and nopal. Capsimax increases thermogenesis and reduces fat accumulation. It may prevent weight gain during a high-fat diet [1].

Who Should Avoid PhenQ?

  • Caffeine-intolerant people may experience jitteriness and disrupted sleep patterns. 

Dosage

  • 1 capsule in the morning and 1 during lunchtime

Cost

  • 1 bottle: $69.99
  • 2 bottles + 1 free: $139.99
  • 3 bottles + 2 free: $209.99

Summary

PhenQ is one of the best weight loss supplements with thermogenic ingredients that raise your body temperature and accelerate metabolism to enhance fat burning. 

>>Check the best price for PhenQ here

2. KetoCharge – Best for Keto Dieters

Pros 

  • Promotes ketosis
  • May reduce the side effects of a keto diet
  • Calcium and magnesium may enhance bone and muscle health
  • Minimizes cravings

Cons 

  • Does not contain potassium 
  • No specific doses of each ingredient are listed

Who Is KetoCharge Best For?

(credit: FitLiving graphics team)

KetoCharge is one of the best weight loss supplements for people who aim to enhance ketosis while following the keto diet.

Aside from improving your gut health, it also reduces or eliminates the “keto flu,” including symptoms such as muscle cramps and poor concentration due to a drop in electrolyte minerals like sodium, potassium, calcium, and magnesium [2].

Who Should Avoid KetoCharge?

  • People not on a keto diet may see fewer benefits from KetoCharge. 

Dosage

  • 2 capsules before breakfast

Cost

  • 1-month supply: $59.99
  • 2-month supply + 1 free: $119.99
  • 3-month supply + 3 free: $179.99 

Summary

KetoCharge is considered one of the best weight loss supplements for keto dieters, as it helps induce and maintain a state of ketosis and makes the diet more effective.

>>Check the best price for KetoCharge here

3. Phen24 – Best for Day-and-Night Support

(credit: FitLiving graphics team)

Pros 

  • Serotonin-boosting ingredients in the night formula 
  • Guarana may boost energy in the day 
  • Contains essential B vitamins for energy production
  • May help reduce cravings

Cons 

  • Serotonin-boosting ingredients may react with antidepressants

Who Is Phen24 Best For? 

Phen24 combines the best weight loss supplements for people who need energy during the day and reduced cravings at night.

The daytime capsules include caffeine, iodine, cayenne powder, l-phenylalanine, and guarana extract to boost metabolism and energy. The nighttime formula includes chromium, vitamin B6, Griffonia, green tea, choline, hops, and glucomannan.

Griffonia is a unique herbal extract in that it is rich in 5-HTP, the precursor to serotonin. The calming, mood-lifting effect of serotonin is often what you’re seeking when you crave sugary foods so you don’t feel the need to binge late at night [3].

Additionally, vitamins B1, B5, B6, and biotin are essential for producing energy from sugar. Vitamin C helps your body make carnitine, which promotes fat-burning for energy [4].

Who Should Avoid Phen24?

  • Individuals taking antidepressants should avoid taking these supplements or at least consult a healthcare professional before introducing Phen24. 

Dosage

  • 1 capsule of the day formula in the morning and 2 capsules of the night formula before bed.

Cost

  • 1-month supply: $69.99
  • 2-month supply + 1 free: $139.99
  • 3-month supply + 2 free: $209.99

Summary

Phen24 is unique among the best weight loss supplements since the dual package supports your day and night metabolism. It’s a well-rounded solution and suits many different users.

>>Check the best price for Phen24 here

4. PrimeShred – Best for Men

(credit: FitLiving graphics team)

Pros 

  • Coffee and green tea extracts for fat-burning
  • B vitamins for cellular energy production 
  • Cayenne pepper boosts thermogenesis 
  • Suitable for vegans and vegetarians 
  • May enhance focus

Cons 

  • May interact with dopamine-boosting medication 

Who Is PrimeShred Best For? 

PrimeShred is the best weight loss supplement for men who need a product that can burn fat, preserve muscles, and provide extra motivation and energy. It includes green tea extract, caffeine, vitamin B complex, rhodiola rosea root, and L-tyrosine. 

These may boost metabolism, suppress appetite, and increase energy levels, where a combination of caffeine and rhodiola effectively enhances dopamine to boost motivation and neuromuscular function. 

Caffeine also raises adrenaline, while rhodiola boosts red blood cells and energy production to improve strength [5].

Who Should Avoid PrimeShred?

  • Individuals who take ADHD or other prescription medications to increase dopamine should avoid PrimeShred.

Dosage

  • 3 capsules before breakfast

Cost

  • 1 bottle: $59.99
  • 2 bottles + 1 free: $119.98
  • 3 bottles + 2 free: $179.97

Summary

PrimeShred is one of the best weight loss supplements for men aiming to boost fat loss while preserving muscle mass.

>>Check the best price for PrimeShred here

5. CalmLean – Best Stimulant-Free Option 

(credit: FitLiving graphics team)

Pros 

  • No caffeine or other stimulants 
  • Capsaicin promotes thermogenesis
  • Boosts metabolism
  • Reduces cravings

Cons 

  • May not offer multiple weight loss benefits

Overview

CalmLean is PrimeGENIX’s natural fat burner and a gentler alternative to the best weight loss supplements with stimulants.

Who Is CalmLean Best For? 

CalmLean is considered one of the best weight loss supplements for those who can’t stand stimulants such as caffeine. The formula still promotes thermogenesis to facilitate weight loss but relies on ForsLean to help reduce insulin, which promotes fat accumulation. 

Not only does it help you burn fat, but C. forskohlii can also protect lean mass and reduce waist circumference [6]. 

Who Should Avoid CalmLean?

  • Those looking for caffeine’s performance-boosting benefits

Dosage

Cost

  • 1 bottle: $59.95
  • 3 bottles: $169.95
  • 6 bottles: $319.95 

Summary

CalmLean presents a stimulant-free formula for those aiming to lose weight without the typical jittery feelings or other side effects associated with stimulant-based weight loss supplements.

>>Check the best price for CalmLean here

6. Brutal Force ACUT – Best Anavar Alternative

(credit: FitLiving graphics team)

Pros 

  • Promotes thermogenesis
  • Boosts lean muscle growth and energy levels
  • Suppresses appetite with konjac root
  • Gluten and soy-free formula
  • Legal Anavar alternative

Cons 

  • Contains soy and dairy products 

Who Is Brutal Force ACUT Best For? 

We recommend Brutal Force ACUT for individuals aiming to shed excess fat while retaining muscle mass, especially during bodybuilding or cutting cycles. It has similar effects to the anabolic steroid Anavar.

Branched-chain amino acids (BCAAs) may prevent muscle loss during a low-calorie diet [7], while whey protein powder can be high in cysteine, an amino acid that your body uses to make its own antioxidants to protect your muscles during intense exercise [8]. 

Who Should Avoid Brutal Force ACUT?

  • People with dairy allergies should avoid ACUT.

Dosage

  • 3 capsules after workouts 

Cost

  • 1-month supply: $59.99
  • 3-month supply: $119.98

Summary

Brutal Force ACUT emerges as a viable choice among weight loss supplements. It encourages fat loss, muscle retention, and enhanced workout performance. It is a low-risk and legal alternative to the steroid Anavar.

>>Check the best price for Brutal Force ACUT here

7. Brutal Force WINCUT – Best Winstrol Alternative

(credit: FitLiving graphics team)

Pros 

  • Designed for cutting and achieving a lean appearance
  • Boosts cellular energy production and metabolism
  • Low-risk Winstrol alternative 
  • No caffeine 

Cons 

  • Fewer active ingredients than many competitors

Who Is Brutal Force WINCUT Best For?

Brutal Force WINCUT is particularly suited for assisting athletes and bodybuilders in their cutting cycles. It can help shed body fat, retain lean muscle, and improve their overall physique. 

It is a legal and low-risk alternative to the steroid Winstrol (Stanozolol) with acetyl-l-carnitine as one of its major ingredients, which can boost fat burning for energy to increase your exercise performance [9]. 

Who Should Avoid Brutal Force WINCUT?

  • Those with liver issues should avoid it.

Dosage

  • 2 capsules before exercise

Cost

  • 1-month supply: $59.99
  • 3-month supply: $119.98 

Summary

Brutal Force WINCUT shines as a low-risk alternative to the steroid Winstrol, offering many of its benefits through a fully natural ingredient profile.

>>Check the best price for Brutal Force WINCUT here

8. Trimtone – Best Metabolism Booster

(credit: FitLiving graphics team)

Pros 

  • Speeds up metabolic rate
  • Contains glucomannan to tame cravings
  • Caffeine boosts energy levels and thermogenesis
  • Simple dosage

Cons 

  • It may reduce medication and nutrient absorption 

Who Is Trimtone Best For?

Trimtone is ideal for women who plan to accelerate their weight loss journey by boosting their metabolism. These top weight loss supplements can help curb their appetite, burn fat, and provide extra energy

Grains of paradise can enhance thermogenesis, the energy production as heat, by increasing your body’s proportion of brown fat. This type of fat generates energy, while white fat does not [10].

Additionally, green tea may assist weight loss in women with polycystic ovarian syndrome (PCOS), a condition that features stubborn excess body fat. In one study, women lost an average of 2.8 kilograms thanks to green tea extract, reducing their risk of developing metabolic syndrome [11].

Who Should Avoid Trimtone?

  • People taking prescription medications should avoid it or consult a healthcare professional.

Dosage

  • 1 capsule before breakfast

Cost

  • 1 bottle: $49.99
  • 2 bottles + 1 free: $99.99
  • 3 bottles + 2 free: $149.99 

Summary

Trimtone may help you lose unwanted weight by revving up your metabolism and protecting your health long-term.

>>Check the best price for Trimtone here

9. Instant Knockout Cut – Best for Active People

(credit: FitLiving graphics team)

Pros 

  • Vitamin D supports bone health
  • Cayenne and green tea promote fat loss 
  • Vitamins B6 and B12 encourage red blood cell production
  • Vegetarian and vegan-friendly

Cons 

  • Glucomannan may interfere with medication absorption 

Who Is Instant Knockout Cut Best For?

Instant Knockout Cut is one of the best weight loss supplements for active users aiming to cut weight and get in shape swiftly. The formula may heighten metabolism and energy levels.

Cayenne pepper and black pepper extracts have been studied for their metabolic, antioxidant, and anti-inflammatory effects. Additionally, pepper extracts may have thermogenic, insulin-regulating, and cholesterol-lowering effects, especially alongside caffeine and green tea extract [12]. 

Who Should Avoid Instant Knockout Cut? 

  • People taking narrow therapeutic index (NTI) medications should avoid it.

Dosage

  • 1 capsule four times a day

Cost

  • 1 bottle: $65
  • 2 bottles: $130
  • 3 bottles + 1 free: $195

Summary

Instant Knockout Cut is one of the best weight loss supplements for physically active men and women. It helps burn fat and protect lean mass during vigorous exercise.

>>Check the best price for Instant Knockout Cut here

10. Zotrim – Best for Appetite Suppression

(credit: FitLiving graphics team)

Pros

  • Natural herbal ingredients
  • Reduces appetite and calorie intake
  • May help you be full for longer
  • Boosts energy and metabolism

Cons

  • May cause mild digestive discomfort in some users

Who Is Zotrim Best For?

Zotrim is ideal for people who struggle with overeating and need help controlling their appetite. Its natural formula is particularly suited for those who prefer herbal supplements.

Who Should Avoid Zotrim?

People sensitive to caffeine should exercise caution, as Zotrim contains yerba mate.

Dosage

Take two to three tablets with water before each main meal.

Cost

A one-month supply in a one-time purchase costs $59.99. You can get a 20% iscount on your first order, 30% on your second, and 40% on all recurring orders if you subscribe for a delivery every 30 days. Subscribers also get three gifts during the first year.

Summary

Zotrim stands out among weight loss supplements for its focus on appetite suppression. It features herbal ingredients with a reputation for controlling cravings. It may help users reduce calorie intake and stay on track with their diet.

>>Find the best price for Zotrim here

11. Transparent Labs Body Recomp – Best Body Recomposition Support

(credit: FitLiving graphics team)

Pros

  • Supports both fat loss and muscle gain
  • Transparent labeling with exact doses
  • Stimulant-free formula

Cons

  • Pricier than many competitors in the long run

Who Is Transparent Labs Body Recomp Best For?

Transparent Labs Body Recomp is ideal for fitness enthusiasts and athletes looking to lose fat and gain muscle simultaneously. It’s particularly suited for those engaged in resistance training.

Who Should Avoid Transparent Labs Body Recomp?

You should avoid Body Recomp if you have liver and kidney problems, heart and blood pressure conditions, hormonal imbalances, and bleeding disorders. Some of the ingredients may put additional stress on the kidneys, affect heart rate, and/or influence hormone levels, so at least consult a healthcare professional before use.

Dosage

Take two capsules two times a day, preferably with food.

Cost

In a one-time purchase, a bottle costs $54.99. If you choose to use it in the long run and subscribe for regular deliveries, you can save 10% and get the bottle for $49.49 with free shipping.

Summary

Transparent Labs Body Recomp offers a unique approach among the best weight loss supplements by supporting body recomposition, the process of losing fat while gaining muscle. Its transparent formula and well-known ingredients make it a solid choice for many enthusiasts.

>>Find the best price for Body Recomp here

What Are Weight Loss Supplements?

Weight loss supplements are products, often in capsule form, that help reduce body weight by suppressing appetite, improving metabolism, or blocking fat absorption. They contain a mix of vitamins for burning belly fat, as well as minerals, herbs, or other natural ingredients.

Types of Weight Loss Supplements

We discuss different types of supplements and how they work in more detail below.

Fat Burners (Thermogenics)

The best fat burners can increase metabolism and thermogenesis to enhance calorie and fat loss. For example, green coffee bean extract can improve fatty acid transport and energy-burning rate [16].

Appetite Suppressants (Anorectics)

The best appetite suppressants work by curbing hunger signals in the brain to reduce caloric intake.

Carb Blockers

Carb blocker supplements help prevent the breakdown and absorption of carbohydrates to reduce calorie intake.

Prescription Weight Loss Drugs

Some people find that the best weight loss pills that actually work for their individual needs are prescription meds: 

  • Orlistat
  • Xenical
  • Contrave
  • Phentermine
  • Belviq

Factors to Consider When Choosing the Best Weight Loss Supplements

Keep these factors in mind when comparing the best weight loss supplements:

  • Natural and scientifically-backed active ingredients
  • Manageable dosage
  • Preferred supplement form
  • Product cost

Ingredients Found in Over-the-Counter Dietary Supplements for Weight Loss

Here are some common ingredients in the best weight loss supplements:

  • Glucomannan: Expands in water, takes up space in the stomach, and makes you more satisfied with smaller meals
  • Green Tea Extract: Linked to improved appetite suppression and fat burning. Its caffeine content boosts metabolism and thermogenesis by slowing noradrenaline breakdown 
  • Chromium or Chromium Picolinate: A mineral that improves blood glucose levels, aids in weight loss, and provides metabolic benefits [16]
  • Cayenne Pepper: A thermogenic ingredient and antioxidant
  • L-Carnitine: An amino acid that helps transport fatty acids into the mitochondria
  • Green Coffee Extract: Contains chlorogenic acid that may lower blood pressure, prevent aging, and burn fat. Its caffeine content curbs appetite and burns fat
  • Caffeine Anhydrous: A stimulant that boosts metabolism, increases fat burning, suppresses appetite, increases energy levels, and improves focus
  • Forskolin: The main active component of Coleus forskohlii that aids in the release of fatty acids from stored fat [16]
  • Conjugated Linoleic Acid (CLA): May increase fat metabolism and reduce body fat while preserving muscle mass

Potential Side Effects of Weight Loss Supplements

Like any dietary supplement, weight loss supplements may have potential side effects. Consult a healthcare professional if you experience any adverse effects.

Where to Buy the Best Weight Loss Supplements

It’s best to purchase the best weight loss supplements from the official product website instead of third-party sellers.

Frequently Asked Questions About Weight Loss Supplements

Still have questions about weight loss supplements? We address common queries and concerns about the best weight loss supplements below.

Are Natural Diet Supplements Effective for Weight Management?

Some dietary supplements are effective for short—or long-term weight management because they contain evidence-backed ingredients. However, individual responses vary, and you should contrast potential benefits with your needs.

What Is the Most Effective Weight Loss Supplement Available?

As mentioned above, the effectiveness of weight loss supplements can vary with each user. Look for supplements that have high doses of active ingredients for increased potential to get the actual benefits promised, with PhenQ and Phen24 often praised for exactly that.

Can Weight Loss Supplements Work Without a Healthy Diet and Exercise?

The answer is not as straightforward as the question, but it’s important to note that a balanced diet and regular exercise are necessary to achieve sustainable weight loss, with or without supplements.

Best Weight Loss Supplements: Final Note

Finding a product that actually works for you takes time and effort as you explore top weight loss supplements in the market, like PhenQ. You want products with scientifically backed ingredients that work toward the promised goal, from boosted energy to fat burning, so do your due diligence and choose a supplement that ticks all the boxes!

>>Check the best price for PhenQ here

References

  1. Mariwala, Javahar Kohli et al. “Accumulating evidence to support the safe and efficacious use of a proprietary blend of capsaicinoids in mediating risk factors for obesity.” Food science & nutrition vol. 9,6 2823-2835. 4 May. 2021, doi:10.1002/fsn3.2122
  2. Rabast, U et al. “Loss of weight, sodium and water in obese persons consuming a high- or low-carbohydrate diet.” Annals of nutrition & metabolism vol. 25,6 (1981): 341-9. doi:10.1159/000176515
  3. Rondanelli, M et al. “Relationship between the absorption of 5-hydroxytryptophan from an integrated diet, by means of Griffonia simplicifolia extract, and the effect on satiety in overweight females after oral spray administration.” Eating and weight disorders: EWD vol. 17,1 (2012): e22-8. doi:10.3275/8165
  4. Tardy, Anne-Laure et al. “Vitamins and Minerals for Energy, Fatigue and Cognition: A Narrative Review of the Biochemical and Clinical Evidence.” Nutrients vol. 12,1 228. 16 Jan. 2020, doi:10.3390/nu12010228
  5. Liu, Chang et al. “Synergistic Effect of Rhodiola rosea and Caffeine Supplementation on the Improvement of Muscle Strength and Muscular Endurance: A Pilot Study for Rats, Resistance Exercise-Untrained and -Trained Volunteers.” Nutrients vol. 15,3 582. 22 Jan. 2023, doi:10.3390/nu15030582
  6. Loftus, Hayley L et al. “Coleus forskohlii Extract Supplementation in Conjunction with a Hypocaloric Diet Reduces the Risk Factors of Metabolic Syndrome in Overweight and Obese Subjects: A Randomized Controlled Trial.” Nutrients vol. 7,11 9508-22. 17 Nov. 2015, doi:10.3390/nu7115483
  7. Dudgeon, Wesley David et al. “In a single-blind, matched group design: branched-chain amino acid supplementation and resistance training maintains lean body mass during a caloric restricted diet.” Journal of the International Society of Sports Nutrition vol. 13 1. 5 Jan. 2016, doi:10.1186/s12970-015-0112-9
  8. Veskoukis, Aristidis S et al. “Whey protein boosts the antioxidant profile of rats by enhancing the activities of crucial antioxidant enzymes in a tissue-specific manner.” Food and chemical toxicology : an international journal published for the British Industrial Biological Research Association vol. 142 (2020): 111508. doi:10.1016/j.fct.2020.111508
  9. Bruls, Yvonne Mh et al. “Carnitine supplementation improves metabolic flexibility and skeletal muscle acetylcarnitine formation in volunteers with impaired glucose tolerance: A randomised controlled trial.” EBioMedicine vol. 49 (2019): 318-330. doi:10.1016/j.ebiom.2019.10.017
  10. Yoneshiro, Takeshi et al. “Prolonged Treatment with Grains of Paradise (Aframomum melegueta) Extract Recruits Adaptive Thermogenesis and Reduces Body Fat in Humans with Low Brown Fat Activity.” Journal of nutritional science and vitaminology vol. 67,2 (2021): 99-104. doi:10.3177/jnsv.67.99
  11. Colonetti, Laura et al. “Green tea promotes weight loss in women with polycystic ovary syndrome: Systematic review and meta-analysis.” Nutrition research (New York, N.Y.) vol. 104 (2022): 1-9. doi:10.1016/j.nutres.2022.03.009
  12. Dludla, Phiwayinkosi V et al. “Bioactive Properties, Bioavailability Profiles, and Clinical Evidence of the Potential Benefits of Black Pepper (Piper nigrum) and Red Pepper (Capsicum annum) against Diverse Metabolic Complications.” Molecules (Basel, Switzerland) vol. 28,18 6569. 11 Sep. 2023, doi:10.3390/molecules28186569
  13. Harrold, J A et al. “Acute effects of a herb extract formulation and inulin fibre on appetite, energy intake and food choice.” Appetite vol. 62 (2013): 84-90. doi:10.1016/j.appet.2012.11.018
  14. Devaraj, Ramya Devi et al. “Health-promoting effects of konjac glucomannan and its practical applications: A critical review.” International journal of biological macromolecules vol. 126 (2019): 273-281. doi:10.1016/j.ijbiomac.2018.12.203
  15. Elsawy, Gehan et al. “Effect of choline supplementation on rapid weight loss and biochemical variables among female taekwondo and judo athletes.” Journal of human kinetics vol. 40 77-82. 9 Apr. 2014, doi:10.2478/hukin-2014-0009
  16. Bonetti, Gabriele et al. “Dietary supplements for obesity.” Journal of preventive medicine and hygiene vol. 63,2 Suppl 3 E160-E168. 17 Oct. 2022, doi:10.15167/2421-4248/jpmh2022.63.2S3.2757

Disclaimer: Content quality approved by JPost.

JPost oversees the native, paid, and sponsored content on this website and guarantees quality, relevance, and value for the audience. However, articles attributed to this byline are provided by paying advertisers and the opinions expressed in the content do not necessarily express the opinions of JPost.

The sponsor retains the responsibility of this content and has the copyright of the material. For all health concerns, it is best to seek the advice of your doctor or a legal practitioner.

Content quality approved by JPost. JPost oversees the native, paid, and sponsored content on this website and guarantees quality, relevance, and value for the audience. However, articles attributed to this byline are provided by paying advertisers and the opinions expressed in the content do not necessarily express the opinions of JPost.The sponsor retains the responsibility of this content and has the copyright of the material. For all health concerns, it is best to seek the advice of your doctor or a legal practitioner.


Source link

8 10, 2024

EUR/USD Forecast Today 08/10: Bounce or Breakdown? (Video)

By |2024-10-08T11:10:43+03:00October 8, 2024|Forex News, News|0 Comments

  • The Euro has found a little bit of support near the 1.0950 level, an area that has been important multiple times in the past.
  • As a result, I do think that we may get a little bit of a bounce.
  • After all, it would make a certain amount of sense due to the fact that we have seen so much in the way of selling pressure that sooner or later, we need to get some type of bounce from here.

That being said, if we were to break down below the 1.09 level, then I think you have real issues at this juncture where we could see the US dollar really take off. That being said, I do think that it’s overdone and a bounce makes a certain amount of sense. Perhaps reaching the 50 day EMA, which is at the 1.1050 level. Ultimately, this is a market that is going to reflect risk appetite and if we start to see risk appetite really fall apart, then you probably see the US dollar strengthen. In general, this is a market that I think continues to be range bound overall. As a result, I think you continue to see a lot of choppiness and therefore you need to be cautious with your position sizing. But with this, I do think that we’re getting a little supported.

On the Breakdown

If we were to break down below the 200-day EMA on a breakdown, that really could send this market reeling, perhaps down to the 1.0775 level, which I think at that point in time you would see most RIS assets getting absolutely hammered. It’s not necessarily that the euro is extraordinarily risky, it’s just that it isn’t the dollar, and that’s probably the big thing to take away. All things being equal, this is a market that I think continues to dictate what you want to do with the US dollar against many other currencies, not just this one.

Ready to trade our EUR/USD Forex analysis? We’ve made a list of the best forex demo accounts worth trading with. 

Source link

8 10, 2024

Watch the Use of Colored Contacts this Halloween

By |2024-10-08T10:56:19+03:00October 8, 2024|Fitness News, News|0 Comments


Eye Injury Prevention Month is observed every October to promote awareness about eye safety and prevent injuries

“Wearing colored contacts may seem harmless. But beware: colored contact lenses can severely damage your eyes if you don’t buy them with a prescription. They can even cause permanent blindness if they’re not fitted by an eye specialist.” according to American Academy of Opthamology (AAO)

“Consumers need to know that permanent eye damage can occur from using non-prescription lenses,” says Thomas Steinemann, MD, an ophthalmologist at MetroHealth Medical Center in Cleveland, Ohio, and member of the American Academy of Ophthalmology. “I have seen far too many serious cases in both children and adults from using decorative lenses.”

Watch the Use of Colored Contacts this Halloween

Is It Safe To Wear Non-Prescription Colored Contacts?

It is not safe to wear contact lenses that were not prescribed especially for you. This includes contact lenses purchased without a prescription and contact lenses prescribed for someone else. Your eyes are at risk of serious harm — and potentially blindness — when you wear contact lenses that were not prescribed specifically for you.

Contact lenses advertised as ‘one size fits all’ or ‘no need to see an eye doctor’ are not safe. The ‘one size fits all’ claim is misleading and dangerous. Contact lenses must be tailored to each individual. Lenses that are not the correct size for your eye may result in serious harm and could destroy your vision.

Poorly fitting contact lenses can scratch your eye — or worse

  • Corneal abrasions,
  • Corneal ulcers, and
  • Bacterial infections like keratitis, which are painful and potentially blinding.

Colored contacts also might let less oxygen through to the eye. This is because the paints and pigments make the lenses thicker and less breathable.

Treating this damage can require eye surgery, like a corneal transplant. And treatment doesn’t always work. People have been blinded by colored contact lenses.

How to Buy Colored Contacts?

  • Get an eye exam from a licensed eye care professional. They will measure each eye and talk to you about proper contact lens care.
  • Get a valid prescription that includes the brand name, lens measurements, and expiration date.
  • Buy the colored contacts from a retailer who asks for a prescription.
  • Follow the contact lens care directions for cleaning, disinfecting, and wearing the lenses.
  • Never share contact lenses with another person.
  • Get follow-up exams as directed by your eye care provider.

For further details visit: https://www.aao.org/eye-health/halloween-cosplay-colorful-contacts-eye-safety

Disclaimer
The Content is not intended to be a substitute for professional medical advice, diagnosis, or treatment. Always seek the advice of your physician or other qualified health provider with any questions you may have regarding a medical condition.


Source link

8 10, 2024

XAU/USD threatens key $2,630 support ahead of more Fedspeak

By |2024-10-08T10:41:09+03:00October 8, 2024|Forex News, News|0 Comments


  • Gold price extends a five-day losing streak early Tuesday, despite risk aversion.    
  • The US Dollar pulls back with Treasury yields following dovish Fedspeak.                      
  • Gold price threatens key $2,630 support; will it defend it amid bullish daily RSI?

Gold price maintains its corrective decline early Tuesday, looking to threaten the lower boundary of the recent range at $2,630. The focus now remains on the Middle East tensions, additional Chinese stimulus rollout and speeches from US Federal Reserve (Fed) policymakers for fresh directives.

Gold price reels from China’s economic pain  

Gold price is struggling to find a foothold, as sellers remain in control amid the re-emergence of worries surrounding China’s economic prospects, as Chinese traders return after a week-long holiday break.

Even though Chinese stocks re-opened with a bang, no announcements on further stimulus so far and the National Development and Reform Commission’s (NDRC) gloomy outlook on China’s economy intensified risk aversion across Asia.

China’s state planner, the NDRC, said in its press conference that “the downward pressure on China’s economy is increasing.” Gold price, therefore, remains undermined, as China is the world’s top Gold consumer.

The Gold price correction, however, appears cushioned by a broad pullback in the US Dollar (USD) alongside the US Treasury bond yields, following the dovish remarks from  St. Louis Fed President Alberto Musalem. Musalem said late Monday that “further gradual reductions in the policy rate will likely be appropriate over time,” adding that “I will not prejudge the size or timing of future adjustments to policy.”

His comments fuelled a fresh leg down in the USD, despite markets ruling out a 50 basis points (bps) Fed rate cut next month. Markets are currently pricing in about an 86% chance that the Fed will opt for a 25 bps rate cut at its next meeting, the CME Group’s FedWatch Tool shows.

Looking ahead, speeches from Atlanta Fed President Raphael Bostic and Fed Vice Chairman Philip Jefferson will be closely scrutinized in the absence of any top-tier economic data releases from the US later on Tuesday.

Traders will also pay attention to the escalating conflict between Israel and Iran, especially after the Iran-backed militant group, Hezbollah, fired dozens of rockets at Israel’s third-largest city, Haifa. Meanwhile, the Israeli military has described its recent ground operation in Lebanon as “localized, limited and targeted,” but it has steadily increased in scale beginning last week.

Gold price technical analysis: Daily chart

Following a gradual decline over the last four days, Gold buyers are seen challenging the key static support of $2,630.

The 14-day Relative Strength Index (RSI), however, stays well above the midline, currently near 62, suggesting that any decline in Gold price could be likely bought into.

Gold price needs a daily candlestick closing above the strong resistance near $2,670 to negate the near-term downside pressure.

The next resistance is aligned at the record high of $2,686. Further up, buyers will target the $2,700 round level.

On the flip side, Gold sellers must crack the intermittent low of $2,630 on a daily closing basis to unleash further correction toward the $2,600 threshold.

Ahead of that level, the 21-day Simple Moving Average (SMA) at $2,614 could offer a temporary relief to buyers.  

Gold FAQs

Gold has played a key role in human’s history as it has been widely used as a store of value and medium of exchange. Currently, apart from its shine and usage for jewelry, the precious metal is widely seen as a safe-haven asset, meaning that it is considered a good investment during turbulent times. Gold is also widely seen as a hedge against inflation and against depreciating currencies as it doesn’t rely on any specific issuer or government.

Central banks are the biggest Gold holders. In their aim to support their currencies in turbulent times, central banks tend to diversify their reserves and buy Gold to improve the perceived strength of the economy and the currency. High Gold reserves can be a source of trust for a country’s solvency. Central banks added 1,136 tonnes of Gold worth around $70 billion to their reserves in 2022, according to data from the World Gold Council. This is the highest yearly purchase since records began. Central banks from emerging economies such as China, India and Turkey are quickly increasing their Gold reserves.

Gold has an inverse correlation with the US Dollar and US Treasuries, which are both major reserve and safe-haven assets. When the Dollar depreciates, Gold tends to rise, enabling investors and central banks to diversify their assets in turbulent times. Gold is also inversely correlated with risk assets. A rally in the stock market tends to weaken Gold price, while sell-offs in riskier markets tend to favor the precious metal.

The price can move due to a wide range of factors. Geopolitical instability or fears of a deep recession can quickly make Gold price escalate due to its safe-haven status. As a yield-less asset, Gold tends to rise with lower interest rates, while higher cost of money usually weighs down on the yellow metal. Still, most moves depend on how the US Dollar (USD) behaves as the asset is priced in dollars (XAU/USD). A strong Dollar tends to keep the price of Gold controlled, whereas a weaker Dollar is likely to push Gold prices up.


Source link

8 10, 2024

Why Experts Warn Against Taking Kourtney Kardashian’s GLP-1

By |2024-10-08T09:43:30+03:00October 8, 2024|Dietary Supplements News, News|0 Comments


It’s been brewing for a while, but this year has seen interest in weight-loss drugs and supplements sky-rocket. Ozempic is the word on everyone’s lips, and research reveals that the market for weight management supplements is worth over five billion USD, with analysts predicting a 14% uptick in the next ten years.

The approval of semiglutide (Ozempic) for weight loss purposes back in 2018 (US) and 2019 (UK) has led to what can only be described as a cultural phenomenon: those who have used it are evangelical about it – and there’s no denying that it’s helped celebrities and mere mortals alike shed the pounds.


Source link

8 10, 2024

how copper will shape our future

By |2024-10-08T08:40:03+03:00October 8, 2024|Forex News, News|0 Comments


Please refer to the Important Notice at the end of this article1

Copper has shaped human history and civilisation for millennia. In the 20th century, the story of copper was inextricably linked to the rise of electricity demand. As we harnessed electrical power, copper became an indispensable material, crucial to our energy systems and modern technology. 

Through the 21st century, we expect copper to remain an essential building block to modern life as the world seeks to improve living standards for billions of people, transitions towards a net zero greenhouse gas (GHG) emissions economy, and further digitalises its industries and societies. 

In this article, we discuss:

  • Why we believe global copper demand will grow by around 70% to over 50 million tonnes (Mt) a year by 2050 and our view on how copper’s role in multiple applications will provide demand resilience.
  • The looming global copper supply challenge as existing copper mines age, with the pipeline of potential projects less healthy than in previous cycles. Both brownfield and greenfield projects are expected to face cost and stakeholder challenges.
  • Why ‘long-run marginal cost’-based inducement is still our preferred approach to forecasting price in the long run.

Demand

Total global copper demand has grown at a 3.1% compound annual growth rate (CAGR) over the last 75 years – but this growth rate has been slowing. It was only 1.9% over the 15 years to 2021. Looking to 2035, however, we expect this growth rate to jump back to 2.6% annually. 

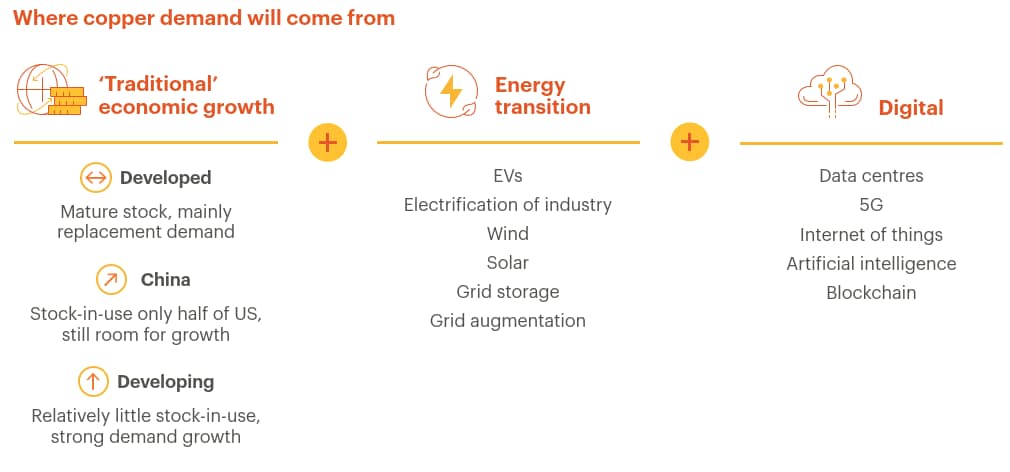
We believe this reversal will come from a combination of three key themes: ‘Traditional’ economic growth, and the newer themes of the ‘Energy Transition’ and ‘Digital’ (primarily data centres).

‘Traditional’ demand refers to the basic relationship between economic growth, electricity consumption and copper. Through the 20th century and into the 21st, as countries developed, electricity became accessible to industry and homes and led to the creation of products that lifted living standards: lighting, washing machines, refrigerators, air conditioners, radio and television, computers and smartphones. It is not only these products that need copper; so do the factories and supply chains that produce and deliver them, and the power infrastructure keeping them all running. Copper’s broad application across multiple end-uses has made it resilient and less-exposed to single point failures of demand.

Traditional demand in the developed world is expected to remain strong and as living standards rise globally, the demand for copper is expected to follow suit. Developing economies, which have nearly five times the population of high-income economies, will increasingly strive to achieve the same high standard of living. This transition will lead to a greater need for copper. 

Take China for example, despite its enormous appetite for copper over the past two decades, it still only has half of the copper accumulated stock-in-use per capita (e.g. buildings, machinery, vehicles) compared to a developed economy, at around 100 kilograms per capita. India, the other major economy with over one billion people, also has a compelling copper story. India’s electricity consumption per capita currently stands at around one-seventh of Japan’s and one-fifth of China’s, and we expect its copper demand to grow five-fold over its pre-Covid volumes in the coming decades as electricity is made more accessible.

This traditional demand provides a solid foundation, but it does not account for the rapid acceleration of growth expected in the decades to come. That will be driven by the ‘Energy Transition’ and ‘Digital’ trends.

Since the Industrial Revolution, the use of fossil fuels has helped the world unlock greater levels of productivity. As the world seeks to rein in the use of these fuels (and their related carbon emissions), it will need more electricity (mainly from renewable sources) to keep everything running. Most energy modellers agree that electrification will be a major enabler of the decarbonisation of transport, buildings and large parts of industry. Under our base case, we see electricity demand roughly doubling from today to 2050, as electricity’s share of total energy consumption also doubles to around 40% by 2050.2

‘Energy Transition’ copper demand refers to the additional copper required to achieve that level of electrification. As the most conductive industrial metal, copper is a key enabler of low GHG emissions energy sources, such as wind, solar, and hydro, as well as electric vehicles (EV) and batteries. An EV, for example, uses around three times more copper than typical internal combustion engines (ICE). As the energy transition unfolds, we anticipate the roll-out of EVs to lift the transport sector’s share of total copper demand from around 11% in 2021, to over 20% by 2040.3 Copper is also needed for energy efficiency and conservation measures, such as smart grids, LED lighting, and heat pumps. On top of this, the generation and transmission of low GHG emissions electricity is expected to require more copper than conventional fossil fuel power generation.4   

‘Digital’ demand refers to the growth from the expected ramp-up in demand for digital infrastructure, as the world creates and consumes massive amounts of data, enabled by copper-hungry data centres. Artificial Intelligence (AI)-enabled technology requires vast amounts of data and processing capability, which in turn needs larger and faster computers consuming more electricity. We expect global electricity consumption for data centres to rise from around 2% of global demand today, to 9% by 2050, with copper demand in data centres increasing six-fold by 2050.5  

Today, we estimate that the Traditional vs Energy Transition vs Digital split of global copper demand is around 92%/7%/1%. By 2050, we predict the split to have evolved to 71%/23%/6%.6 

Towards 2050

What is unique about the next 25 years is the way copper demand from electrification, decarbonisation and digitisation will cut across high, middle and lower-income economies alike. Unlike the 20th century, where the adoption of cars, electricity, consumer electronics and white goods occurred at different times across various regions, we expect to see more-or-less concurrent adoption of the copper-intensive technologies of EVs, renewables and data centres around the world.

There will be some balancing factors for this significant growth in copper demand, such as from substitution and thrifting, which have been a feature of the copper industry throughout its history.

  • Substitution refers to the replacement of copper by other materials, such as aluminium, plastics, or fibre optics, which can be cheaper, lighter, or more efficient for certain applications. (Or in some cases, the adoption of a different technology with a lower copper content.)
  • Thrifting refers to the reduction of copper content or usage in products or processes, while maintaining functionality, through design improvements and technological innovations.

When it comes to copper-to-aluminium substitution, many have long held to the ‘three to one’ rule of thumb: when the copper price is more than three times the price of aluminium, you will start to get increased levels of substitution. More recently, some estimates have adjusted this ratio higher, to around 3.5 times.

However, the copper-to-aluminium ratio7 has been in excess of 3.5 for much of the past five years, supporting our belief that the price ratio needs to be higher still, at around 3.5 to 4 times, before you see greater levels of substitution. 

It is not just about cost either. Substitution and thrifting require design alteration, product line modification and investment in new equipment, and worker retraining. And uptake relies on customers believing the product works as well or better than what they can access today. None of these things happen quickly, especially in the well-established ‘traditional’ end-uses. The sectors that are most exposed to substitution and thrifting are those driving demand in the Energy Transition segment. These new technologies are still undergoing evolution and development, and each iteration presents a new opportunity to reduce copper use – up to a certain limit.

We also believe copper has some unique advantages that make it difficult to substitute or thrift in many end-uses, such as its conductivity, durability, recyclability and antimicrobial properties. This is why it remains widely used, despite potentially cheaper options being available. Copper also has a smaller GHG emissions intensity8 footprint than aluminium, which may be a relevant factor when choosing materials in the future.

While we expect substitution and thrifting will rise from current levels, this should be a gradual process, as has been observed over the past century. 

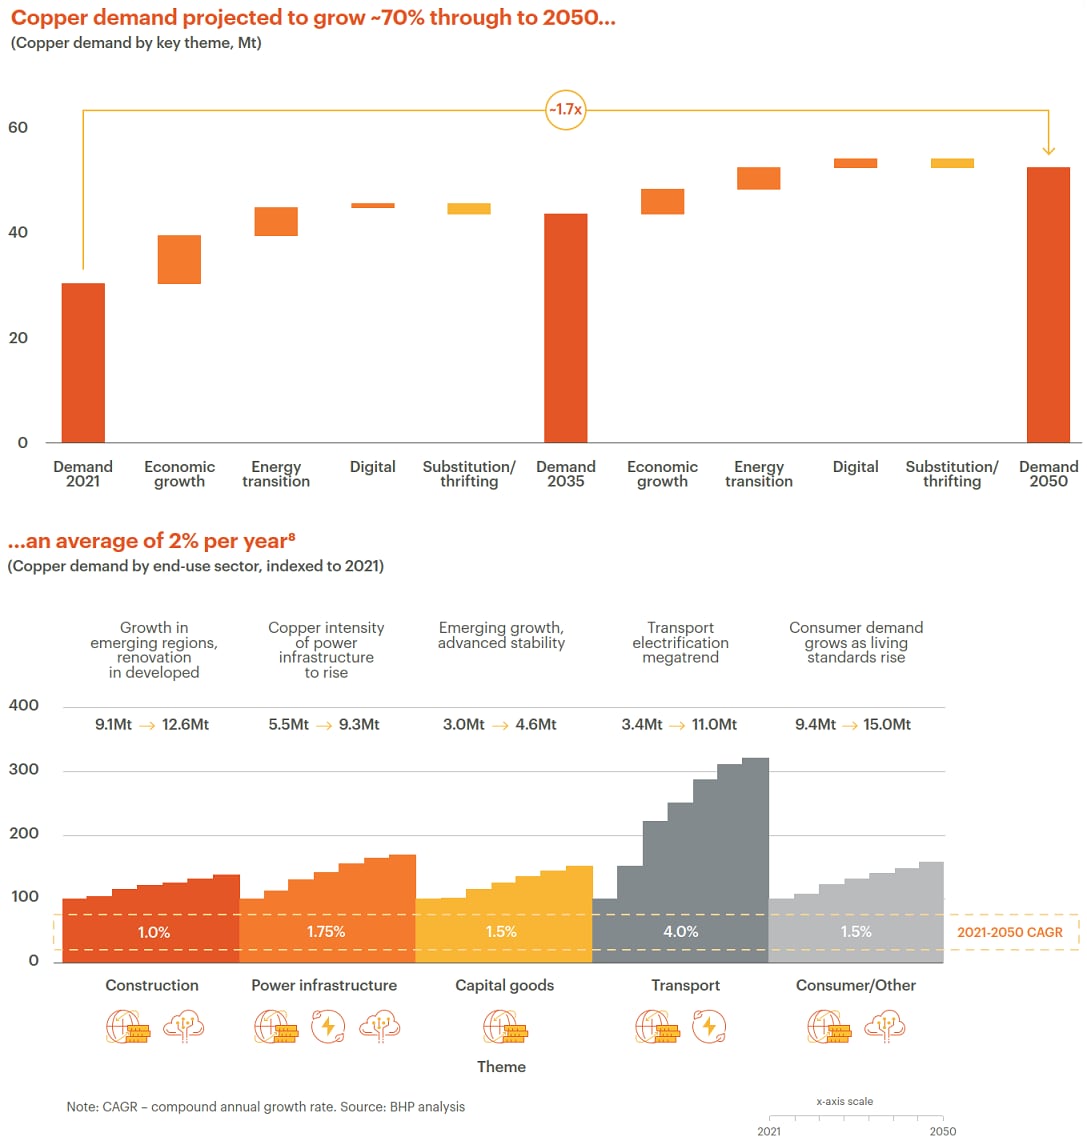
Putting all these levers together, we project global copper demand to grow by around 70% to over 50 Mt per annum by 2050 – an average growth rate of 2% per year.

Due to the concurrent adoption of new copper-intensive technologies, as well as support from the broad-based ‘traditional’ development across end-uses in emerging economies, we anticipate a re-acceleration of copper demand to 2035 of 2.6% CAGR, versus a 1.9% CAGR over the past 15 years. In absolute terms, this is roughly 1 Mt copper demand growth per year, every year, until 2035 ‒ double the 0.5 Mt annual growth volume of the past 15 years. 

Supply

As with demand, there are different drivers of copper supply. First and foremost, primary supply comes from mines and processing facilities such as those that BHP operates. 

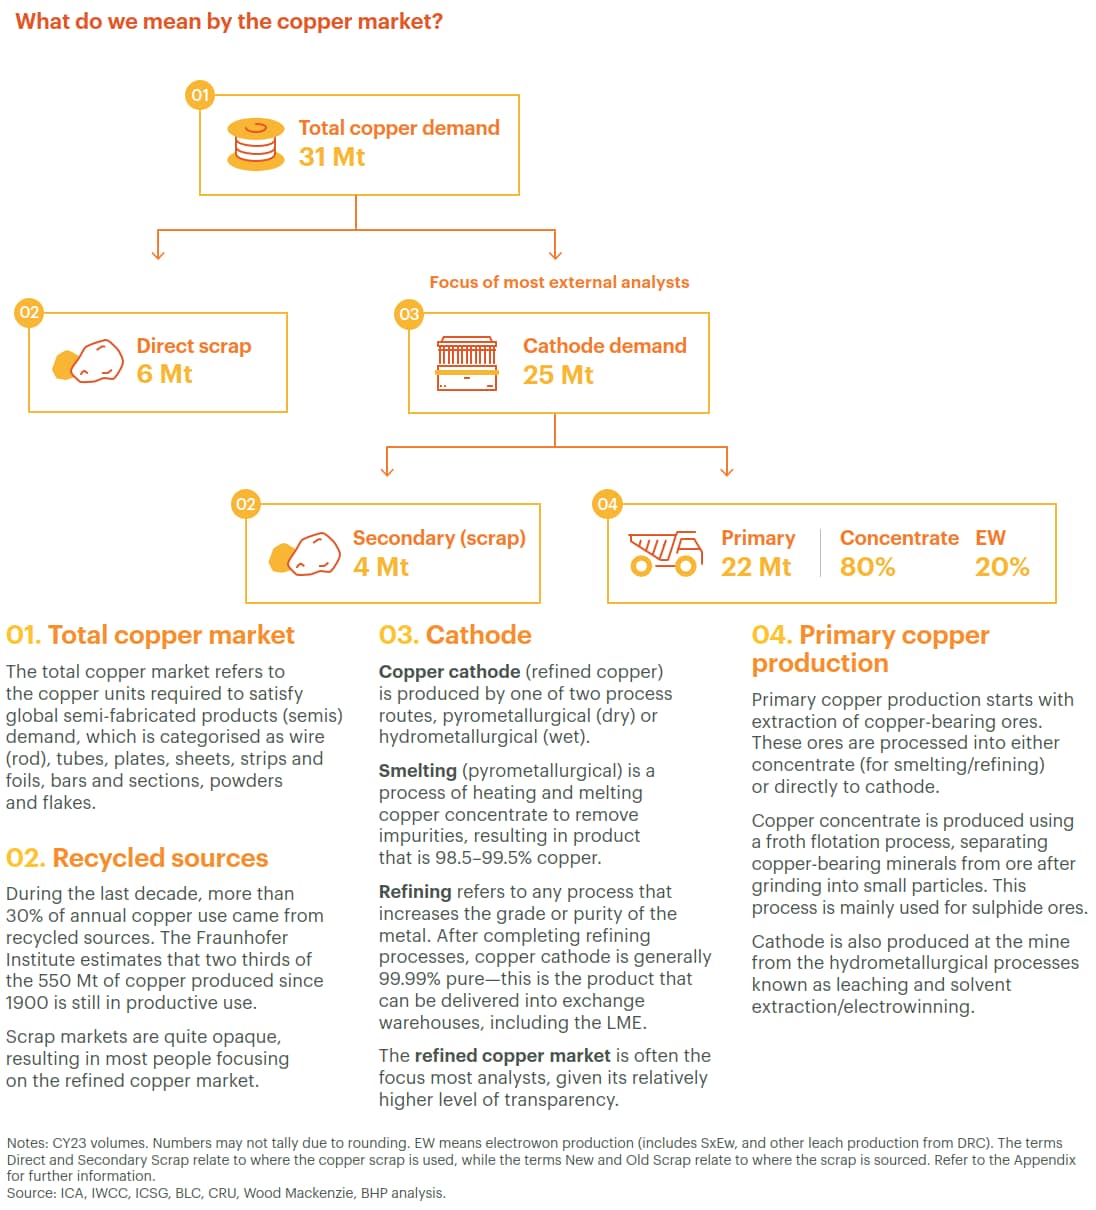
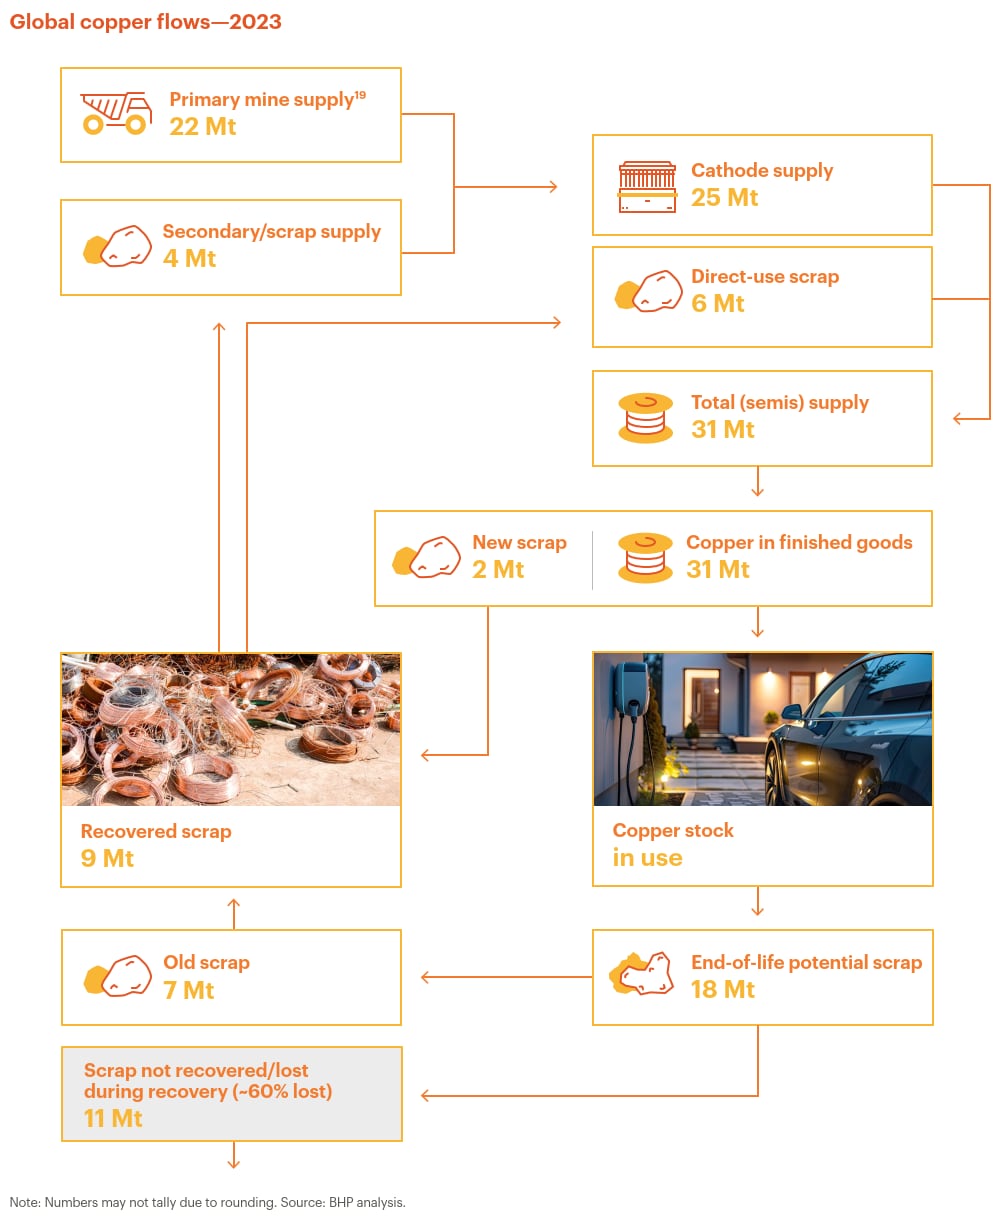
But secondary, or scrap, copper is also an important source of supply. Copper can be recycled from end-of-life products (‘old scrap’) or from waste generated in the manufacturing process (‘new scrap’), reducing the need for primary copper from mining.9 

Scrap and recycling


Recycled copper is expected to be an important source of supply to meet the large copper demand growth over the next 30 years. The main barrier to recycled copper supply is the availability of scrap. 

The pool of ‘old scrap’10 is principally determined by the average lifetime of an end-use product. These lifetimes can range from weeks or months for some consumer products (e.g. from batteries, headphones, charging cables) up to several decades (e.g. from construction and infrastructure). We assess the average life of copper in-use to be around 20 years.

Much of this ‘old scrap’ is also not recovered. We estimate that in 2021 only 43% of available ‘old scrap’ was collected and recovered for re-use, falling to 40% in 2023 as lower prices, slowing economic activity and regulatory changes acted as headwinds. Rising ‘scrap nationalism’ to preserve the local use of secondary material and restrictions in cross-regional waste trade have also acted as a drag on growth for global scrap collection and recovery11 (and may affect the availability of scrap in developing countries who have not yet built up their own substantial pool of copper in-use).

Nevertheless, we expect the increased focus on copper as a critical or strategic raw material will lift copper scrap collection and recovery rates from their current levels to 56% by 2035 and even higher longer term.12

With the growing scrap pool, we estimate that scrap supply will increase from around one third of global copper today to around 40% by 2035, and reach around a half of total copper consumption by 2050.

But even with this increasing use of copper scrap, we still expect more primary, or mined, copper will still be required when you add grade decline and mine depletions on top of this.

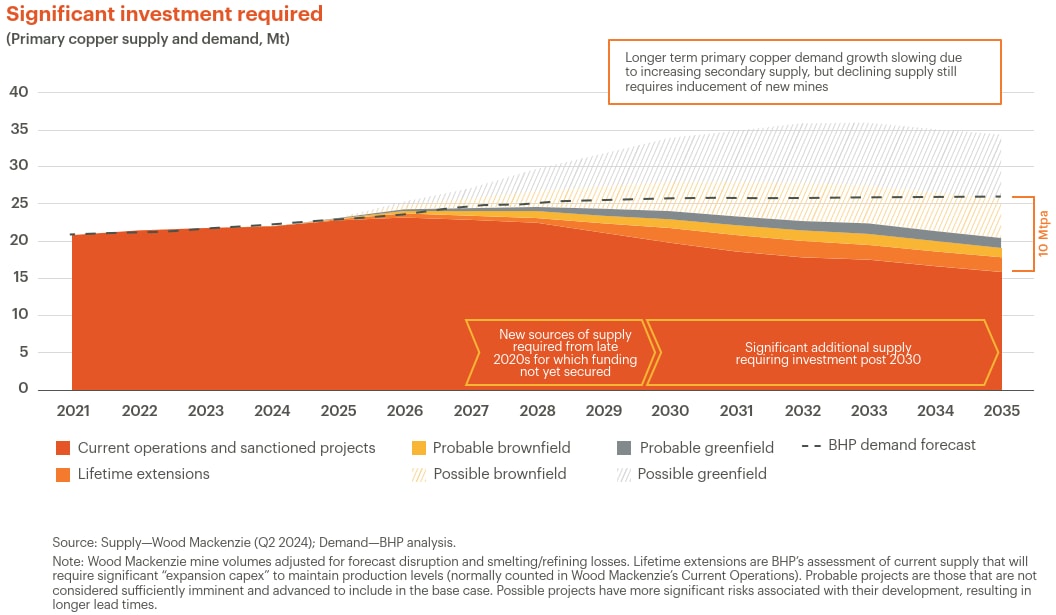
We estimate that the world will need about 10 Mtpa new mined copper supply13 in the next 10 years. 

Where will it come from?

Mine supply

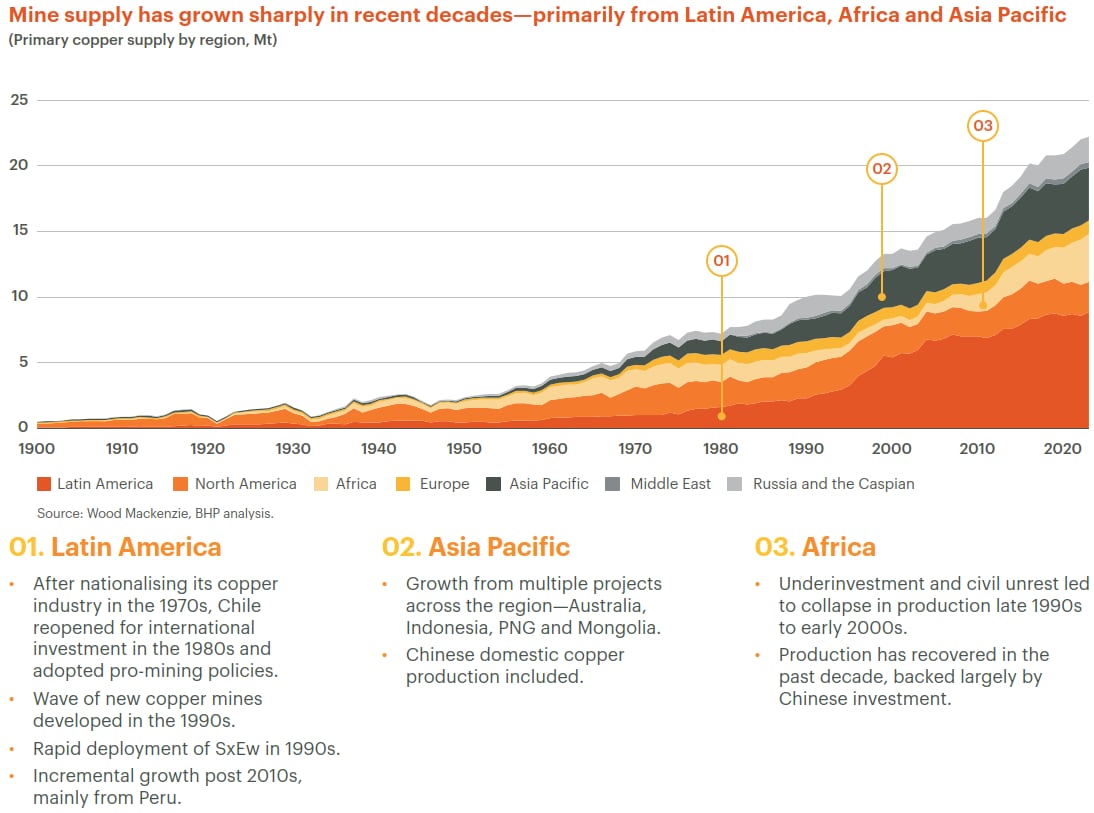
Copper reserves and production are concentrated in Latin America, Australia and Africa. The last 30 years has seen impressive supply growth globally, with production doubling to around 22 Mtpa today, primarily due to increases from Latin America (particularly Chile), the Asia Pacific region and Africa (over the last 10 years). This has been achieved through significant investment in greenfield projects and the wide-spread adoption of the leach-solvent extraction-electrowinning (SxEw) process from the mid-1980s, which unlocked previously uneconomic copper supply low grade oxide ores. This process now accounts for 20% of mine supply. 

The industry’s current challenge is to repeat this substantial volume growth in less than half the time.

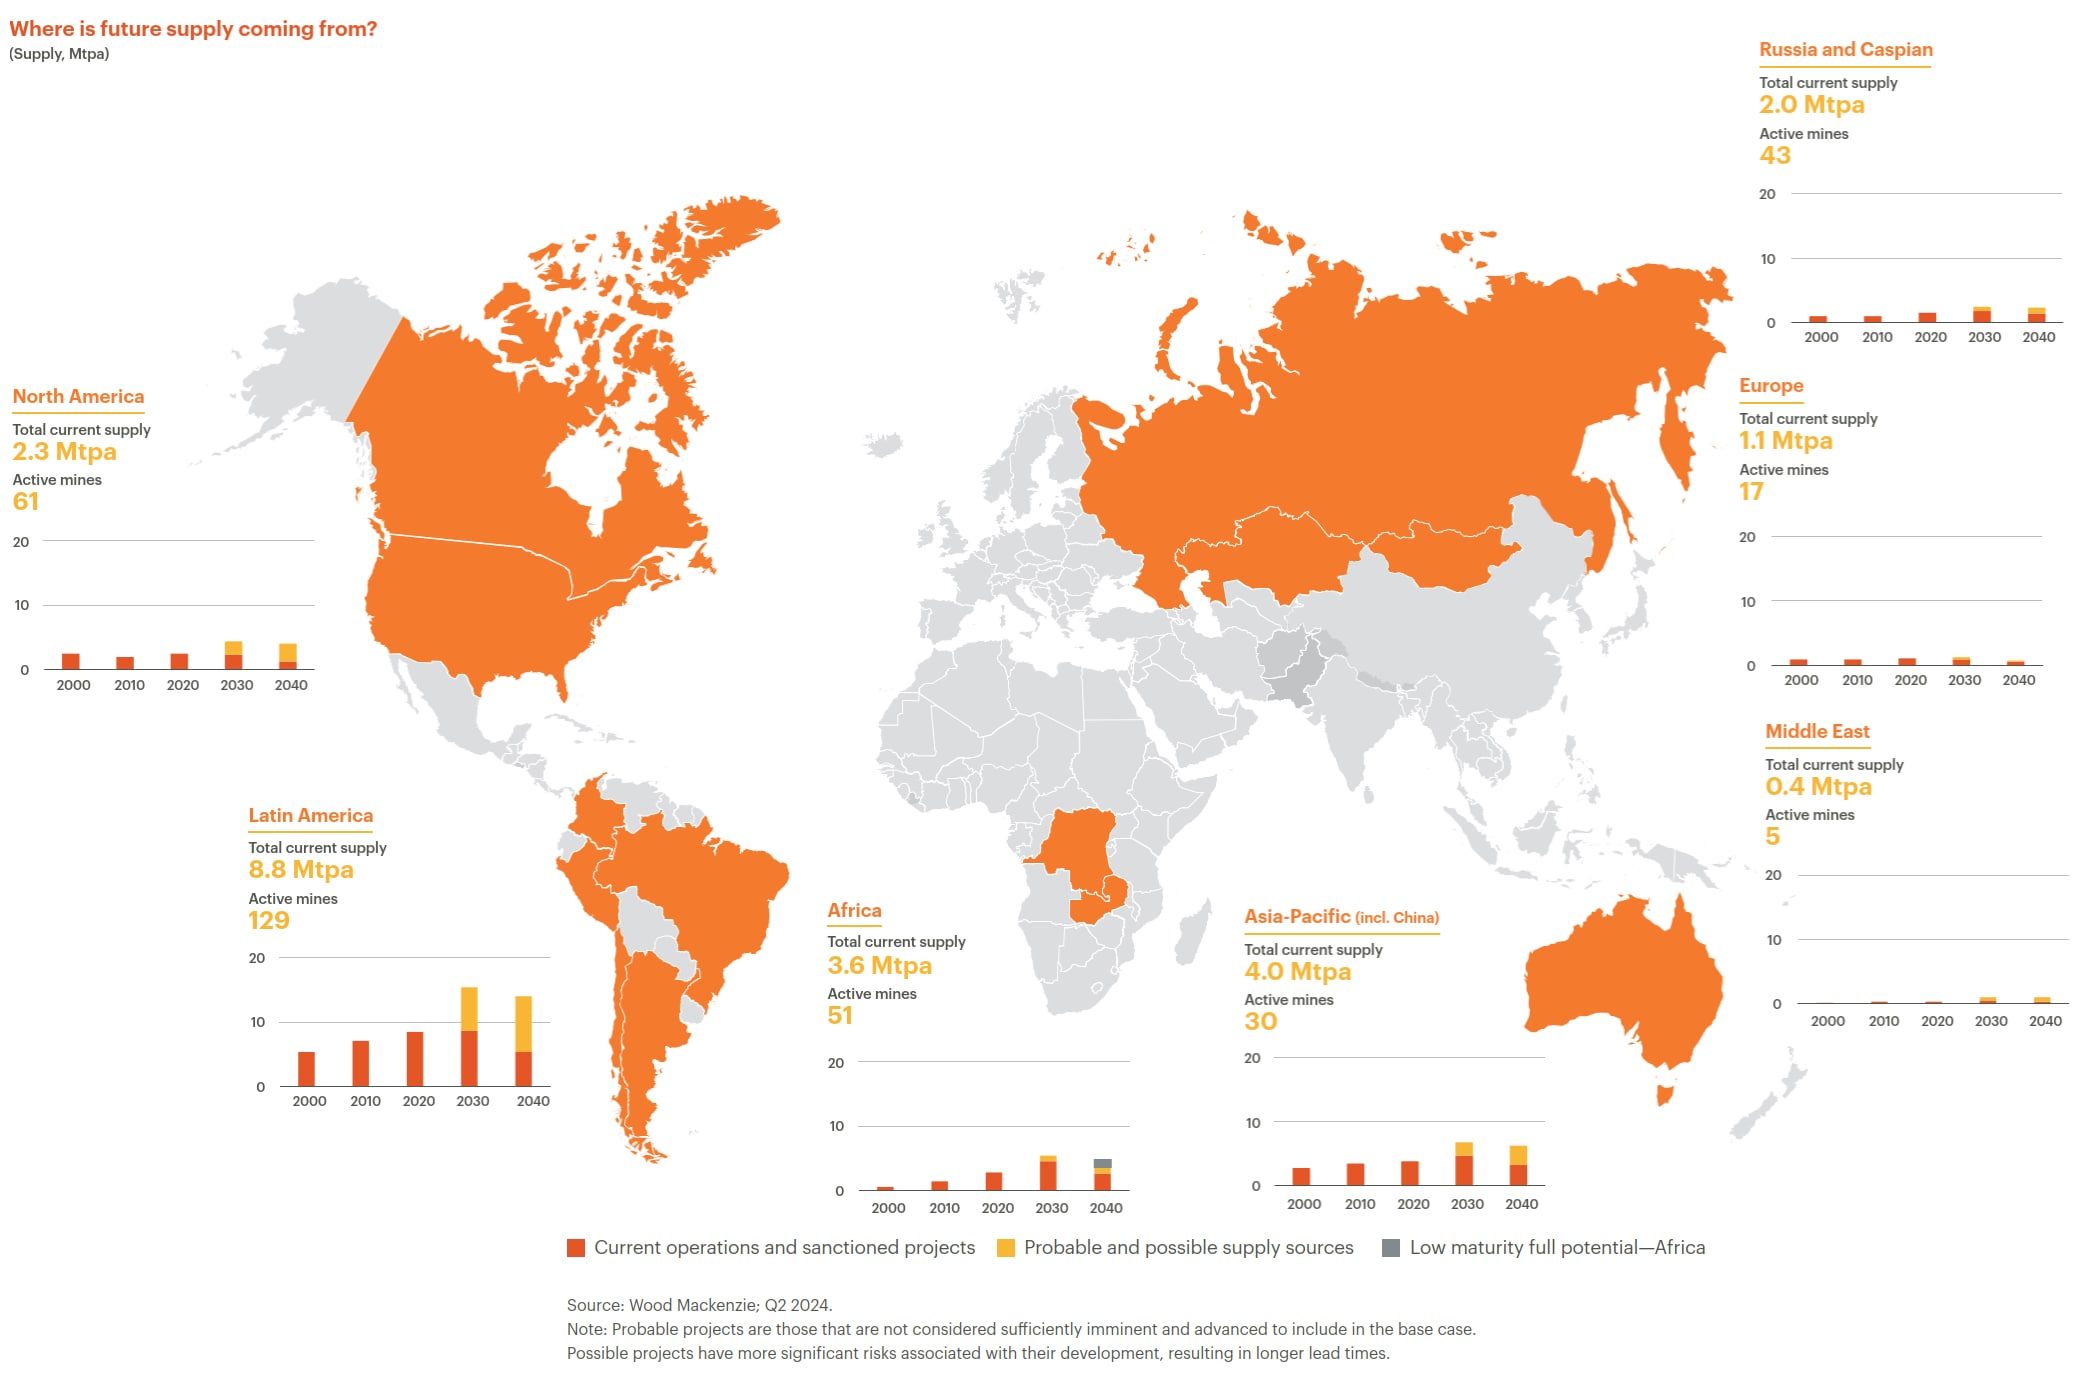
We expect supply growth over the next 10 years to be dominated by the same regions – Latin America Africa and Asia Pacific – with Africa having the highest growth rate (albeit off a much lower base than Latin America), and Latin America continuing to make the most significant contribution in absolute terms.

View the full size map here.

Against optimistic supply forecasts, which include the development of all probable copper projects, a significant gap to expected demand in 2035 is evident, even with our positive view on copper scrap supply. 

Current mine supply

Currently operating copper mines are expected to provide more than half of the copper required to meet future global demand over the next decade. Even so, we estimate existing mines to be producing around 15% less copper in 2035 than they do today.14  

These mines are already mature and are likely to need additional capital investment to replace or upgrade aging infrastructure or processing facilities. Alternatively, they may take advantage of new technologies that can improve their efficiency or recovery (e.g. converting oxide leaching plants to sulphide leaching, or recovering copper from waste). They are also likely to need to comply with new and higher standards when renewing or extending permits and licences to meet the evolving expectations of communities, customers and regulators. 

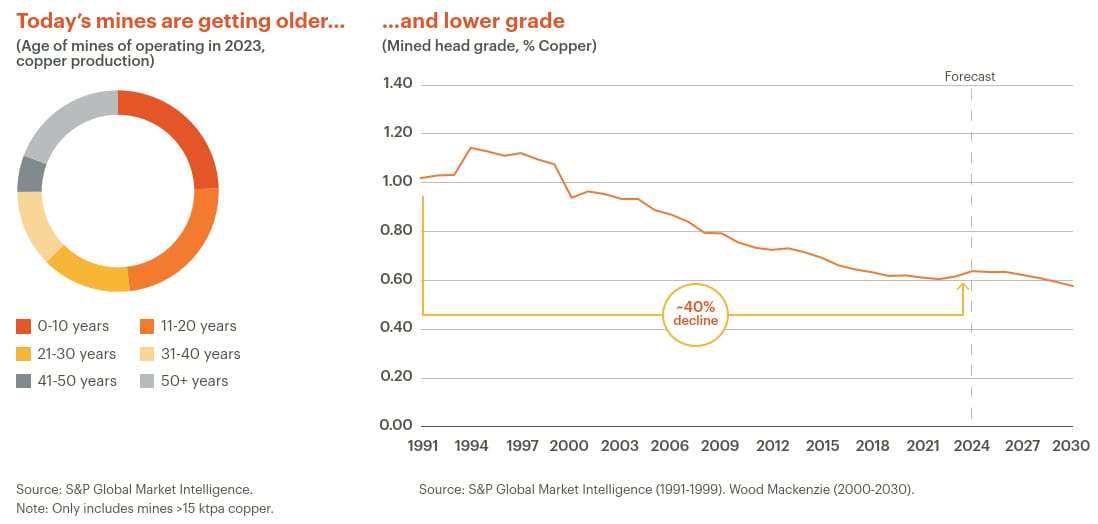
Existing copper mines also typically face declining grades, as higher grades are usually mined first, and lower grades are left for later. We estimate the average grade of copper mines has declined by around 40% since 1991. This is partly explained by processing advances, such as SxEw, which have improved the economics of lower-grade deposits and brought them into production. Declining grades also means that more ore needs to be mined, processed and transported to produce the same amount of copper. Without technological advancements, grade decline is likely to further increase production costs on a unit of output basis.

This trend may also increase potential environmental and social impacts, due to increased material movement if throughput is increased to maintain production levels.

We expect between one-third and one-half of global copper supply to face grade decline and ageing challenges over the next decade, which will drive increased unit costs and the requirement for capital reinvestment. While an incredible orebody can make a big difference, many older operations move up the cost curve as they progress through their life cycle. Given the strong demand signals, however, we expect the industry to vigorously pursue options to extend the life of these copper mines. 

One way of overcoming these challenges is with technology. We see examples of incremental productivity improvements from AI-enabled insights in processing, the repurposing or reinvigorating of older facilities with latent capacity, and adoption of new technologies to improve leaching. But it will be difficult to see the impact of these technologies becoming widespread until at least the mid-2030s. Research and development of innovative sulphide leaching technologies is continuing and we expect to see test work and pilot projects improve understanding of their potential. This will allow the industry to evaluate their true capital requirements, and address permitting uncertainty. But in our view, adoption of any primary sulphide leaching technologies into existing operations will need to complement existing processing infrastructure in most life extension and brownfield options, and the economic trade-offs remain unclear at an industry level. For it to be a truly disruptive technology longer term (post 2035), we would also need to see significant advances in scalability, but adoption efforts to date suggest that leaching processes will need to be tailored to individual ore bodies.

Brownfield projects

For current operations with significant resources remaining, brownfield developments will be an attractive response to the challenges outlined above. Based on our project-by-project global review, we expect new brownfield supply to contribute up to 30% of total copper supply by 2035. Today’s pipeline of brownfield projects is healthy, and we see many high-quality options, particularly in Chile.

Brownfield life extensions and expansions benefit from existing infrastructure, facilities, workforce and knowledge, and usually face lower technical risk and uncertainty. However, they are not immune to changing regulatory and community expectations and standards. This can lead to increasing capital intensities, permitting delays and complexities where existing permits do not cover the full life of the project. 

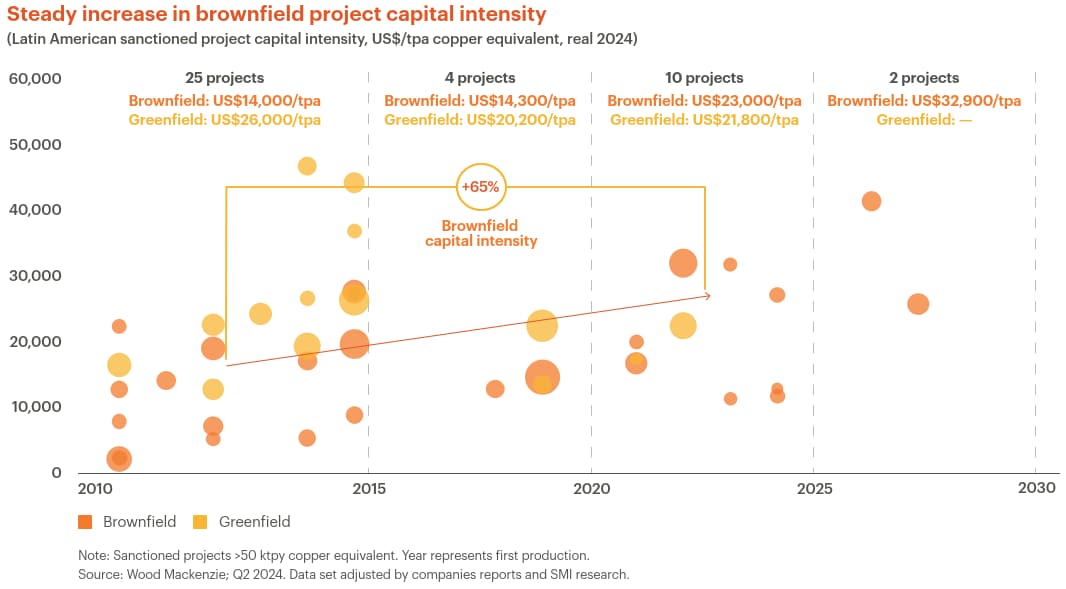
Our recent review of global project capital intensities shows a steady increase in brownfield capital intensity since 2010. When we look at the region with the strongest pipeline of brownfield projects – Latin America – average brownfield capital intensities for the projects sampled show a ~65% increase during that period (in 2024 real dollars), and since 2020, they have approached similar levels to greenfield projects.15 

Our view is that while this increase has been driven by a number of factors, including higher costs for and availability of inputs (e.g. material and labour cost increases, supply chain constraints, skilled labour shortages, and Covid-19 effects), a major factor is that copper producers are, in general, simply building ‘better’ mines (e.g. incorporating newer technologies and addressing higher standards for health, safety and environmental performance).

Despite these cost challenges, we expect high-quality brownfield projects to be prized in the industry in the face of growing copper demand. While their historic cost advantages over greenfield projects are less guaranteed today than in the past, the experience, technical capability developed through years of production and detailed ore body knowledge remain as major advantages, particularly when it comes to more complex projects.

Greenfield projects

Greenfield projects continue to attract significant excitement and interest from developers and investors. They can avoid the challenges of aging facilities and grade decline and can unlock large and higher-grade copper deposits, develop new frontiers, and allow for the application of technology advances without the challenge of retrofitting. 

But they also have potentially even greater challenges to brownfield developments, such as long lead times with environmental and social concerns needing to be navigated for the first time, and uncertainties associated with new jurisdictions or regions. And not all problems can be solved with money. For some projects, it is not a question of investability, but of executability.

The current pipeline of ‘all possible’ greenfield deposits are generally at the higher-difficulty end of the spectrum – and many are experiencing delays. When we investigated a selection of today’s 30 largest (by expected production volume) undeveloped greenfield projects, we found that analysts (ourselves included) had continually moved the forecast supply stack out in time. We expect these projects to contribute around 5 Mtpa of copper by 2035, or 14% of total possible supply.

Start dates for more than 20 of these projects have shown a consistent pattern of delay since 2014, and all have been delayed in forecasts made from 2020 onwards. In 2014, the majority of these projects were forecast to be in operation by now. Given this trend, we now apply a risking adjustment to these projects, which removes between 0.5 to 1 Mtpa from our copper production forecast from 2030 onwards. 

Those that have managed to eventually come online have still seen significant challenges on the journey. Copper mega projects (i.e. those with a capital cost more than US$5 billion) have experienced significant delays and cost overruns (e.g. QB2 and Oyu Tolgoi). 

African greenfield projects, backed largely by Chinese investment, have been the exception to this global trend, delivering a 90% increase in copper production over the last decade at highly competitive capital intensities and execution rates. African deposits also make up eight out of the 10 highest grade deposits discovered since 1990. But in contrast to the porphyry-style deposits common in Latin America, in which mineralisation decreases gradually, African deposits tend to be ‘sediment hosted’, meaning mineralisation is more concentrated with sharp boundaries. This difference drives a more pronounced depletion in our African forecast. However, given recent trends in both discovery and development, we have revised upward our forecasts of expected volumes from the African region, including volumes related to projects or deposits that might, in other regions, be considered immature or insufficiently progressed to include in the forecast.

Despite the potential contribution from African copper, on balance, new greenfield supply globally will struggle to enter the market quickly and cheaply. This is exacerbated by a slowing rate of discoveries and the relatively long average time from discovery to production (17 years in 2023), which is making it less likely that greenfield developments will be able to respond to the strong demand signals. 

According to S&P Global Market Intelligence’s most recent annual copper discovery report, there were:

…239 copper deposits discovered between 1990 and 2023… we have recorded only four discoveries from the past five years (2019–2023), totalling 4.2 Mt of copper… Discoveries from the past decade account for just 14 of the 239 deposits included in the analysis.16  

Capital availability

Capital availability is the other hurdle for copper developers. While challenging to model, given the project-specific nature, we estimate the total bill for all expansion capex from 2025-2034 to be around a quarter of a trillion US dollars (in 2024 real dollars). This represents a significant increase from the previous 10 years, where the total spend on copper projects was approximately US$150 billion. 

In the 1990s and 2000s we saw the impact of Japanese and western investments into copper around the globe, and we have seen significant Chinese investment into African copper projects in the past decade. Political support has often accompanied such investments (in various forms), and sovereign interest in copper from other regions is growing, most notably from the Middle East and with renewed interest from the United States. Given copper’s essential role in economic growth, the energy transition and digital transformation, we would expect sovereign interest and investment to continue to play a role in future copper projects.

Supply prospects are mixed

Taking all of these supply factors into account, we expect currently operating mines will need to work harder for longer, and both brownfield and greenfield projects will face cost and schedule headwinds, arising from skilled labour shortages, project complexity and higher ESG standards. Companies that can best navigate and adapt to these challenges, are experienced in managing more complex projects, and have solid social value credentials and a strong balance sheet will win.

Pricing

The copper price is driven by many factors, such as economic growth, investor sentiment, industrial activity, inventory levels, production costs, exchange rates, interest rates and geopolitical events. In the short term, the price is sensitive to changes in demand and supply, as well as to market sentiment and speculation, which can create price spikes or slumps.17 

However, in the long term, the copper price is more determined by the fundamental supply and demand trends and drivers of the market, such as those we have set out in this blog. To narrow in on potential long-term pricing ranges, we prefer the long-run marginal cost (LRMC)-based inducement model, which seeks to identify the marginal unit of supply that will meet demand in the future, and what it will cost. It assumes new supply will be induced by a price signal that provides a sufficient return for the project. It uses a queue of projects that are ranked by their competitiveness and brings them on until future demand is met. It is the most reliable and consistent method for projecting the trend price of copper over long time periods, based on the fundamentals of demand and supply.18 

The bullish drivers of demand (balanced by the forces of scrap, substitution and thrifting) present a huge task for copper miners. There is a shortage of ‘easy’ projects to replace existing supply and meet this growing copper demand. The projects that are available face new and increasing challenges that we believe will be reflected in their costs, and consequently, in the price required to incentivise their development. We think the price setting marginal tonne will come from either a lower-grade brownfield expansion in a mature jurisdiction, or a higher-grade greenfield in a higher risk and/or emerging jurisdiction. None of these sources of metal is likely to come cheaply, easily, or unfortunately— promptly. 

Appendix

The chart below summarises the flow of copper units from mine through end-of-life capital stock. 

Important notice

This article contains forward–looking statements, which involve risks and uncertainties. Forward-looking statements include all statements other than statements of historical or present facts, including: statements regarding: trends in commodity prices and currency exchange rates; demand for commodities; global market conditions; guidance; reserves and resources and production forecasts; expectations, plans, strategies and objectives of management; our expectations, commitments, targets, goals and objectives with respect to social value or sustainability; climate scenarios; approval of certain projects and consummation of certain transactions; closure, divestment, acquisition or integration of certain assets, operations or facilities (including associated costs or benefits); anticipated production or construction commencement dates; capital expenditure or costs and scheduling; operating costs, and supply of materials and skilled employees; anticipated productive lives of projects, mines and facilities; the availability, implementation and adoption of new technologies; provisions and contingent liabilities; and tax, legal and other regulatory developments.  

Forward–looking statements may be identified by the use of terminology, including, but not limited to, ‘intend’, ‘aim’, ‘ambition’, ‘aspiration’, ‘goal’, ‘target’, ‘prospect’, ‘project’, ‘plan’, ‘pathway’, ‘objective’, ‘see’, ‘anticipate’, ‘estimate’, ‘believe’, ‘expect’, ‘commit’, ‘ensure’, ‘may’, ‘should’, ‘intend’, ‘need’, ‘must’, ‘will’, ‘would’, ‘continue’, ‘forecast’, ‘guidance’, ‘outlook’, ‘trend’ or similar words.  

These statements discuss future expectations or performance, or provide other forward-looking information and are based on the information available as at the date of this article and/or the date of BHP’s scenario analysis processes. BHP cautions against reliance on any forward–looking statements or guidance. 
Additionally, forward–looking statements in this article do not represent guarantees or predictions of future financial or operational performance, and involve known and unknown risks, uncertainties, and other factors, many of which are beyond our control, and which may cause actual results to differ materially from those expressed in the statements contained in this article.  

There are inherent limitations with scenario analysis, and it is difficult to predict which, if any, of the scenarios might eventuate. Scenarios do not constitute definitive outcomes for us. Scenario analysis relies on assumptions that may or may not be, or prove to be, correct and may or may not eventuate, and scenarios may be impacted by additional factors to the assumptions disclosed.  

Except as required by applicable regulations or by law, BHP does not undertake to publicly update or review any forward–looking statements, whether as a result of new information or future events. Past performance cannot be relied on as a guide to future performance.

No offer of securities 

Nothing in this article should be construed as either an offer or a solicitation of an offer to buy or sell BHP securities, or a solicitation of any vote or approval, in any jurisdiction, or be treated or relied upon as a recommendation or advice by BHP. No offer of securities shall be made in the United States absent registration under the U.S. Securities Act of 1933, as amended, or pursuant to an exemption from, or in a transaction not subject to, such registration requirements.

Reliance on third party information 

The views expressed in this article contain information that has been derived from publicly available sources that have not been independently verified. No representation or warranty is made as to the accuracy, completeness, or reliability of the information. This article should not be relied upon as a recommendation or forecast by BHP.

BHP and its subsidiaries 

In this article, the terms ‘BHP’, the ‘Company’, the ‘Group’, ‘BHP Group’, ‘our business’, ‘organisation’, ‘we’, ‘us’ and ‘our’ refer to BHP Group Limited and, except where the context otherwise requires, our subsidiaries. Refer to the ‘Subsidiaries’ note to the Financial Statements in the BHP Annual Report for a list of our significant subsidiaries. Those terms do not include non–operated assets. 

Footnotes

1 Data and events referenced in this article are current as of September 2024.
2 Some aggressive decarbonisation scenarios come in 10 to 15 percentage points higher in terms of end-use electrification than we are assuming in the base case. For a full list of deep decarbonisation scenarios that we track, see
BHP’s Climate Transition Action Plan 2024 Additional information (page 62). 
3 Forecast developed prior to the recent slowdown in EV adoption (ex-China). While the pace of adoption of EVs may underwhelm in the short term, the rationale for electrified transport remains compelling in the long run.
4 Offshore wind requires around 11 tonnes of copper per megawatt, or over 5 times as much as gas-fired power which uses around 2 tonnes per megawatt. Onshore wind and solar are also more copper-intensive, at around 1.7 and 1.4 times, respectively. In addition, the capacity factors of wind and solar power are generally lower than fossil power, which means you need to install more renewable power capacity to generate the same amount of electricity.
5 We estimate copper use in data centres (including those used for cryptocurrency and AI) to be around half a million tonnes of copper today, rising to around three million tonnes in 2050.
6 Note that Copper in power grids is counted under Traditional in the above splits. 
7 Ratio of monthly average of LME Cash Settlement Price for Copper and Aluminium.
8 Global average CO2 footprint (CRU, 2021). Copper: ~4t CO2/t metal. Aluminium: ~13t CO2/t metal.
9 For more detail on the volumes of flows in the copper value chain, see the appendix

10 Please see the appendix for details of the copper cycle.
11 Examples of policies that, while potentially positive in the long run, we believe have hindered/are hindering scrap use in the short term: China’s Operation National Sword and recent review of tax and rebates (‘Fair Competition Review’), EU’s Regulation on Waste Shipments and Critical Raw Materials Act.
12 This assumption is underpinned by EV battery recycling targets, but also requires broader improvement in collection/recovery rates across end uses. This will necessitate changes in consumer behaviour (many consumer goods end up in landfill), as well as improvements in scrap processing and metal recovery. Recycling in many cases is labour and/or opex intensive. Current recycling rates are arguably a reflection of what is economic at current prices, so ‘carrot and stick’ policies will likely be required to alter behaviour and lift these rates.
13 The 10 Mtpa requirement considers: growth in primary copper demand, as well as reductions in current mine supply due to grade decline and resource depletion, and additional consideration for supply disruptions and metallurgical losses. The figure also includes mine life extensions for some currently operating mines.
14 This assumes mine life extensions and probable brownfield projects. 
15 Wood Mackenzie; Q2 2024. Data set adjusted by companies reports and BHP analysis, inclusive of sanctioned projects >50 ktpa copper equivalent. 
16 https://www.spglobal.com/marketintelligence/en/news-insights/research/new-major-copper-discoveries-sparse-amid-shift-away-from-early-stage-exploration 
17 Refer to our 2024 Economic and Commodity Outlook for more details.
18 We recognise that LRMC has some limitations, such as being less helpful for the short and medium term, as it does not capture the cyclical and structural factors that can affect the price. This method is also sensitive to the exogenous assumptions that are imposed, such as the macroeconomic and financial variables, the return thresholds for projects, and the discrete decisions on project inducement. We also recognise that this method does not account for the possibility of price disconnecting from the cost curve, due to extreme tightness or scarcity in the market. Therefore, we also use other methods and models, such as cost-plus, historical average, substitution, probabilistic, and econometric, to complement and cross-check our price forecasts, and to generate alternative price scenarios and ranges to reflect the uncertainty and variability of the market.


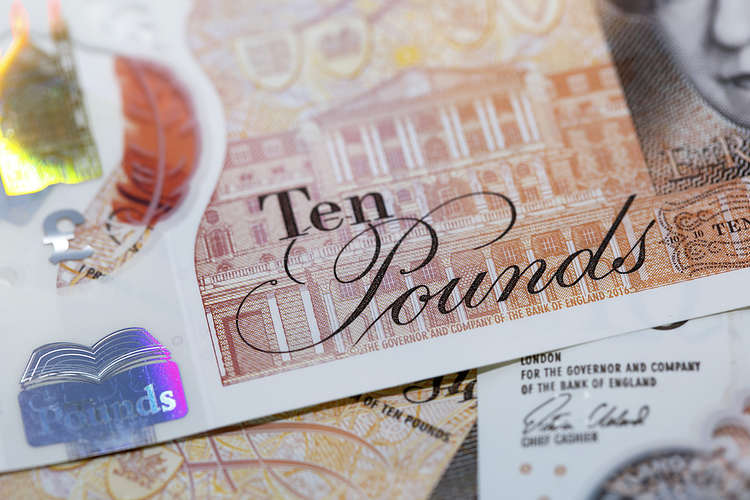
Source link

Go to Top