Ethereum Price Prediction: ETH Price Holds Crucial $3,050 Support as Momentum Builds Toward the $3,400–$3,500 Range
Ethereum’s price movements in early December show a constructive rebound following a corrective phase in November. After retesting a descending trendline and reclaiming the short-term EMA cluster, ETH has stabilized near the $3,050 support zone. Maintaining this level could influence the next resistance tests around $3,400–$3,500. However, analysts caution that these scenarios are not guaranteed and depend on market participation and liquidity conditions.
Ethereum Price Today: Navigating a Corrective Phase
ETH/USD has been in a corrective downtrend on the daily chart, with recent price action approaching a supply zone between $3,500 and $3,700. Supply zones represent areas where selling pressure historically outweighs buying, often causing price consolidation or pullbacks. The primary support below remains in the $2,400–$2,550 range, which was significant during Ethereum’s prior rally.
ETH/USD shows short-term bullish momentum toward $3.3k–$3.4k, but a drop below $2.95k could revisit $2.8k lows. Source: CyrilXBT via X
According to cryptocurrency analyst CyrilXBT, if ETH holds above the $3.0k–$3.05k zone during pullbacks, the price could push toward the $3.3k–$3.4k range. This perspective highlights the importance of the $3,050 level as a pivot for short-term bullish momentum. Nonetheless, failure to defend this support could lead to a retest of lower demand zones.
Short-Term Ethereum Technical Analysis: EMAs and Trendlines
On the 4-hour chart, ETH has reclaimed the EMA ribbon—a cluster of exponential moving averages that helps traders gauge short-term momentum. A successful EMA reclaim often signals that buyers are regaining control, while failure to hold can indicate potential weakness. A breakout from the prior trading range, accompanied by elevated volume, suggests possible continuation, but analysts note the rally remains corrective rather than impulsive.

ETH holds short-term support near $2,964–$2,957 but faces key resistance at the 100- and 200-day EMAs ($3,013–$3,206). Source: TradingView
Market commentator Jainam Mehta, “The chart shows cleaner higher-low formations on both the 4-hour and daily charts.” Higher-low patterns are significant because they indicate that buyers are entering on dips, providing incremental support for potential upward movement. ETH currently trades above the 20-day and 50-day EMAs near $2,964 and $2,957, which may act as near-term support.
Ethereum Price Outlook: Key Levels to Monitor
Critical resistance levels are located at the 100-day and 200-day EMAs, around $3,013 and $3,206, respectively. Historically, these EMAs have served as supply zones during prior rallies. A sustained move above these thresholds could open the way for targets near $3,360 and $3,477, with a larger pivot around $3,566.
On the downside, failure to hold $3,050 or rejection at the 200-day EMA could lead to a deeper pullback. Immediate downside targets include the psychological $2,900 level and the 50-day EMA at $2,957. Further declines could extend toward $2,800–$2,720, particularly if high leverage accelerates selling pressure.
Analysts emphasize that these levels provide structural reference points but warn that short-term volatility may create false signals, such as EMA whipsaws or liquidity sweeps.
Ethereum 2025 Price Prediction: Balancing Fundamentals and Risks
The Fusaka upgrade, activated on December 3, improves Layer 2 settlements and lowers node costs, offering some fundamental support. According to on-chain data provider Glassnode, Ethereum has recovered approximately 45% from November lows. Spot market inflows also indicate renewed interest, with ETH registering $58.10 million in net inflows on December 3—the largest in over a month.
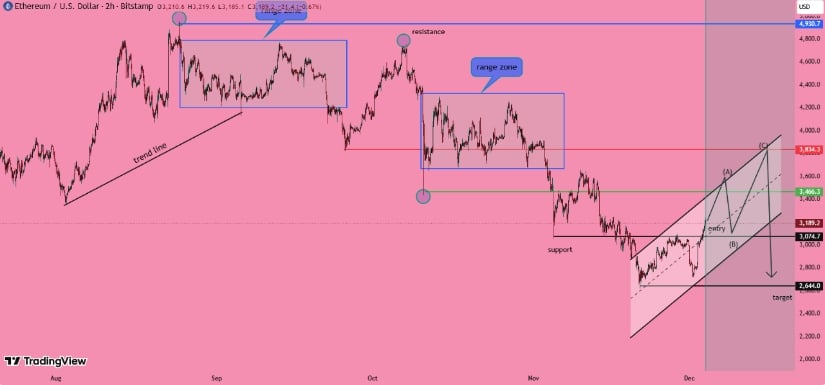
ETH/USD is retracing within a rising channel; holding $3,074 and breaking $3,466 could extend a short-term rally toward $3,834, while rejection risks a drop to $2,644. Source: Elise-Golden-Spar on TradingView
Derivatives data show rising open interest totaling $38.34 billion, suggesting that institutional and high-volume traders are positioning for potential volatility. However, these metrics carry dual interpretations: while they indicate accumulation, they may also imply an elevated risk of liquidation if the price reverses suddenly.
Long-term Ethereum price predictions for 2025 remain uncertain. Market participants should consider potential macroeconomic factors, the pace of Ethereum network upgrades, and competition from other smart contract platforms. Even with technical and fundamental support, outcomes can diverge significantly based on adoption trends, regulatory developments, and broader crypto market sentiment.
Ethereum Price Target and Risk Considerations
Short-term scenarios suggest that ETH could approach $3,400–$3,500 if support around $3,050 holds. Key resistance at $3,500–$3,700 will determine whether the rally extends. Traders should also monitor volume confirmation, EMA behavior, and market positioning.
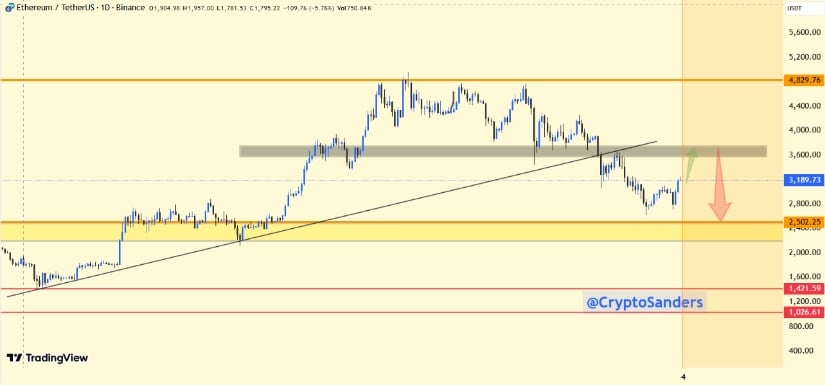
ETH/USD bounces toward $3,500–$3,700 resistance, with support at $2,400–$2,550; a break higher targets $4,400–$4,800, while rejection risks $1,400–$1,000. Source: CryptoSanders9563 on TradingView
Conversely, failure to clear resistance or a breakdown below $3,050 could trigger a sharper correction. Risk management is crucial in this environment, as algorithmic trading and leverage could magnify price swings. Analysts recommend tracking both structural signals (EMA clusters, support/resistance zones, higher-lows) and short-term noise (liquidity sweeps, sudden inflow spikes) to distinguish reliable trends.
Looking Ahead: Ethereum Outlook
Ethereum currently shows tentative signs of stabilization, with short-term support holding near $3,050 and technical indicators improving. Both bullish and bearish outcomes are possible, and the outcome will depend on the interplay among market participation, resistance levels, and macro factors.

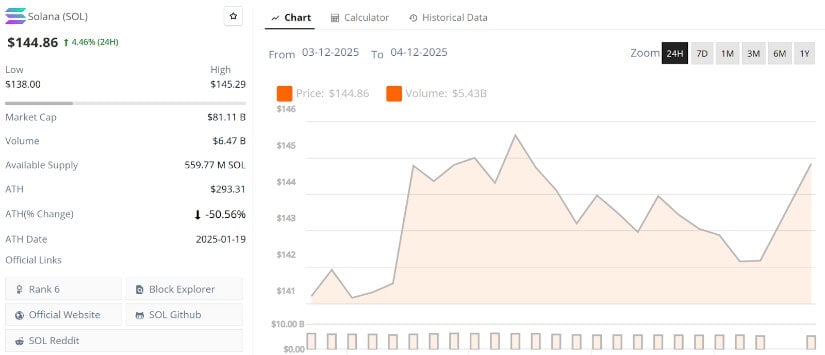
Ethereum was trading at around 3,191.64, up 4.43% in the last 24 hours at press time. Source: Ethereum price via Brave New Coin
Investors and traders are advised to watch for sustained closes above key EMAs, monitor supply zones, and assess liquidity trends. While early accumulation is evident, the broader market trend remains cautious, underscoring the need for disciplined risk management and vigilance against potential volatility.