About Editorial team of BIPNs

Main team of content of bipns.com. Any type of content should be approved by us.
16 07, 2026

GBP/JPY Forecast 15/07: Stalls Near 218 (Chart)

By |2026-07-16T00:43:33+03:00July 16, 2026|Forex News, News|0 Comments

The British pound has gone back and forth during trading on Tuesday as we continue to see a lot of noise in the Japanese yen-denominated pairs.

GBP/JPY

The British pound has gone back and forth during trading on Tuesday as we continue to see a lot of noise in the Japanese yen-denominated pairs. Quite frankly, that’s not a huge surprise considering all of the problems that the Bank of Japan finds itself dealing with. The most obvious one is the fact that inflation is starting to drop a bit in Japan.

Furthermore, you also have the situation where the weakening Japanese yen has forced the Bank of Japan to intervene in the yen-related pairs, but the market will continue to see a lot of pressure to the upside because, quite frankly, there’s no point in trying to short a pair that is going to cost you at the end of every day.

Carry Trade Dynamics and Key Technical Levels

The 215 yen level is an area that I think is the floor with the 50-day EMA underneath, offering a bit of support as well. To the upside, we have the 218 yen level, an area that has shown itself to be resistance. And if we can break above there, then it’s likely that we go much higher, perhaps to the 220 yen level.

Keep in mind that you get paid at the end of every day to hold this pair. The carry trade is something that a lot of people will be watching closely, not just here, but in other places. The British pound continues to have a lot of strength to it in general, as the Bank of England is a bit more hawkish than many others, and most certainly than the Japanese central bank. I prefer to buy dips, and I do think eventually we probably go higher over the longer-term.

Begin trading our daily forecasts and analysis. Here is a list of Forex brokers in Japan to work with.

Christopher Lewis is a technical analyst and market commentator at DailyForex with more than two decades of trading experience in Forex and other leveraged markets. Based in Columbus, Ohio, he specializes in chart-based analysis of major currency pairs, stock indices, commodities, and energy markets, focusing on clear support and resistance levels, trend structure, and risk management. Christopher produces daily written and video analysis for traders who rely on technical setups to navigate volatile market conditions

As seen on: Pairs Of Aces Podcast,The Trader Guy, FXEmpire

Source link

16 07, 2026

WTI Crude Oil Price Forecast: Oil Near $80 as US-Iran Tensions Offset OPEC+ Supply Increase

By |2026-07-16T00:38:10+03:00July 16, 2026|Forex News, News|0 Comments


WTI crude oil trades near $80 as US-Iran tensions fuel supply concerns. See today’s oil price forecast, key support and resistance levels…


Register now to be able to add articles to your reading list.

” aria-hidden=”true”>

Quick overview

  • WTI crude oil is trading near $80 due to escalating US-Iran tensions and concerns over supply disruptions in the Strait of Hormuz.
  • OPEC+ production increases and declining global demand are creating a ceiling on WTI prices despite decreasing inventories.
  • Key resistance and support levels to watch are $80.33 and $78.35, respectively, as market momentum shifts.
  • Drawdowns in global crude inventories continue to support prices, indicating ongoing demand despite rising production.

WTI crude oil trades near $80 as US-Iran tensions fuel supply concerns. See today’s oil price forecast, key support and resistance levels, and what’s driving WTI prices.

Crude oil from West Texas Intermediate reached prices of US$79.75. US-Iran relations destabilizing put pressure on crude oil supply from the Middle East. This unstable situation increased geopolitical risk, pushing West Texas Intermediate oil to its $80 per barrel.

Along with the geopolitical risk, OPEX+ producing oil stockpiles and global demand for oil receding helped keep pressure on prices. This leads the market to guess West Texas Intermediate oil prices and if they will break the $80 threshold.

Why are Oil Prices Rising Today?

The primary reason for the price increase has been the destabilization of the Middle East and the US and Iran military action. This directly affects the Strait of Hormuz and oil tankers and shipments. The Strait of Hormuz is a vital trade route as it carries 20% of the global oil exports.

Due to Middle East shipping disruptions, Asian oil refiners have had to look for alternative oil supplies and increased US oil exports, increasing global energy spot prices. Global supply has decreased making crude oil costs increase. The Gulf shipping situation is more of a Brent crude concern, easing WTI crude prices.

The price of oil has increased globally, but OPEC+ has decreased oil production costs. Therefore, the cost of oil has increased globally while OPEC+ gradually restores their oil stockpiles. On the flip side, both OPEC and the International Energy Agency see demand for oil decreasing, which could push today’s oil prices to a surplus.

Inventory drawdowns continue to support crude

Oil fundamentals are supported by drawdowns in inventories despite rising production.

Global onshore crude inventories continued to decrease in June. Drawdowns in OECD stockpiles and Chinese inventories were recorded. In the United States, commercial crude inventories decreased during the last reporting week. Gasoline inventories also decreased due to refiners working to fulfill peak summer demand.

These drawdowns indicate the market continues to need stored crude to fulfill demand and offset supply disruptions. This leaves prices vulnerable to further supply disruptions in the Middle East.

WTI Crude Oil Price Forecast

WTI is testing key Fibonacci resistance levels after a major rebound from $67.00.

WTI Crude Oil Price Forecast: Oil Near  as US-Iran Tensions Offset OPEC+ Supply Increase

Short-term momentum is improving as prices have reclaimed the 50-period EMA. The RSI is holding near 68, indicating bullish momentum but also the potential for an overbought market.

A sustained break above $80.33 would target the $83.37 resistance, and then the $87.36 resistance would likely come into play.

The potential for profit taking would be triggered by a failure to hold above $78.35. Stronger support is located near $73.26.

Key Takeaways

  • Rapidly escalating tensions in the U.S. and Iran combined with concerns of supply disruptions in the Strait of Hormuz continue to place upward pressure on WTI.

  • Near demand constraints from the OPEC+ production increases and declining global demand continue to place a ceiling on WTI prices.

  • Decreasing global inventories and crude demand from refiners are placing near term support on crude prices.

  • $80.33 resistance and $78.35 support levels should be closely monitored for the next move in WTI.

Arslan Butt

Lead Markets Analyst – Multi-Asset (FX, Commodities, Crypto)

Arslan Butt serves as the Lead Commodities and Indices Analyst, bringing a wealth of expertise to the field. With an MBA in Behavioral Finance and active progress towards a Ph.D., Arslan possesses a deep understanding of market dynamics.

His professional journey includes a significant role as a senior analyst at a leading brokerage firm, complementing his extensive experience as a market analyst and day trader. Adept in educating others, Arslan has a commendable track record as an instructor and public speaker.

His incisive analyses, particularly within the realms of cryptocurrency and forex markets, are showcased across esteemed financial publications such as ForexCrunch, InsideBitcoins, and EconomyWatch, solidifying his reputation in the financial community.


Source link

15 07, 2026

Pound-to-Dollar Forecast: Weaker US Inflation Cuts Fed Rate Hike Bets

By |2026-07-15T20:43:03+03:00July 15, 2026|Forex News, News|0 Comments


– Written by

The Pound to Dollar exchange rate (GBP/USD) climbed back above 1.3400 after softer-than-expected US inflation data prompted investors to scale back expectations of further Federal Reserve rate hikes.

Although geopolitical tensions in the Middle East continue to underpin the Dollar, the benign inflation report triggered a sharp fall in US Treasury yields and allowed Sterling to recover from earlier losses.

GBP/USD Forecasts: Back Above 1.34

The Pound to Dollar (GBP/USD) exchange rate again found support just below 1.3350 in Asian trading on Tuesday and rallied to 1.3430 after lower than expected US data with a dollar reversal as markets focussed primarily on global developments.

UoB commented on the GBP/USD outlook; “downward momentum has not increased significantly. Based on the prevailing momentum, a clear break below 1.3320 appears unlikely.”

According to Scotiabank; “We note the cluster of resistance levels between current spot and 1.3500 but anticipate an extension of the recovery to 1.36.”

Middle East events and the outlook for US interest rates are likely to dominate in the near term. The near-term impacts have pulled the dollar in opposite directions.

Save on Your GBP/USD Transfer

Get better rates and lower fees on your next international money transfer.
Compare TorFX with top UK banks in seconds and see how much you could save.


Compare the Best GBP/USD Rates »

There have been further attacks on Iran by the US military while Iran has attacked ships in the Strait of Hormuz. In response, energy prices have moved higher again while risk conditions remain more fragile.

MUFG commented; “Tit-for-tat military strikes between the US and Iran have continued adding to concerns over the risk of more sustained disruption for energy supplies through the Strait of Hormuz.”

ING commented; “Short-term momentum is swinging back in favour of the dollar as the FX market is finally starting to take the Gulf re-escalation more seriously. Still, both oil (Brent is at $84/bl this morning) and the USD are showing reluctance to fully price back in another supply shock. That’s despite the US reimposing a blockade in the Strait of Hormuz and oil inventories at worryingly low levels.”

Overnight, the US 10-year yield jumped to above 4.60%, not far below 18-month highs recorded in May.

There was, however, a notable reversal after the US data with a retreat to near 4.55% for the 10-year bond and lower yields pushed the dollar lower.

US consumer prices declined 0.4% for June with the year-on-year inflation rate dipping to 3.5% from 4.2% and well below consensus forecasts of 3.8%.

Core prices were unchanged on the month with the annual rate retreating to 2.6% from 2.9% and below expectations of 2.8%.

The dollar dipped after the data with less confidence that the Federal Reserve would hike rates twice before year-end. Markets also cut the probability of a July rate hike to below 20% from 40% the previous day.

According to ING; “Our call for the remainder of the year remains USD negative, primarily resting on another de-escalation and dovish Fed view. But risks, especially in the near-term, are clearly shifting to the bullish side for the greenback.”

Like this piece? Please share with your friends and colleagues:


International Money Transfer? Ask our resident FX expert a money transfer question or try John’s new, free, no-obligation personal service! ,where he helps every step of the way,
ensuring you get the best exchange rates on your currency requirements.

TAGS: Pound Dollar Forecasts

Source link

15 07, 2026

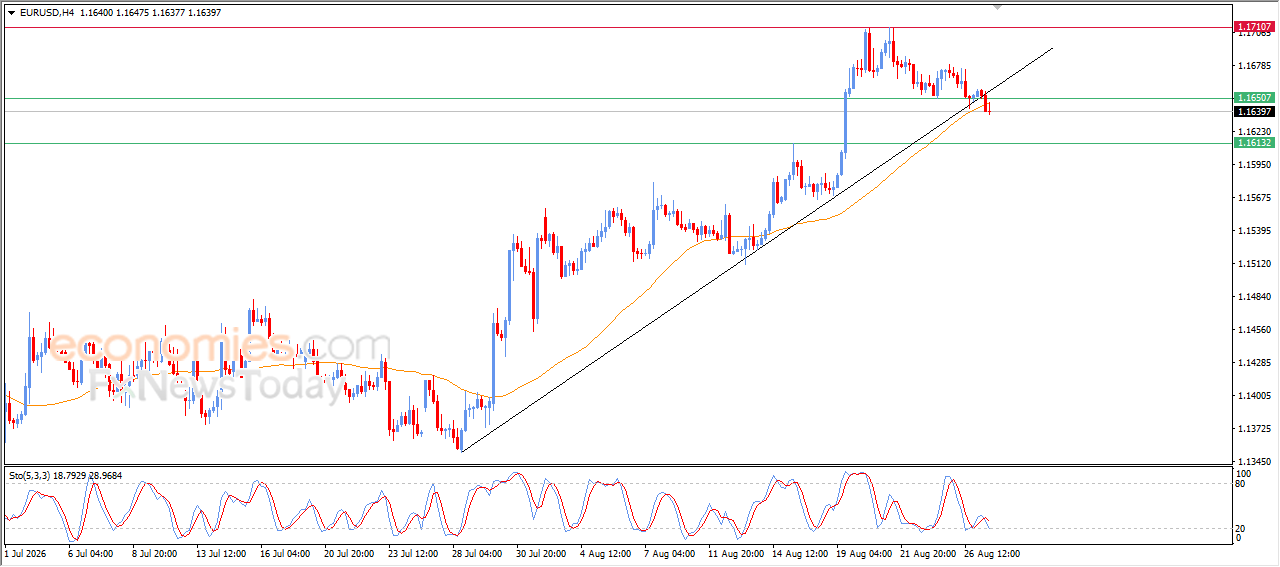
Forecast update for EURUSD -15-07-2026

By |2026-07-15T20:37:06+03:00July 15, 2026|Forex News, News|0 Comments


no change on the Natural gas price trend despite its recent sideways trading by its stability near $2.900, due to stability below $3.350 resistance, besides the continuation of providing negative momentum by the main indicators, specifically by stochastic move below level 50.


All that makes us keep the bearish scenario, to expect reaching $2.820 level soon, and surpassing it will let the price reach $2.620 support to monitor its behavior and detect the suggested targets in the upcoming trading.


The expected trading range for today is between $2.820 and $3.050


Trend forecast: Bearish


Source link

15 07, 2026

USD/JPY Price Forecast: Reflects volatility contraction amid triangle formation

By |2026-07-15T16:42:15+03:00July 15, 2026|Forex News, News|0 Comments

The USD/JPY pair trades slightly lower at around 162.20 during the European trading session on Wednesday. The pair edges down as the US Dollar (USD) underperforms due to easing fears of interest rate hikes by the Federal Reserve (Fed) this year.

US Dollar Price Today

The table below shows the percentage change of US Dollar (USD) against listed major currencies today. US Dollar was the weakest against the Euro.

USD EUR GBP JPY CAD AUD NZD CHF
USD -0.18% -0.13% -0.05% -0.04% -0.17% -0.11% -0.05%
EUR 0.18% -0.01% 0.13% 0.15% -0.03% 0.00% 0.13%
GBP 0.13% 0.00% 0.11% 0.13% -0.04% 0.02% 0.13%
JPY 0.05% -0.13% -0.11% 0.00% -0.14% -0.08% -0.01%
CAD 0.04% -0.15% -0.13% -0.01% -0.14% -0.14% -0.01%
AUD 0.17% 0.03% 0.04% 0.14% 0.14% 0.03% 0.11%
NZD 0.11% -0.01% -0.02% 0.08% 0.14% -0.03% 0.11%
CHF 0.05% -0.13% -0.13% 0.01% 0.01% -0.11% -0.11%

The heat map shows percentage changes of major currencies against each other. The base currency is picked from the left column, while the quote currency is picked from the top row. For example, if you pick the US Dollar from the left column and move along the horizontal line to the Japanese Yen, the percentage change displayed in the box will represent USD (base)/JPY (quote).

At press time, the US Dollar Index (DXY), which gauges the Greenback’s value against six major currencies, trades 0.16% lower to near 100.78.

The US Dollar faces selling pressure as traders have trimmed hawkish Fed bets following the release of the soft United States (US) Consumer Price Index (CPI) report for June. The report showed that the headline and core inflation decelerated to 3.5% and 2.6% Year-on-Year (YoY), respectively.

Meanwhile, Fed Chairman Kevin Warsh reiterated in his testimony on Tuesday that price stability is non-negotiable. “The Fed has no tolerance for persistently elevated inflation.” If we get policy right – and we will- the inflation surge of the last five years will be a thing of the past,” Warsh said.

On the Tokyo front, investors seek fresh cues regarding whether the Bank of Japan (BoJ) will raise interest rates again this year.

USD/JPY technical analysis

USD/JPY trades lower at around 162.20, sticking to the 20-period exponential moving average (EMA) at 162.10, which indicates a sideways trend. The formation of an Ascending Triangle chart pattern also reflects a sharp volatility contraction.

The Relative Strength Index (RSI) at 51.51 is neutral-to-positive, hinting that buying pressure is steady but not overstretched.

On the topside, immediate resistance is defined by the descending trend line around 162.79, where a clear break would open the way for a stronger bullish extension. On the downside, initial support is seen at the rising trend-line break near 161.79; a downside move below the same would expose the pair to the July 3 low near 160.50.

(The technical analysis of this story was written with the help of an AI tool. Know more.)

US Dollar FAQs

The US Dollar (USD) is the official currency of the United States of America, and the ‘de facto’ currency of a significant number of other countries where it is found in circulation alongside local notes. It is the most heavily traded currency in the world, accounting for over 88% of all global foreign exchange turnover, or an average of $6.6 trillion in transactions per day, according to data from 2022.
Following the second world war, the USD took over from the British Pound as the world’s reserve currency. For most of its history, the US Dollar was backed by Gold, until the Bretton Woods Agreement in 1971 when the Gold Standard went away.

The most important single factor impacting on the value of the US Dollar is monetary policy, which is shaped by the Federal Reserve (Fed). The Fed has two mandates: to achieve price stability (control inflation) and foster full employment. Its primary tool to achieve these two goals is by adjusting interest rates.
When prices are rising too quickly and inflation is above the Fed’s 2% target, the Fed will raise rates, which helps the USD value. When inflation falls below 2% or the Unemployment Rate is too high, the Fed may lower interest rates, which weighs on the Greenback.

In extreme situations, the Federal Reserve can also print more Dollars and enact quantitative easing (QE). QE is the process by which the Fed substantially increases the flow of credit in a stuck financial system.
It is a non-standard policy measure used when credit has dried up because banks will not lend to each other (out of the fear of counterparty default). It is a last resort when simply lowering interest rates is unlikely to achieve the necessary result. It was the Fed’s weapon of choice to combat the credit crunch that occurred during the Great Financial Crisis in 2008. It involves the Fed printing more Dollars and using them to buy US government bonds predominantly from financial institutions. QE usually leads to a weaker US Dollar.

Quantitative tightening (QT) is the reverse process whereby the Federal Reserve stops buying bonds from financial institutions and does not reinvest the principal from the bonds it holds maturing in new purchases. It is usually positive for the US Dollar.

Source link

15 07, 2026

Copper price hovers near the barrier– Forecast today – 15-7-2026

By |2026-07-15T16:36:06+03:00July 15, 2026|Forex News, News|0 Comments


Copper price ended yesterday’s trading by forming bullish waves, to settle near the initial barrier at $6.3000 level, affected by the positivity of the main indicators, specifically by stochastic reach to 80 level as appears in the above image.


The suggested scenario depends on the upcoming four hours’ close, the stability below the barrier will reinforce the chances of forming bearish corrective trading, to target $6.1200 reaching $5.9500, while breaching the barrier and holding above it will provide a chance for recording some extra gains by its rally towards $6.4800.


The expected trading range for today is between $6.1200 and $6.3800


Trend forecast: Bearish


Source link

15 07, 2026

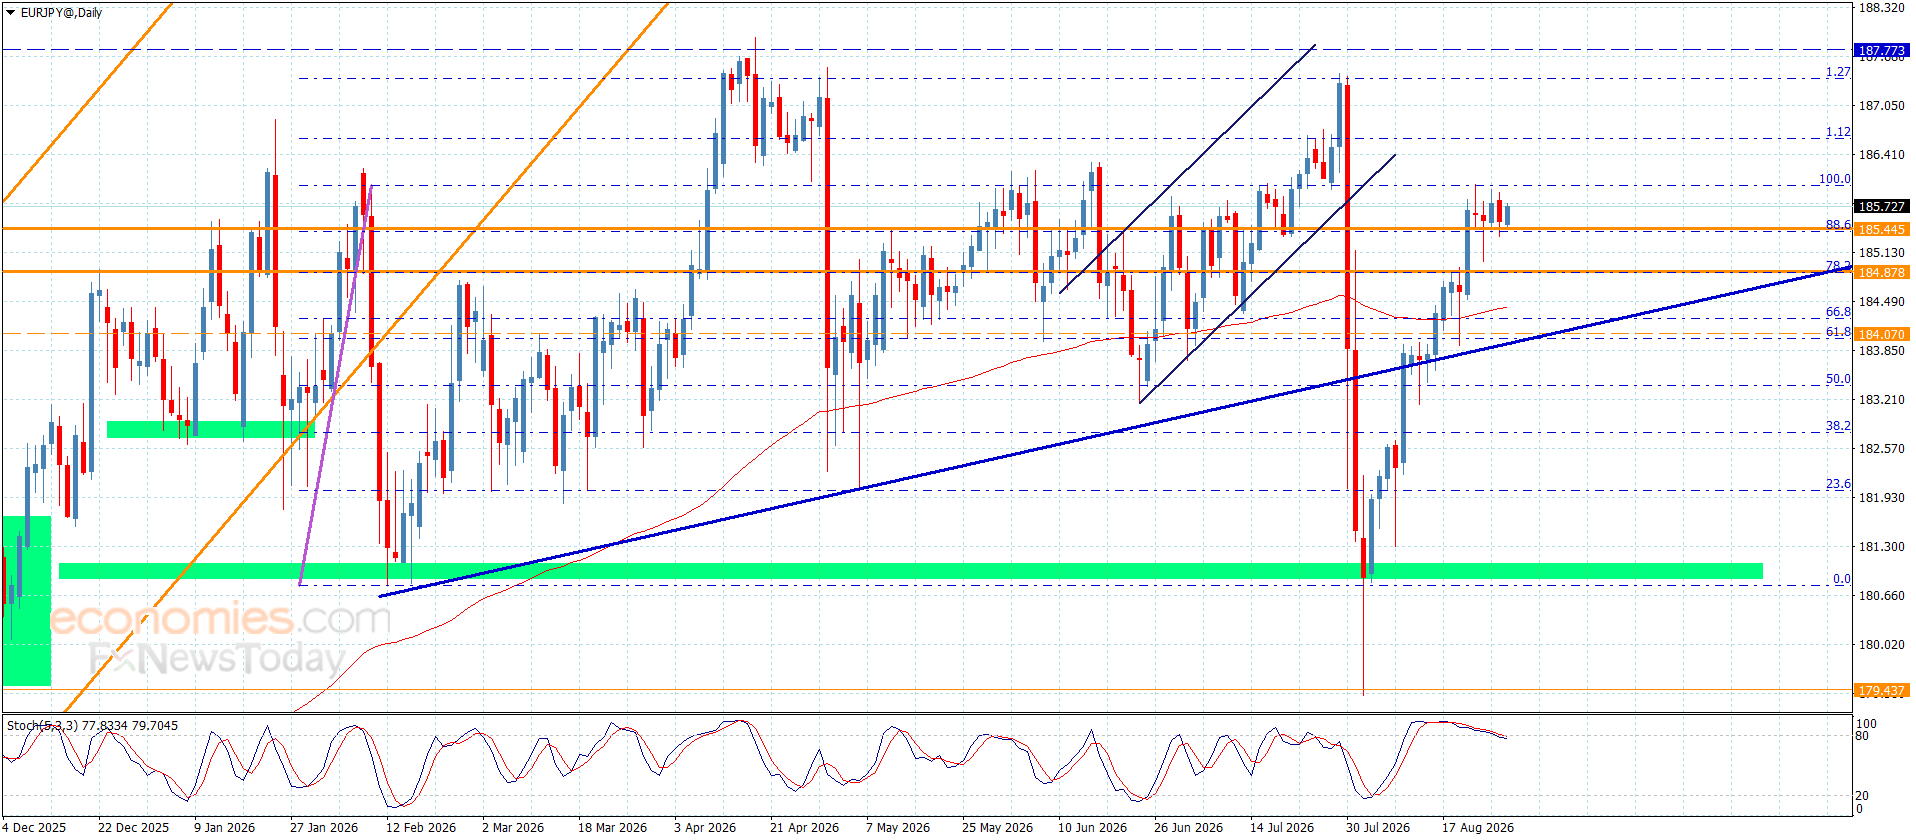
The EURJPY attempts to activate the bullish trend– Forecast today – 15-7-2026

By |2026-07-15T12:41:08+03:00July 15, 2026|Forex News, News|0 Comments

Copper price ended yesterday’s trading by forming bullish waves, to settle near the initial barrier at $6.3000 level, affected by the positivity of the main indicators, specifically by stochastic reach to 80 level as appears in the above image.


The suggested scenario depends on the upcoming four hours’ close, the stability below the barrier will reinforce the chances of forming bearish corrective trading, to target $6.1200 reaching $5.9500, while breaching the barrier and holding above it will provide a chance for recording some extra gains by its rally towards $6.4800.


The expected trading range for today is between $6.1200 and $6.3800


Trend forecast: Bearish


Source link

15 07, 2026

Platinum price is waiting negative momentum– Forecast today – 15-7-2026

By |2026-07-15T12:35:09+03:00July 15, 2026|Forex News, News|0 Comments


Copper price ended yesterday’s trading by forming bullish waves, to settle near the initial barrier at $6.3000 level, affected by the positivity of the main indicators, specifically by stochastic reach to 80 level as appears in the above image.


The suggested scenario depends on the upcoming four hours’ close, the stability below the barrier will reinforce the chances of forming bearish corrective trading, to target $6.1200 reaching $5.9500, while breaching the barrier and holding above it will provide a chance for recording some extra gains by its rally towards $6.4800.


The expected trading range for today is between $6.1200 and $6.3800


Trend forecast: Bearish


Source link

15 07, 2026

U.S. Dollar Retreats As Inflation Rate Drops To 3.5%: Analysis For EUR/USD, GBP/USD, USD/CAD, USD/JPY

By |2026-07-15T08:40:10+03:00July 15, 2026|Forex News, News|0 Comments

GBP/USD 140726 4h Chart

GBP/USD gained ground, supported by U.S. CPI report. Traders bet that Fed will be less hawkish as inflation has started to calm down. Traders also focus on comments from Fed Chair Warsh. He said that CPI decline did not mean that Fed accomplished its mission.

In case GBP/USD pulls back below the 50 MA at 1.3376, it will head towards the nearest support level at 1.3335 – 1.3350. A successful test of of this level will open the way to the test of the next support at 1.3250 – 1.3265.

On the upside, GBP/USD needs to settle above the resistance at 1.3450 – 1.3465 to have a chance to gain additional upside momentum in the near term.

Source link

15 07, 2026

GBP/JPY Price Forecast: Buyers defend 216.50 as bullish trend continues

By |2026-07-15T04:39:06+03:00July 15, 2026|Forex News, News|0 Comments

GBP/JPY trades in a narrow range on Tuesday as market sentiment remains fragile amid escalating tensions between the US and Iran, which are driving Oil prices higher once again. At the time of writing, the cross trades around 217.10 as the Japanese Yen (JPY) remains broadly weak.

Higher Oil prices are weighing on the Yen as Japan relies heavily on imported energy. At the same time, the inflationary impact of rising energy costs is reinforcing expectations that major central banks, including the Bank of England (BoE), may need to raise interest rates.

The BoJ remains on a tightening path but continues to lag behind its global peers, with wide interest rate gaps giving the British Pound (GBP) an advantage over the Yen and keeping GBP/JPY tilted to the upside.

Still, traders remain cautious about chasing GBP/JPY higher amid the growing risk of intervention by Japanese authorities as USD/JPY hovers near 40-year highs above 160.

Technical analysis: 4-hour chart

On the four-hour chart, GBP/JPY is retesting immediate resistance at the Bollinger Bands’ middle band near 217.09 while holding comfortably above the lower band at 216.41.

Momentum is moderating from recent overbought extremes, with the Relative Strength Index (RSI) near 54, while the Moving Average Convergence Divergence (MACD) indicator stays slightly negative, hinting at a slower but still constructive upside phase rather than a strongly impulsive rally.

On the upside, a clear break above the Bollinger Bands’ middle band would expose the upper band at 217.77. On the downside, initial support lies at the lower band at 216.41. A deeper pullback could expose the horizontal support levels at 215.50, 214.50, 213.50 and 212.50.

Technical analysis: Daily chart

On the daily chart, GBP/JPY maintains a bullish structure, forming a series of higher highs and higher lows. The cross trades above the Bollinger Bands’ middle band at 215.19 and holds above the nearby horizontal support at 216.50, keeping the broader upside bias intact.

The Relative Strength Index (RSI) stands at 61, reflecting firm positive momentum without entering overbought territory, while the Moving Average Convergence Divergence (MACD) remains positive, suggesting that buyers retain control.

On the upside, immediate resistance is seen at the upper Bollinger Band near 218.43, where gains could face some resistance. On the downside, initial support lies at 216.50, followed by the middle Bollinger Band at 215.19. A break below these levels could expose the lower Bollinger Band at 211.94, ahead of the horizontal support at 210.

(The technical analysis of this story was written with the help of an AI tool. Know more.)

Japanese Yen Price Today

The table below shows the percentage change of Japanese Yen (JPY) against listed major currencies today. Japanese Yen was the strongest against the US Dollar.

USD EUR GBP JPY CAD AUD NZD CHF
USD -0.21% -0.28% -0.16% -0.34% -0.36% -0.88% -0.40%
EUR 0.21% -0.07% 0.06% -0.13% -0.15% -0.66% -0.18%
GBP 0.28% 0.07% 0.13% -0.05% -0.06% -0.59% -0.12%
JPY 0.16% -0.06% -0.13% -0.18% -0.22% -0.74% -0.27%
CAD 0.34% 0.13% 0.05% 0.18% -0.04% -0.54% -0.07%
AUD 0.36% 0.15% 0.06% 0.22% 0.04% -0.52% -0.04%
NZD 0.88% 0.66% 0.59% 0.74% 0.54% 0.52% 0.48%
CHF 0.40% 0.18% 0.12% 0.27% 0.07% 0.04% -0.48%

The heat map shows percentage changes of major currencies against each other. The base currency is picked from the left column, while the quote currency is picked from the top row. For example, if you pick the Japanese Yen from the left column and move along the horizontal line to the US Dollar, the percentage change displayed in the box will represent JPY (base)/USD (quote).

Source link

Go to Top