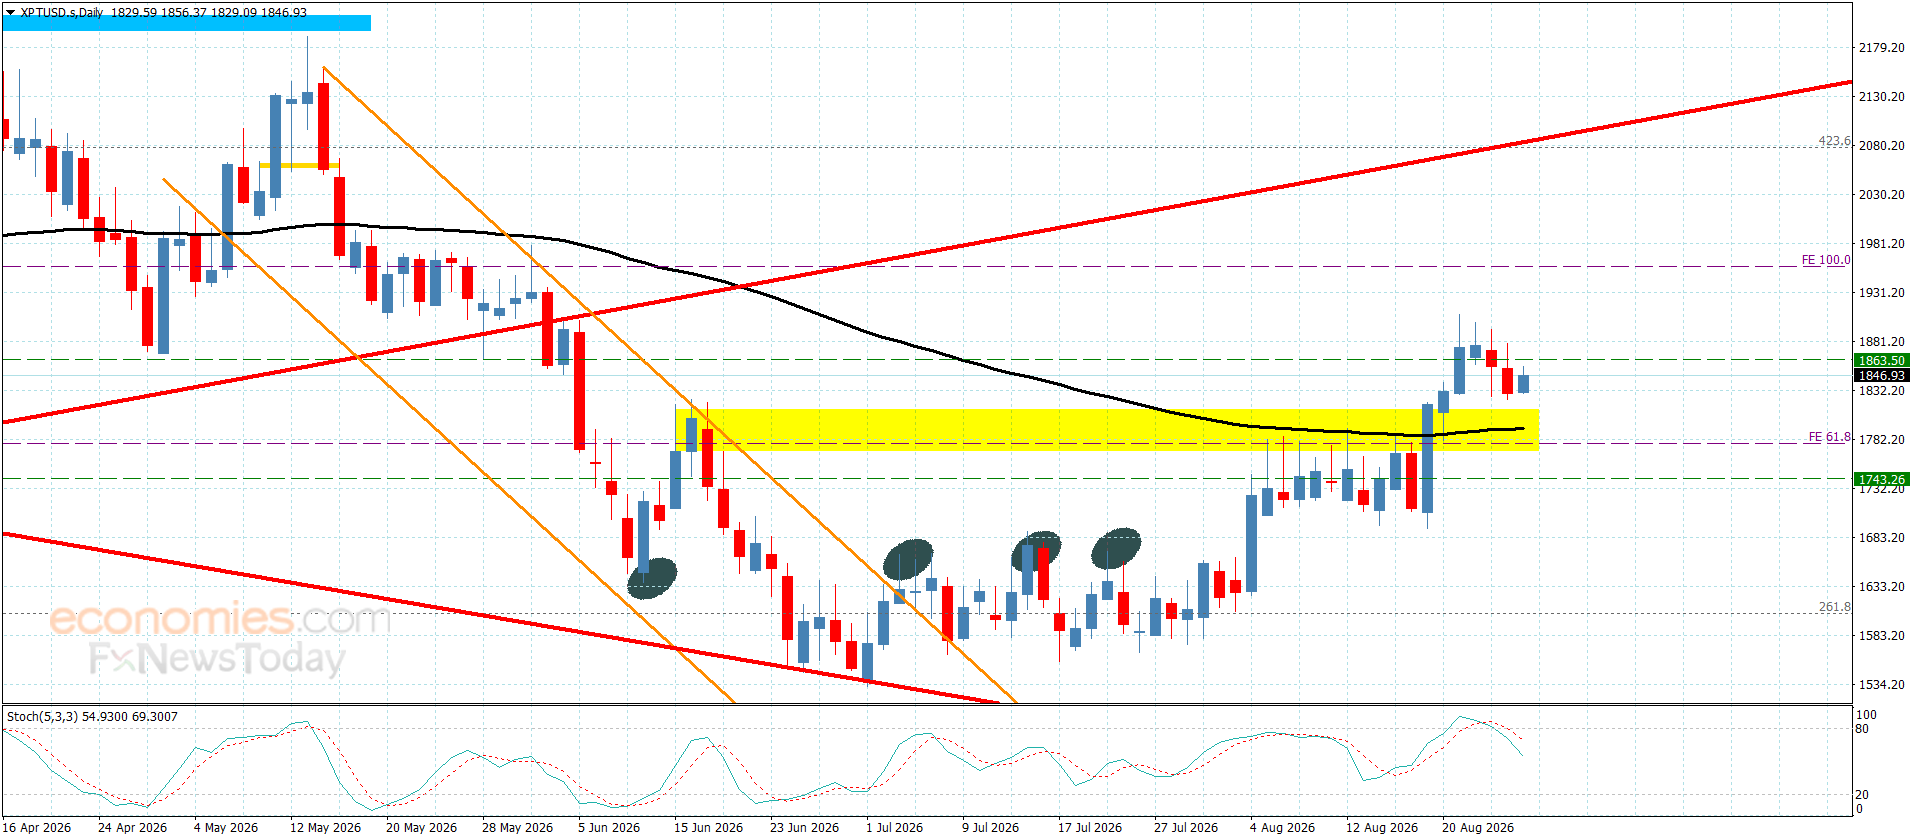
Platinum price kept providing sideways trading until this moment, due to its repeated confinement between $1780.00 support, while $1905.00 level represents a strong barrier against the attempts of resuming the bullish trend.
Noticing that stochastic exit the overbought level, which might push the price to provide corrective trading to test the mentioned sideways trend, while surpassing the barrier and holding above it will open the way for resuming the bullish trend, to expect targeting $1955.00 and $1990.00 level.
The expected trading range for today is between $1805.00 and $1905.0
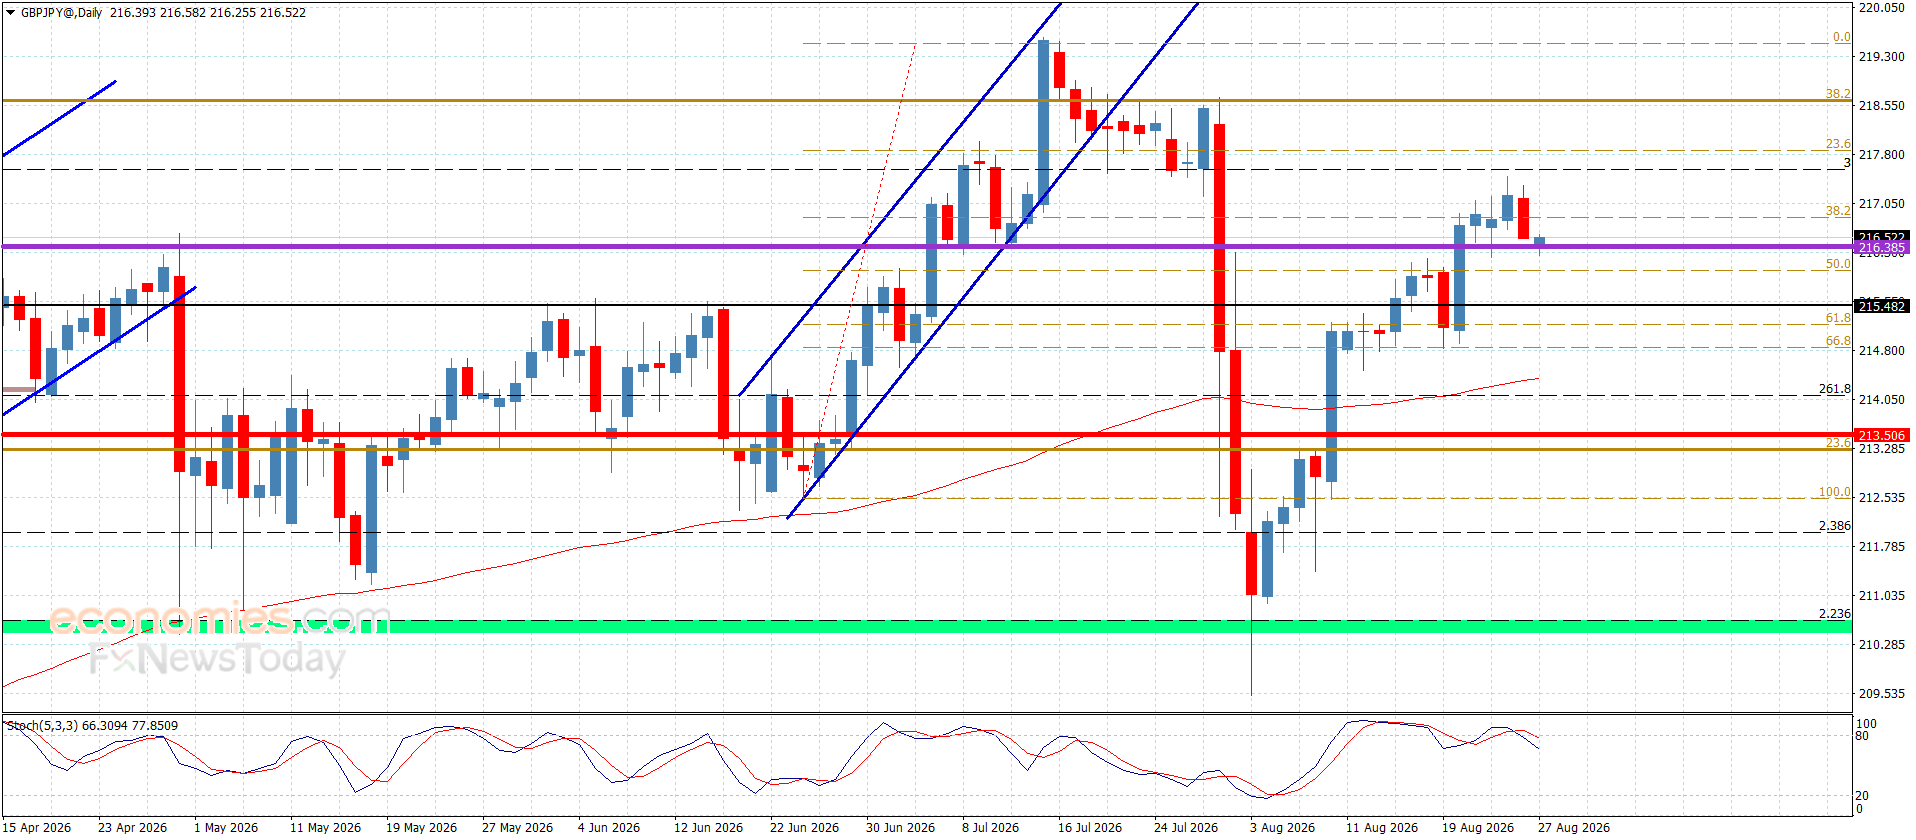
The GBPJPY pair faced some bearish pressures due to its stability below 21.85 besides stochastic exit from the overbought levels, which forces it to form some corrective trading by facing the initial support near 216.35.
The price needs extra bullish momentum, which allows it to settle above the current support, to confirm its readiness to activate the bullish trend by targeting 217.15, repeating the pressure to find an exit for recording extra gains in the upcoming period.
The expected trading range for today is between 216.10 and 217.85
The silver price (XAG/USD) is facing significant selling pressure as buyers struggle to reclaim ground below the 100-day Simple Moving Average (SMA), a key technical indicator watched by market participants. This level has emerged as a critical battleground for the precious metal, with the latest price action suggesting that momentum remains tilted to the downside in the current trading session.
Technical Analysis: The 100-Day SMA as a Pivot Point
The 100-day SMA is a widely followed trend indicator that smooths out price data over the past 100 trading days, offering a clearer view of the medium-term trend. As of the most recent market close, silver is trading below this dynamic resistance level, which is acting as a formidable barrier to any upside recovery. In technical analysis, a failure to break above a key moving average often signals that the broader trend is still bearish, prompting sellers to defend the level aggressively.
This price action is occurring within a broader context of consolidation. Silver has been range-bound for several weeks, but the repeated rejection at the 100-day SMA suggests that the balance of power is shifting in favor of the bears. A sustained move below the current support zone could open the door for a test of the next major support level, while a decisive break above the SMA would invalidate the bearish outlook and could trigger a wave of short-covering.
Market Drivers: What is Influencing Silver Prices?
The movement in silver is being driven by a complex interplay of macroeconomic factors. The primary driver remains the monetary policy outlook from the U.S. Federal Reserve. Expectations for interest rate cuts have been a key support for precious metals, as lower rates reduce the opportunity cost of holding non-yielding assets like silver. However, recent economic data has been robust, leading traders to push back their expectations for the timing of the first rate cut, which in turn has strengthened the U.S. dollar and weighed on silver prices.
Additionally, industrial demand continues to provide a fundamental floor for silver. The metal is a critical component in solar panels, electronics, and electric vehicles. While this long-term demand story remains intact, short-term price action is heavily influenced by the dollar’s strength and U.S. Treasury yields. A stronger dollar makes silver more expensive for foreign buyers, while higher yields offer a competing safe-haven investment.
Key Levels to Watch for XAG/USD
For traders and investors, the immediate focus is on the interaction between price and the 100-day SMA. The area just below this indicator is acting as immediate resistance. On the downside, the recent swing lows serve as the first line of support. A break below this level would likely accelerate selling pressure, potentially leading to a retest of the next psychological support level at the $30.00 mark. Conversely, a daily close above the 100-day SMA would be the first technical sign that the correction is over, with the next resistance target being the recent consolidation high.
Conclusion
Silver is at a critical juncture, with the 100-day SMA acting as a clear line in the sand for the medium-term trend. The failure of buyers to regain this level highlights the current bearish sentiment, driven by a resilient U.S. dollar and shifting rate cut expectations. While the long-term industrial outlook remains positive, the immediate technical picture suggests that the path of least resistance is to the downside unless a decisive break above the 100-day SMA occurs. Market participants will be closely watching upcoming U.S. economic data for fresh catalysts that could determine the next directional move.
FAQs
Q1: What is the 100-day SMA in silver trading? The 100-day Simple Moving Average is a technical indicator that calculates the average closing price of silver over the last 100 trading days. It is used by traders to gauge the medium-term trend and identify potential support and resistance levels.
Q2: Why is the U.S. dollar important for silver prices? Silver is priced in U.S. dollars on global markets. When the dollar strengthens, it becomes more expensive for holders of other currencies to buy silver, which typically reduces demand and pushes prices down. Conversely, a weaker dollar usually supports higher silver prices.
Q3: What are the key support and resistance levels for silver? Currently, the 100-day SMA acts as immediate resistance. On the downside, the recent swing low is the first support level, followed by the psychological $30.00 mark. A break above the 100-day SMA would point to the recent consolidation high as the next resistance target.
EUR/JPY depreciates after registering modest gains, trading around 185.60 during the European hours on Wednesday. The technical analysis of a daily chart indicates that the currency cross is remaining within the ascending channel pattern, signaling an ongoing bullish bias.
The EUR/JPY cross is keeping a constructive bullish tone as it holds above both the nine- and 50-period Exponential Moving Averages (EMAs). The currency cross is advancing away from its mid-180s base while short-term averages stay stacked above the longer one, which hints at persistent upward pressure.
The 14-day Relative Strength Index (RSI) at 57.38 sits in positive territory but shy of overbought conditions, suggesting room for additional gains while upside momentum remains moderate rather than stretched. The EUR/JPY cross may rise toward the all-time high of 187.95 set on April 17, followed by the upper boundary of the ascending channel around 188.20.
On the downside, the EUR/JPY cross tests the immediate support around the lower boundary of the ascending channel, aligned with the nine-day EMA at 185.19 and the 50-day EMA at 184.72. A break below this confluence support zone may cause the bearish reversal, potentially pressing the currency cross down toward its nine-month low of 179.37, recorded on August 3.
EUR/JPY: Daily Chart
(The technical analysis of this story was written with the help of an AI tool. Know more.)
Euro Price Today
The table below shows the percentage change of Euro (EUR) against listed major currencies today. Euro was the weakest against the Australian Dollar.
USD
EUR
GBP
JPY
CAD
AUD
NZD
CHF
USD
0.06%
0.18%
-0.10%
0.20%
-0.24%
0.33%
0.30%
EUR
-0.06%
0.12%
-0.15%
0.19%
-0.29%
0.27%
0.24%
GBP
-0.18%
-0.12%
-0.30%
0.06%
-0.40%
0.16%
0.13%
JPY
0.10%
0.15%
0.30%
0.31%
-0.13%
0.46%
0.40%
CAD
-0.20%
-0.19%
-0.06%
-0.31%
-0.44%
0.16%
0.09%
AUD
0.24%
0.29%
0.40%
0.13%
0.44%
0.60%
0.53%
NZD
-0.33%
-0.27%
-0.16%
-0.46%
-0.16%
-0.60%
-0.06%
CHF
-0.30%
-0.24%
-0.13%
-0.40%
-0.09%
-0.53%
0.06%
The heat map shows percentage changes of major currencies against each other. The base currency is picked from the left column, while the quote currency is picked from the top row. For example, if you pick the Euro from the left column and move along the horizontal line to the US Dollar, the percentage change displayed in the box will represent EUR (base)/USD (quote).
Coffee prices today in the domestic market turned down in key areas. According to giacaphe. com, coffee prices on August 26 averaged 97,100 VND/kg, down 500 VND/kg compared to the previous session.
In Dak Lak, coffee prices were recorded at 97,000 VND/kg, down 500 VND/kg.
In Lam Dong, coffee prices reached 96,500 VND/kg, down 500 VND/kg. This is the lowest level among the surveyed areas.
In Gia Lai, coffee prices are at 97,000 VND/kg, down 500 VND/kg.
The old Dak Nong area recorded a level of 97,200 VND/kg, down 500 VND/kg. This is the highest level in today’s price list.
After the previous increase of 1,000 VND/kg, the price level has cooled down, but still remains around the 97,000 VND/kg range.
The USD/VND exchange rate according to Vietcombank was recorded at 25,890 VND/USD, down 30 VND.
World coffee prices
In the world market, coffee prices fell sharply in the most recent session.
According to Barchart, the December 2026 Arabica futures contract closed down 6.15 US cents/lb, equivalent to 1.80%. In the same session, the November 2026 Robusta futures contract fell 111 USD/ton, equivalent to 2.92%.
Barchart said coffee prices wiped out the upward momentum at the beginning of the session and fell sharply as information emerged that some warehouses in Brazil no longer received new coffee due to running out of storage space. This increased expectations that farmers may have to sell more as storage space shrinks.
This development puts pressure on domestic coffee prices, especially when Robusta fell nearly 3% in the most recent session. For Vietnam, Robusta is still the group that has a more direct impact on domestic purchasing prices.
Coffee price assessment
Domestic coffee prices decreased by 500 VND/kg after a strong increase session, in the same direction as the adjustment of world prices. Domestic decreases are not too deep, but show that the market is still fluctuating rapidly around the 97,000-98,000 VND/kg range.
According to Barchart, Robusta is under more pressure as Robusta’s ICE-certified inventory rose to a 9-month high. In the opposite direction, Arabica’s ICE-certified inventory fell to a 2.75-year low, which is a factor that could support Arabica in subsequent sessions.
Barchart also recorded Brazilian coffee harvest progress still slower than the same period. Cooxupe Cooperative said harvest reached 81.1% as of August 14, lower than 86.1% in the same period last year; Safras & Mercado recorded Brazilian coffee harvest reaching 90% as of August 12, lower than 97% in the same period and the 5-year average of 94%.
Domestically, according to the Ministry of Agriculture and Environment, in July, Vietnam exported about 147,600 tons of coffee, worth 639.5 million USD. Accumulated in the first 7 months of the year, coffee exports reached about 1.2 million tons, up 10.8% in volume but turnover decreased by 11.2%, to 5.45 billion USD. This development is mainly due to the average export price decreasing by 19.9% compared to the same period, down to 4,537 USD/ton.
Regarding the weather, the National Center for Hydro-Meteorological Forecasting said that on the day and night of August 26, the Central Highlands area will be cloudy, with showers and thunderstorms in some places; especially in the late afternoon and evening, there will be scattered showers and thunderstorms. Lowest temperature 21-24 degrees C, in some places below 20 degrees C; highest temperature 29-32 degrees C.
Rainstorms in this season need to be monitored in terms of garden care, pest and disease prevention, and goods preservation.
The Pound US Dollar (GBP/USD) exchange rate weakened on Wednesday as investors assessed the latest batch of US economic data.
At the time of writing, GBP/USD was trading at around $1.3605, down roughly 0.3% from Wednesday’s opening levels.
The US Dollar (USD) gained ground against most of its major counterparts on Wednesday after the release of the latest US core PCE price index.
The Federal Reserve’s preferred gauge of underlying inflation showed price growth remained unchanged at 3.3% in July, leaving it close to the two-year high of 3.4% recorded in May.
The lack of further progress in bringing inflation towards the Fed’s 2% target encouraged investors to increase their expectations for additional monetary tightening later this year, providing a boost to the ‘Greenback’.
The US Dollar also benefited from stronger-than-anticipated durable goods orders, with the latest figures showing a significantly larger increase in demand than economists had forecast.
The Pound (GBP) struggled on Wednesday as the announcement of a 4% increase in the UK’s energy price cap renewed concerns over pressure on household finances.
Save on Your GBP/USD Transfer
Get better rates and lower fees on your next international money transfer.
Compare TorFX with top UK banks in seconds and see how much you could save.
Although the rise had been largely expected after sustained disruption to energy supplies in the Gulf, investors remained wary that higher household bills could weigh on consumer spending and undermine the UK’s economic recovery.
There are also concerns that rising utility costs could feed through into inflation, creating another headache for the Bank of England (BoE) and potentially strengthening the case for further interest rate increases before the end of the year.
Near-Term GBP/USD Forecast: Fed Chair to Take Centre Stage at Jackson Hole
Looking towards the remainder of the week, attention will turn firmly to the Federal Reserve’s annual Jackson Hole symposium and any clues it may provide over the bank’s future policy direction.
New Fed Chair Kevin Warsh has so far favoured limiting forward guidance from the central bank. However, persistent inflation and renewed volatility in US bond markets could encourage him to offer greater insight into the Fed’s plans.
Investors may therefore remain cautious ahead of Warsh’s speech on Friday, potentially keeping the Pound to US Dollar (GBP/USD) exchange rate relatively subdued.
With the UK economic calendar offering little of note in the meantime, Sterling is likely to take its direction from broader currency market trends on Thursday.
Like this piece? Please share with your friends and colleagues:
International Money Transfer? Ask our resident FX expert a money transfer question or try John’s new, free, no-obligation personal service! ,where he helps every step of the way,
ensuring you get the best exchange rates on your currency requirements.
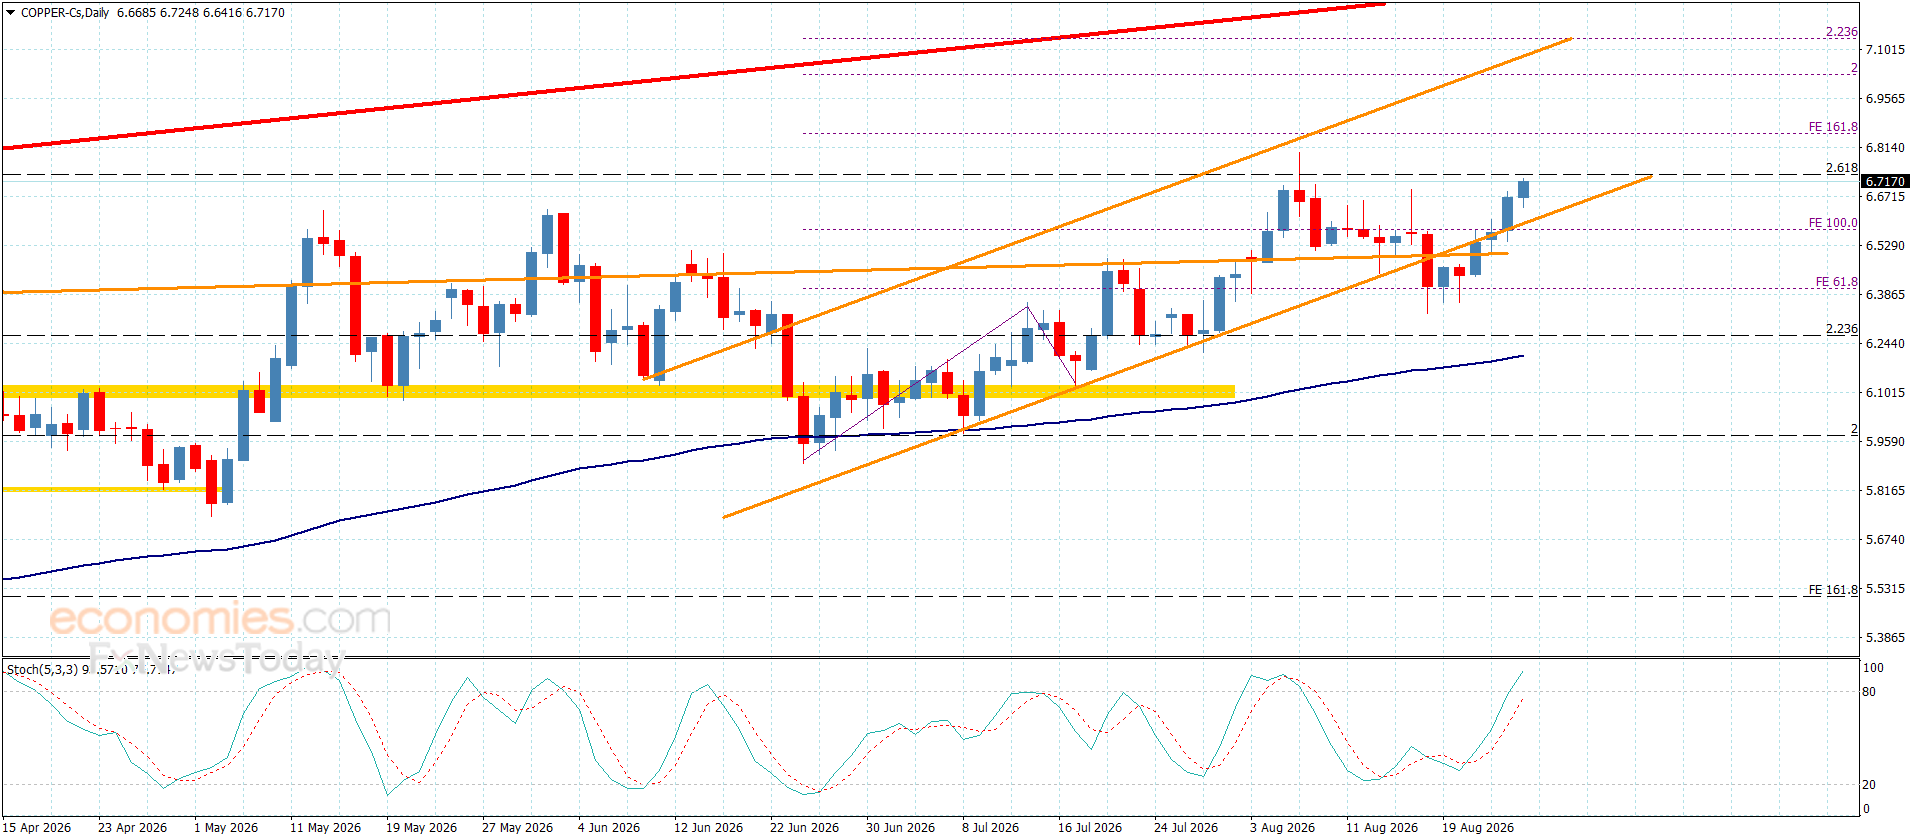
Copper price reacted to the positive signals from the main indicators, breaking above the barrier at $6.6100, reinforcing its commitment to the bullish scenario and currently settling near $6.7200 as it approaches the target proposed in the previous report.
The price is currently positioned within the pivots of the minor ascending channel. As the main indicators continue to provide positive momentum, this will increase the effectiveness of the bullish path, which could target $6.8500, followed by $7.0200 over the medium term.
The expected trading range for today is between $6.6300 and $6.7800
The USD/JPY pair continues to face strong resistance at the 20-day exponential moving average (EMA), as of the latest trading session, with the yen maintaining its recent strength against the dollar. This technical barrier has repeatedly capped upside attempts, keeping the pair within a tight range and signaling that sellers remain in control in the near term.
Why the 20-Day EMA Matters for USD/JPY
The 20-day EMA is a widely watched short-term trend indicator that traders use to gauge momentum and potential support or resistance levels. In the current USD/JPY setup, the pair has consistently failed to close above this moving average, indicating that the recent bearish momentum is still intact. As of this week, the 20-day EMA sits just above the current price, and each rally toward that level has been met with fresh selling pressure, reinforcing its role as a key barrier.
This technical pattern suggests that unless there is a decisive break above the 20-day EMA, the pair is likely to remain under pressure. A sustained move above this level could signal a shift in sentiment, but until then, traders are treating it as a sell zone. The repeated rejection at this moving average also reflects broader market dynamics, including the interest rate differential between the U.S. and Japan and the safe-haven demand for the yen amid global uncertainties.
Market Context and Broader Implications
The yen’s strength comes against a backdrop of shifting expectations for monetary policy. The Bank of Japan has signaled a gradual normalization of its ultra-loose policy, which has supported the yen. Meanwhile, the Federal Reserve’s path on interest rates remains uncertain, with market participants closely watching U.S. economic data for clues. These fundamental factors are aligning with the technical picture, as the yen benefits from a narrowing rate differential.
For traders, the 20-day EMA is not just a technical level but a reflection of the market’s current risk appetite. A failure to break above it could lead to further downside, with the next support levels likely to be tested. Conversely, a breakout would open the door for a retest of higher resistance zones. The ongoing tug-of-war between these forces is keeping the pair range-bound, and the resolution of this technical standoff will likely set the tone for the coming weeks.
What to Watch Next
Key levels to monitor include the recent swing lows and the psychological 150.00 mark, which has acted as a support zone in the past. On the upside, a close above the 20-day EMA would be the first sign of bullish momentum, followed by the 50-day EMA as the next hurdle. Fundamental catalysts, such as U.S. inflation data or comments from central bank officials, could also trigger a breakout or breakdown.
Given the current technical and fundamental alignment, the path of least resistance appears to be lower, but traders should remain flexible. The 20-day EMA will continue to be a critical level to watch, and a decisive move beyond it will likely define the next trend.
Conclusion
In summary, the USD/JPY pair is currently constrained by the 20-day EMA, which has proven to be a formidable barrier. The yen’s strength, driven by monetary policy expectations and safe-haven flows, is keeping the pair under pressure. Traders should monitor this level closely, as a break above or below could signal the next significant move. As always, combining technical analysis with fundamental context is essential for making informed trading decisions.
FAQs
Q1: What is the 20-day EMA and why is it important for USD/JPY? The 20-day exponential moving average is a short-term trend indicator that smooths price data over the past 20 days, giving more weight to recent prices. For USD/JPY, it is currently acting as a resistance level, meaning the pair has struggled to rise above it, indicating bearish momentum.
Q2: What could cause a breakout above the 20-day EMA? A breakout could be triggered by a shift in fundamental factors, such as a surprise change in U.S. or Japanese monetary policy, or a significant economic data release that alters market sentiment. A decisive close above the 20-day EMA would be the first technical confirmation of a bullish reversal.
Q3: How long can the 20-day EMA continue to cap the upside? There is no set timeframe. The barrier will remain effective as long as sellers defend it. However, the longer the price stays below the EMA, the more likely a breakout becomes, as accumulation often occurs before a significant move. Traders should watch for volume and momentum indicators for clues.
Gold price (XAU/USD) is down 0.75% to near $4,620 during the European trading session on Wednesday. The precious metal corrects as the rally pauses after posting a fresh three-month high at $4,697 the previous day, with investors turning cautious ahead of the United States (US) Personal Consumption Expenditure Price Index (PCE) data for July at 12:30 GMT and Federal Reserve (Fed) Chairman Kevin Warsh’s commentary at the Jackson Hole Symposium.
The US core PCE inflation, which is closely tracked by Federal Reserve (Fed) officials, is expected to have remained steady at 3.3% Year-on-Year (YoY), with monthly figures rising at a 0.2% pace, faster than the June reading of 0.1%.
Investors will pay close attention to the US PCE Inflation data to get fresh cues regarding the Federal Reserve’s (Fed) monetary policy outlook.
Signs of US inflationary pressures remaining steady might ease Fed’s interest rate hike expectations further, which receded significantly this month, following the release of the weak Nonfarm Payrolls (NFP) data for July.
Warsh’s Jackson Hole speech seen as key Fed credibility test amid long-bond jitters
Strategists at DBS flag Fed Chairman Kevin Warsh’s upcoming Jackson Hole keynote on Friday, August 28, as “the most important event this week,” but stress that the gathering is “viewed more as a credibility event rather than a rate-signalling one.” They note that “the past two days’ decline in the 30Y yield offers only a reprieve, not a resolution,” even as US Treasury Secretary Scott Bessent’s decision to expand long-bond buybacks “seeks to calm markets.” Against this backdrop, DBS argues that “Warsh faces a difficult balancing act: defending the Fed’s independence and price-stability mandate while providing greater clarity on the Fed’s reaction function without abandoning his preference for less forward guidance.”
Gold Technical Analysis
In the daily chart, XAU/USD trades at $4,621.08, maintaining a bullish near-term bias as spot holds well above the 20-period Exponential Moving Average (EMA) at $4,411.62 and the 23.6% Fibonacci retracement at $4,338.71. The metal is also trading just over the 38.2% retracement at $4,580.10, suggesting buyers remain in control after the latest surge, while the Relative Strength Index (RSI) at 68.77 flirts with overbought territory, hinting that upside momentum is strong but increasingly stretched.
On the topside, initial resistance is located at the 50.0% Fibonacci retracement at $4,775.19, followed by the 61.8% level at $4,970.29, with higher hurdles aligning at the 78.6% retracement at $5,248.05 and the cycle high reference at $5,601.87. On the downside, immediate support is seen at the 38.2% retracement at $4,580.10, ahead of the 20-period EMA at $4,411.62, while a deeper pullback would expose the 23.6% Fibonacci retracement at $4,338.71 as the next notable demand area.
(The technical analysis of this story was written with the help of an AI tool. Know more.)
Gold FAQs
Gold has played a key role in human’s history as it has been widely used as a store of value and medium of exchange. Currently, apart from its shine and usage for jewelry, the precious metal is widely seen as a safe-haven asset, meaning that it is considered a good investment during turbulent times. Gold is also widely seen as a hedge against inflation and against depreciating currencies as it doesn’t rely on any specific issuer or government.
Central banks are the biggest Gold holders. In their aim to support their currencies in turbulent times, central banks tend to diversify their reserves and buy Gold to improve the perceived strength of the economy and the currency. High Gold reserves can be a source of trust for a country’s solvency. Central banks added 1,136 tonnes of Gold worth around $70 billion to their reserves in 2022, according to data from the World Gold Council. This is the highest yearly purchase since records began. Central banks from emerging economies such as China, India and Turkey are quickly increasing their Gold reserves.
Gold has an inverse correlation with the US Dollar and US Treasuries, which are both major reserve and safe-haven assets. When the Dollar depreciates, Gold tends to rise, enabling investors and central banks to diversify their assets in turbulent times. Gold is also inversely correlated with risk assets. A rally in the stock market tends to weaken Gold price, while sell-offs in riskier markets tend to favor the precious metal.
The price can move due to a wide range of factors. Geopolitical instability or fears of a deep recession can quickly make Gold price escalate due to its safe-haven status. As a yield-less asset, Gold tends to rise with lower interest rates, while higher cost of money usually weighs down on the yellow metal. Still, most moves depend on how the US Dollar (USD) behaves as the asset is priced in dollars (XAU/USD). A strong Dollar tends to keep the price of Gold controlled, whereas a weaker Dollar is likely to push Gold prices up.
EUR/USD is holding near 1.1670 as ING keeps 1.17 for September and 1.18 year-end, with US policy risks still weighing on the Dollar.
The Euro to Dollar (EUR/USD) exchange rate is holding around 1.1670 on Wednesday after a strong late-August advance carried the pair through several resistance levels that had frustrated Euro bulls earlier this month.
EUR/USD was quoted at 1.1669 early in the European session, having gained around 2.45% over the past month and reached a high of 1.1711 during the latest rally.
Currency analysts at ING remain reluctant to call a bottom in the broader Dollar decline.
“Most paths seem to lead to a weaker dollar, but Kevin Warsh’s speech on Friday could prove supportive,” ING’s Chris Turner said.
The bank believes positioning may still have further to adjust after the Dollar’s strong run earlier in the summer.
“There may still be room for further USD long-squeezing, and we remain reluctant to call the bottom in this dollar selloff just yet,” Turner added.
That view has gained some support from the wider market backdrop.
The Dollar index was hovering close to a three-month low on Wednesday after US Treasury measures aimed at limiting pressure on long-term bond yields added another source of uncertainty around the Greenback.
Reuters reported on Wednesday that EUR/USD was around 1.1661 as traders waited for US PCE inflation and Warsh’s Jackson Hole address, with Standard Chartered also warning that attempts to push US rates lower could create another Dollar headwind.
The one-month chart shows the scale of the change, with EUR/USD climbing from below 1.1400 in late July to above 1.1700 before consolidating around 1.1670.
Euro (EUR) Positioning Still Leaves Room for Buyers
ING also sees the futures market as relatively supportive for the Euro rather than dangerously crowded.
Asset managers and leveraged funds have been buying Euro contracts, although Turner stresses that the overall positions remain fairly modest.
“Speculators look quite underweight the euro,” he said, noting that the available positioning data also pre-dated last week’s sharp EUR/USD breakout.
That leaves scope for further buying if US rate expectations or confidence in the Dollar soften again.
The European data backdrop has meanwhile improved.
ING had expected Germany’s August Ifo survey to continue recovering, and Tuesday’s release was stronger than forecast, with the business climate index rising to 88.8 from 86.7 against expectations near 87.2.
As we noted in our earlier ING EUR/USD forecast, the bank’s 1.18 year-end call originally rested heavily on softer US employment data reducing the case for further Fed tightening.
The latest move has brought spot much closer to that destination.
Near-Term EUR/USD Forecast: 1.1660/70 Is the Immediate Line to Watch
ING’s technical reference point is particularly timely because EUR/USD is sitting almost directly on top of it.
“We do not really see the need for EUR/USD to come back sharply under support at 1.1660/70 today,” Turner said, although he warned that last week’s breakout area could come back into play if risk assets suffer a broader setback.
That support zone now separates a fairly orderly consolidation from a more meaningful reversal of the recent Euro rally.
There is also an interesting contrast with our recent MUFG EUR/USD analysis, when the 1.1630 area was still acting as resistance and MUFG warned that the Euro looked rich relative to short-term fundamentals.
EUR/USD has since broken above that level and held there.
ING nevertheless sees Friday’s Jackson Hole speech as a genuine risk to the bullish picture.
“The speech could be a hawkish event risk for the dollar,” Turner said, with Warsh expected to reinforce the Fed’s inflation-fighting credentials after his July press conference unsettled the Treasury market.
Before then, traders face July PCE inflation, with the US Bureau of Economic Analysis due to publish the Fed’s preferred inflation measures later on Wednesday.
ING Keeps 1.18 Year-End Target
ING has not been tempted to raise its forecasts simply because spot has moved rapidly higher.
“At present, we are happy with our current forecasts for EUR/USD at 1.17 end September and 1.18 for end year – but will be reviewing those this week,” Turner said.
With EUR/USD already near 1.1670, the 1.17 September target is now effectively within reach.
The more interesting question is whether softer US policy expectations, improving European data and relatively light Euro positioning can carry the pair towards 1.18 without first producing a deeper correction.
Our euro to dollar forecast for th short-term is 1.1660/70 is the level that should tell us whether the latest breakout is being consolidated or beginning to unwind.