About Editorial team of BIPNs

Main team of content of bipns.com. Any type of content should be approved by us.
26 11, 2025

Solana Price Prediction: Solana Holds Crucial Support While Analysts Track a Potential $180 Recovery Path

By |2025-11-26T23:35:28+02:00November 26, 2025|Crypto News, News|0 Comments

Solana price is stabilizing above key support levels once again, drawing renewed participants’ attention as the market watches for early signals of its next major move.

Solana price is stabilizing once again above the $135 to $140 zone, with price attempting to regain momentum after a brief period of market stagnation. Traders are now watching whether SOL can build enough strength to challenge the overhead resistance that has repeatedly capped rallies over the past week.

This steady rebound comes at a time when broader crypto sentiment remains mixed, putting additional focus on Solana’s tightening structure and the early signals emerging across multiple technical charts.

Solana price continues to defend the mid-range support around $130, a level that has repeatedly influenced short-term trading behavior. This region has acted as a reaction point throughout November, and market observers are noting that buyers are still stepping in each time SOL approaches this zone.

The recent recovery has brought Solana price today back towards the $139 to $140 handle, prompting traders to assess if this rebound carries enough momentum to challenge the key resistance cluster just above current levels.

SOL Faces Breakout Test as Trendline Resistance Approaches

One of the more notable technical observations comes from Gordon, who highlighted a clean descending trendline that has controlled Solana’s short-term movements. According to him, once SOL breaks above this level, it could “be good night to bears,” signaling a potential shift in momentum.

Solana continues to press against its descending trendline, building higher lows as buyers test this key breakout zone. Source: Gordon via X

The price structure beneath this trendline shows consistent higher lows forming on shorter timeframes, suggesting early pressure building against the resistance. If Solana can secure a decisive close above this diagonal barrier, a push towards the $145 to $148 region becomes increasingly likely. Historically, such reclaim patterns in SOL have led to fast continuation moves, particularly when backed by strengthening volume.

Rejection From $141 Keeps Short-Term Market Cautious

A contrasting view came from DevKhabib, who pointed to the recent rejection at the $141 mark as a sign that buyers are not yet strong enough to force a clean breakout. His analysis noted that the market remains stagnant, with Solana lacking the momentum needed to push beyond key intraday resistances.

Solana Price Prediction: Solana Holds Crucial Support While Analysts Track a Potential 0 Recovery Path

Solana faces renewed hesitation at the $141 resistance, with market momentum cooling and a potential retest of the $127 support zone on the table. Source: DevKhabib via X

The structure on his chart suggests that SOL may revisit the $127 support area once more before any sustained move higher. This level has generated multiple strong reactions in prior sessions, making it a reliable zone for traders looking for discounted entries. A retest would also reset momentum indicators, giving Solana a healthier foundation for any upcoming advance.

On-Chain Data Shows Heavy Supply Near $142

On the on-chain side, Ali Martinez highlighted that 13 million SOL were accumulated around the $142 level, effectively turning it into a major resistance zone. Cost basis heatmaps show dense supply sitting just above current prices, explaining why the market struggles to clear this region on initial attempts.

On-Chain Data Shows Heavy Supply Near $142

On-chain data reveals a dense 13 million SOL cost-basis cluster around $142, forming a supply wall that continues to cap Solana’s upside attempts. Source: Ali Martinez via X

This cluster of holders at $142 increases the likelihood of profit-taking each time Solana approaches the zone, creating a supply wall that must be absorbed before any sustained upside move can unfold. Historically, such dense pockets of cost-basis concentration take multiple tests to break through.

High-Timeframe Structure Points Towards $480

A more macro view was shared by Trader Tardigrade, who suggested that Solana may be undergoing a massive Wyckoff-style reaccumulation phase at the current level. His chart outlines the classic multi-phase structure, with SOL potentially transitioning between phase C and phase D.

High-Timeframe Structure Points Towards $480

Macro chart suggests Solana may be in a Wyckoff-style reaccumulation phase. Source: Trader Tardigrade via X

This higher-timeframe roadmap introduces several technical targets. An initial breakout from the accumulation zone could send Solana price towards the mid-range resistance around $165 to $180, which represents the first major liquidity block from earlier this year. If buyers maintain control through phase D, the next structural target emerges around $220 to $240, aligning with the top of the previous distribution area. A full Wyckoff completion typically indicates a more aggressive expansion, with the long-term upside projection ranging between $360 and $480.

Final Thoughts: Solana Technical Analysis

Solana’s current structure is defined by a tightening range between support and resistance, with price hovering near the $139 to $140 band. On the downside, immediate support sits at $135, followed by the more critical $130 to $127 zone. This lower band has produced several strong bounces and remains the key level that must hold to maintain the broader bullish setup.

Final Thoughts: Solana Technical Analysis

Solana current price is $137.46, down 2.48% in the last 24 hours. Source: Brave New Coin

On the upside, Solana price faces layered resistance. The first obstacle remains $141 to $142, a zone reinforced both technically and by on-chain supply concentration. Above this region, the next resistance band appears at $148 to $150, where multiple prior rejections were recorded. If Solana price clears this range, a more open path emerges towards $180 and then $200.


Source link

26 11, 2025

BI DeFi Announces New Web3 Yield Platform Update Following

By |2025-11-26T22:18:08+02:00November 26, 2025|News, NFT News|0 Comments


London, UK, Nov. 26, 2025 (GLOBE NEWSWIRE) — BI DeFi has issued a timely announcement in response to widespread reports claiming that a U.S. quantum research team may have breached Bitcoin wallets belonging to several major institutions — potentially affecting more than $15 billion in crypto assets.

Although the reports remain unverified, the global crypto market reacted instantly. Bitcoin (BTC), Ethereum (ETH), and Ripple (XRP) all experienced sharp price swings, fueling renewed concerns about digital asset security and the resilience of current encryption standards.

As fear and uncertainty grow, BI DeFi is officially launching a new upgrade to its Web3 yield platform, aimed at providing stable, automated, and beginner-friendly earning tools for users seeking predictable income during market turbulence.

BI DeFi Announces Its Latest Web3 Earning Platform Upgrade

BI DeFi confirmed today that the company has released a new version of its automated digital asset yield system, now available through its mobile application. This upgrade enhances security layers, simplifies asset management, and improves daily yield tracking — making it easier for both new and experienced users to earn steady digital rewards without engaging in high-risk trading.

BI DeFi offers new users a free introductory contract worth $17, with daily yields of $0.60.

A BI DeFi spokesperson stated:

“With global concerns around crypto security rising, we believe users deserve a safe, transparent, and stable way to benefit from digital assets. Our new platform upgrade focuses on simplicity, regulatory compliance, and long-term sustainability.”

Key Advantages of BI DeFi’s Newly Updated Platform

Fully Compliant and Transparent

BI DeFi maintains open, auditable systems to build long-term user trust.

Strengthened Security Architecture

The latest update includes enhanced multi-layer protection using offline cold storage, McAfee® infrastructure, and Cloudflare® network defence.

 Supports Leading Cryptocurrencies

BTC, ETH, XRP, SOL, DOGE, USDT, LTC, USDC, and others are fully supported for deposits and settlements.

 Automated Daily Earnings

Users receive stable, predictable daily yields directly into their accounts — ideal for investors seeking consistent passive income in uncertain markets.

 Sustainable Green Energy Operations

BI DeFi’s digital infrastructure is powered by clean and renewable energy sources across multiple regions.

 Partner & Affiliate Rewards

Users can earn significant long-term commissions, with rewards reaching up to $50,000 for top referrers.

How to Start Earning With BI DeFi’s New Platform Upgrade

  1. Register
    Sign up on the official website and instantly receive a $17 welcome bonus.
  2. Select a Plan
    Choose a yield plan suited to your financial needs.
  3. Start Earning Automatically
    Earnings are credited every 24 hours. Your principal is fully released once the plan matures.

Popular BI DeFi Yield Plans

  • $100 • 2 Days • Daily Yield: $4 • Total: $108
  • $500 • 6 Days • Daily Yield: $6.5 • Total: $539
  • $1,000 • 10 Days • Daily Yield: $13.3 • Total: $1,133
  • $5,000 • 20 Days • Daily Yield: $73.5 • Total: $6,470
  • $10,000 • 30 Days • Daily Yield: $161 • Total: $14,830

(Click here to download the BI DeFi application)

About BI DeFi

BI DeFi is a digital asset yield platform committed to a green, smart, open, and sustainable Web3 ecosystem. With over 2 million users across 180+ countries, the company operates renewable-energy-powered data facilities in the United States, United Kingdom, Australia, Canada, Brazil, Kazakhstan, and more.

The company’s newly upgraded platform allows users to monitor daily earnings, manage yield plans, and access support directly through the mobile app — offering a simplified and accessible gateway into Web3 earning systems.

Disclaimer: The information provided in this press release does not constitute an investment solicitation, nor does it constitute investment advice, financial advice, or trading recommendations. It is strongly recommended that you perform due diligence before investing or trading in cryptocurrencies and securities, including consulting a professional financial advisor.


Source link

26 11, 2025

Rate Cuts in America Loom (Chart)

By |2025-11-26T21:50:10+02:00November 26, 2025|Forex News, News|0 Comments

  • The British pound rallied as shifting expectations for Federal Reserve policy drive most currency action at the moment.
  • Holiday-thinned U.S. trading is likely to amplify volatility, with GBP/USD facing key resistance near 1.32 while broader sentiment remains cautious.

The British pound rallied on Tuesday as we continue to see traders go back and forth with their expectations on what the Federal Reserve may or may not do. The latest movement has been based on the idea that the Federal Reserve is going to cut to the bone again. And really, at this point, I think the entirety of the currency markets is focusing on the Federal Reserve and probably not much more than that.

This is going to lead to even more volatility, but this week is going to be especially dangerous as the Americans are going to be away for Thanksgiving. Thanksgiving is on Thursday, and most Americans not only will be away from their desk on Thursday but will probably be away from their desk on Friday anyway.

Volatility Risks and Dollar Reaction

So, with that being said, I would expect a radical and nonsensical movement at times with the retail sales figures coming out a little softer than anticipated during the trading session. We’ve seen the US dollar take it on the chin, but ironically, a weak US consumer might actually have people running back toward the US dollar eventually, at least for some type of safety.

The British pound is going to remain soft in relation to other currencies as the Bank of England came dangerously close to cutting interest rates last time. And I think that’s something that people will still focus on. With that being the case, I think signs of exhaustion will probably get sold into. But again, this week is going to be thin from a volume standpoint, and that’s something that you need to pay close attention to.

The 1.32 level is an area that I think a lot of people will be watching, as it is an area that has seen both support and resistance and is the top of the current range that we are in. The 50-day EMA is doing everything it can to cross below the 200-day EMA, kicking off the so-called death cross, which is a longer-term selling signal, but not necessarily one that I find overly reliable. So with that being the case, I’m watching the 1.32 level very closely for signs of exhaustion.

Ready to trade our daily GBP/USD Forex forecast? Here’s some of the best forex broker UK reviews to check out.

Christopher Lewis has been trading Forex and has over 20 years experience in financial markets. Chris has been a regular contributor to Daily Forex since the early days of the site. He writes about Forex for several online publications, including FX Empire, Investing.com, and his own site, aptly named The Trader Guy. Chris favours technical analysis methods to identify his trades and likes to trade equity indices and commodities as well as Forex. He favours a longer-term trading style, and his trades often last for days or weeks.

Source link

26 11, 2025

$3.09+ BN Loose Leaf Tea Market Forecasts to 2034: Rising

By |2025-11-26T21:41:03+02:00November 26, 2025|Dietary Supplements News, News|0 Comments


NEW YORK, USA, Nov. 26, 2025 (GLOBE NEWSWIRE) — Zion Market Research has published a new research report titled “Loose Leaf Tea Market By Type (Black Tea, Green Tea, Oolong Tea, White Tea, Herbal & Specialty Tea), By Category (Conventional Loose Leaf Tea, Organic Loose Leaf Tea), By Distribution Channel (Supermarkets & Hypermarkets, Specialty Stores, Online Retail/E-Commerce, Convenience Stores, and Others), and By Region – Global and Regional Industry Overview, Market Intelligence, Comprehensive Analysis, Historical Data, and Forecasts 2025 – 2034” in its research database.

“According to the latest research study, the global loose leaf tea market size was valued at around USD 3.09 billion in 2024. The market is expected to grow at a CAGR of 5.50% and is anticipated to reach a value of USD 4.75 billion by 2034.”

Download Sample Pages of the Report Now for more Insights – https://www.zionmarketresearch.com/sample/loose-leaf-tea-market

(Before you plan to buy, sample reports are a great option to examine our in-depth studies or reports)

Loose Leaf Tea Industry Overview:

Loose-leaf tea is partially broken or whole tea leaves that are not confined to customary tea bags, offering a more aromatic, fresher, and higher-quality brew. Unlike bagged tea, it enables the leaves to fully expand during steeping, releasing essential oils, more decadent flavors, and antioxidants. The global loose leaf tea market is poised for significant growth, driven by increasing health and wellness awareness, premiumization, a shift in taste preferences, and the rise of cafés and specialty tea shops. Consumers are actively inclining towards beverages rich in antioxidants, catechins, and polyphenols. Loose-leaf tea is considered a healthier alternative to coffee and soft drinks, thereby fueling its demand. The growing demand for artisanal and premium beverages is surging interest in loose-leaf tea.

Report Scope:

Report Attribute Report Details
Market Size in 2024 USD 3.09 Billion
Market Forecast in 2034 USD 4.75 Billion
Growth Rate CAGR of 5.50%
Base Year 2024
Forecast Years 2025- 2034
Key Companies Covered Twinings, Harney & Sons, T2 Tea, DAVIDsTEA, The Republic of Tea, Teavana, Kusmi Tea, Dilmah Tea, Ahmad Tea, Numi Organic Tea, Bigelow Tea Company, Mighty Leaf Tea, Yogi Tea, Choice Organic Teas, Adagio Teas, and others.
Segments Covered By Type, By Category, By Distribution Channel, and By Region
Regions Covered North America, Europe, Asia Pacific, Latin America, and the Middle East & Africa
Customization Scope Avail customized purchase options to meet your exact research needs.

For Detailed Pricing and Tailored Market Report Options, Click Here: https://www.zionmarketresearch.com/buynow/su/loose-leaf-tea-market

Key Insights

  • As per the analysis, the loose leaf tea market share is likely to grow at a CAGR of around 5.50% between 2025 and 2034.
  • The loose leaf tea market size was worth around $3.09 billion in 2024 and is estimated to hit approximately $4.75 billion by 2034. Due to a variety of driving factors, the market is predicted to rise at a significant rate.
  • The loose leaf tea market is projected to grow significantly due to the rising awareness of health and wellness benefits, the growing café and tea shop culture worldwide, and innovations in flavors and blends.
  • Based on type, the black tea segment is expected to lead the market, while the green tea segment is expected to grow considerably.
  • Based on category, the conventional loose leaf tea segment is the largest, while the organic loose leaf tea segment is projected to experience substantial revenue growth over the forecast period.
  • Based on the distribution channel, the supermarkets & hypermarkets segment is expected to lead the market compared to the specialty stores segment.
  • Based on region, the Asia Pacific is projected to dominate the global market during the estimated period, followed by Europe.

Loose Leaf Tea Market: Growth Factors

Premiumization & specialty tea demand fuel the market growth

Premiumization is yet another key propeller as consumers are actively moving towards single-origin, specialty, and artisanal teas. Loose-leaf tea offers a richer taste, authenticity, and aroma than mass-produced CTC teas, motivating buyers to pay high prices for unique flavors. Provenance storytelling, small-batch harvest teas, and estate-grown branding are gaining prominence, especially in Europe and North America. This premium trend enables tea companies to maintain higher margins and differentiate themselves in a strong and competitive market.

How do sustainability & ethical sourcing trends propel the loose leaf tea industry growth?

Sustainability has become a central driver for the loose leaf tea market, as modern users increasingly prefer environmentally responsible and ethically sourced products. Loose-leaf tea brands are adopting fair-trade certifications, carbon-neutral practices, and organic labels to appeal to eco-conscious consumers. Ethical sourcing not just enhances brand reputation, but also promises better livelihoods for tea growers. Several companies are utilizing QR code traceability and blockchain to improve the transparency in their supply chains. As environmental concerns grow worldwide, the sustainability movement continues to enhance consumer loyalty and justify premium price points for high-quality teas.

$3.09+ BN Loose Leaf Tea Market Forecasts to 2034: Rising

Browse the full “Loose Leaf Tea Market By Type (Black Tea, Green Tea, Oolong Tea, White Tea, Herbal & Specialty Tea), By Category (Conventional Loose Leaf Tea, Organic Loose Leaf Tea), By Distribution Channel (Supermarkets & Hypermarkets, Specialty Stores, Online Retail/E-Commerce, Convenience Stores, and Others), and By Region – Global and Regional Industry Overview, Market Intelligence, Comprehensive Analysis, Historical Data, and Forecasts 2025 – 2034 – Global and Regional Industry Report 2025 – 2034” Report at https://www.zionmarketresearch.com/report/loose-leaf-tea-market

Loose Leaf Tea Market: Segmentation

The global loose-leaf tea market is segmented based on type, category, distribution channel, and region.

Based on type, the global loose leaf tea industry is divided into black tea, green tea, oolong tea, white tea, and herbal & specialty tea. The black tea segment holds a leadership position in the market, accounting for the highest global tea consumption.

Based on category, the global loose leaf tea market is segmented into conventional loose leaf tea and organic loose leaf tea. The conventional loose leaf segment held a dominant share due to its wide availability, well-established consumer base, and affordability. It dominates in price-sensitive regions, such as Africa and the Asia Pacific, where tea is a staple drink consumed daily.

Based on distribution channel, the global market is segmented as supermarkets & hypermarkets, specialty stores, online retail/e-commerce, convenience stores, and others. The supermarkets & hypermarkets segment captured a substantial share of the market. These outlets offer consumers a broad variety, trusted quality, and competitive pricing, increasing their preference.

Regional Scope:

What gives Asia Pacific a competitive edge in the global Loose Leaf Tea Market?

The Asia Pacific is projected to maintain its dominant position in the global loose leaf tea market, owing to its strong tea production base, deep-rooted cultural consumption, and growing disposable income. The Asia Pacific region holds a leading position in tea production, with economies such as Sri Lanka, China, and India accounting for over 75% of the global tea output. These economies supply international and domestic markets with premium loose-leaf tea varieties. The numerous plantations promise worldwide leadership in supply and cost efficiency. Tea drinking is an integral part of daily life in the APAC region, making it the leading consumer base. India and China together consume more than 60% of the worldwide tea, with loose leaf variety being the traditional preference. This legacy promises resilient and consistent demand in demographics.

Request For Customization – https://www.zionmarketresearch.com/custom/9883

Loose Leaf Tea Market: Competitive Landscape

The report contains qualitative and quantitative research on the global loose leaf tea market, as well as detailed insights and development strategies employed by the leading competitors.

Some of the leading players in the global loose leaf tea market include;        

  • Twinings
  • Harney & Sons
  • T2 Tea
  • DAVIDsTEA
  • The Republic of Tea
  • Teavana
  • Kusmi Tea
  • Dilmah Tea
  • Ahmad Tea
  • Numi Organic Tea
  • Bigelow Tea Company
  • Mighty Leaf Tea
  • Yogi Tea
  • Choice Organic Teas
  • Adagio Teas

The global loose leaf tea market is segmented as follows:

By Type

  • Black Tea
  • Green Tea
  • Oolong Tea
  • White Tea
  • Herbal & Specialty Tea

By Category

  • Conventional Loose Leaf Tea
  • Organic Loose Leaf Tea

By Distribution Channel

  • Supermarkets & Hypermarkets
  • Specialty Stores
  • Online Retail/E-Commerce
  • Convenience Stores
  • Others

By Region

  • North America
  • Europe
    • France
    • The UK
    • Spain
    • Germany
    • Italy
    • Rest of Europe
  • Asia Pacific
    • China
    • Japan
    • India
    • Southeast Asia
    • Rest of Southeast Asia
  • The Middle East & Africa
    • GCC
    • South Africa
    • Rest of the Middle East & Africa
  • Latin America
    • Brazil
    • Argentina
    • Rest of Latin America

Request Free Brochure of the Global Loose Leaf Tea Market @ https://www.zionmarketresearch.com/requestbrochure/loose-leaf-tea-market

Key Questions Answered in This Report:

  • What is loose leaf tea?
  • Which key factors will influence the loose leaf tea market growth over 2025-2034?
  • What will be the value of the loose leaf tea market during 2025-2034?
  • What will be the CAGR value of the loose leaf tea market during 2025-2034?
  • Which region will contribute notably towards the loose leaf tea market value?
  • Which are the major players leveraging the loose leaf tea market growth?
  • What can be expected from the global loose leaf tea market report?

Key Offerings:

  • Full in-depth analysis of the parent market
  • Important changes in market dynamics
  • Segmentation details of the market
  • Previous, ongoing, and projected market analysis in terms of volume and value
  • Assessment of niche industry developments
  • Market share analysis
  • Key strategies of major players
  • Emerging segments and regional markets
  • Testimonials to companies in order to fortify their foothold in the market

Browse Other Related Research Reports

  • Cinnamon Syrup Market By Product Type (Organic and Conventional), By Form (Liquid and Powder), By Flavor Profile (Pure Cinnamon, Cinnamon Vanilla, Spiced Cinnamon, Honey Cinnamon, and Others), By Application (Beverages, Bakery and Confectionery, Desserts, Breakfast Foods, Cocktails and Mocktails, and Others), By Distribution Channel (Supermarkets and Hypermarkets, Specialty Food Stores, Online Retailers, Convenience Stores, Food Service, and Others), By End-User (Household, Food Service Industry, Hotels and Restaurants, Cafes and Coffee Shops, Catering Services), and By Region – Global and Regional Industry Overview, Market Intelligence, Comprehensive Analysis, Historical Data, and Forecasts 2025 – 2034
  • Advantame Market By Type (Liquid, Powder), By Application (Beverages, Dairy, Baked Goods, Confectionery, Other Food And Beverages), By Nature (Organic, Conventional), and By Region – Global and Regional Industry Overview, Market Intelligence, Comprehensive Analysis, Historical Data, and Forecasts 2025 – 2034
  • Packaged Food Essence Ingredient Market By Product Type (Natural Essences, Synthetic Essences, Nature-Identical Essences, Essential Oils, Flavor Concentrates, Aromatic Extracts, and Others), By Form (Liquid, Powder, Paste, Emulsion), By Flavor Profile (Fruit Flavors, Vanilla Flavors, Chocolate Flavors, Nut Flavors, Spice Flavors, Herbal Flavors, Savory Flavors, Others), By Application (Bakery and Confectionery, Beverages, Dairy Products, Snacks and Savory Products, Frozen Foods, Ready-to-Eat Meals, Dietary Supplements), By End-User (Food Manufacturers, Beverage Producers, Bakery Chains, Confectionery Companies, Nutraceutical Companies, Restaurant Chains), and By Region – Global and Regional Industry Overview, Market Intelligence, Comprehensive Analysis, Historical Data, and Forecasts 2025 – 2034
  • Gluten Free Biscuits Market By Product Type (Sweet Biscuits, Savory Biscuits, Cookies, Crackers, Digestive Biscuits, and Others), By Technology (Rice Flour Based, Almond Flour Based, Coconut Flour Based, Oat Flour Based, Multi-Grain Blends, and Others), By Application (Direct Consumption, Bakery Products, Food Service, Retail Sales, Gift Packaging, Institutional Catering), By End-User (Celiac Disease Patients, Health-Conscious Consumers, Fitness Enthusiasts, Diabetic Individuals, Children, General Population), and By Region – Global and Regional Industry Overview, Market Intelligence, Comprehensive Analysis, Historical Data, and Forecasts 2025 – 2034
  • Luo Han Guo Market By Product Form (Dried Fruit, Powder, Extract, Liquid Concentrate, Granules, and Others), By Application (Food and Beverages, Pharmaceuticals, Dietary Supplements, Personal Care Products, Traditional Medicine, Bakery and Confectionery), By Distribution Channel (Supermarkets and Hypermarkets, Specialty Stores, Online Retail, Pharmacies, Health Food Stores, Direct Sales), By End-User (Food Manufacturers, Beverage Companies, Pharmaceutical Companies, Cosmetic Manufacturers, Individual Consumers, Healthcare Institutions), and By Region – Global and Regional Industry Overview, Market Intelligence, Comprehensive Analysis, Historical Data, and Forecasts 2025 – 2034
  • Beverage Essence Ingredient Market By Beverage Type (Alcoholic, Non-alcoholic), By Flavor Type (Chocolate and Browns, Dairy, Herbs & Botanicals, Fruits & Vegetables, and Others), By Ingredients (Flavoring Agents, Flavoring Carriers, Flavor Enhancers, and Others), By Form (Dry, Liquid), By Origin (Artificial, Natural), and By Region – Global and Regional Industry Overview, Market Intelligence, Comprehensive Analysis, Historical Data, and Forecasts 2025 – 2034
  • Coconut Syrup Market By Type (Organic, Conventional), By Application (Sweetening, Texturizing, Flavoring, Preservative), By End-User (Bakery Beverages, Dietary Supplements, Pharmaceuticals, Confectionery), By Distribution Channel (Direct Sales, Indirect Sales), and By Region – Global and Regional Industry Overview, Market Intelligence, Comprehensive Analysis, Historical Data, and Forecasts 2025 – 2034
  • Brown Sugar Syrup Market By Type (Dark, Light, Regular), By Form (Powdered Brown Sugar, Granules Brown Sugar, Brown Sugar Syrup, Brown Sugar Cubes), By Application (Bakery Products, Beverages, Dairy Products, Confectionery Products, Medicinal Products), By End-User (Hotels, Restaurants, Residential, Café, Pharmaceutical Industry, Cosmetic Industry), By Distribution Channel (Retail, Food & Beverages, Healthcare, Automotive, and Others), and By Region – Global and Regional Industry Overview, Market Intelligence, Comprehensive Analysis, Historical Data, and Forecasts 2025 – 2034
  • Packaged Food Color Market By Type (Natural, Synthetic, Nature-identical), By Source (Plants & Animals, Microorganisms, Minerals & Chemicals), By Form (Liquid, Powder, Gel), By Solubility (Dyes, Lakes), By Application (Food Products, Beverages), and By Region – Global and Regional Industry Overview, Market Intelligence, Comprehensive Analysis, Historical Data, and Forecasts 2025 – 2034
  • Quick Service Restaurant Market By Type (Independent and Chain), By Cuisine (American, Chinese, Italian, Mexican, Japanese, Turkish & Lebanese and Others), By Service (Eat-in, Takeaway, Drive-Through and Home Delivery), and By Region – Global and Regional Industry Overview, Market Intelligence, Comprehensive Analysis, Historical Data, and Forecasts 2025 – 2034
  • Fortified Cereals Market By Cereal Type (Wheat, Rice, Barley, Oat, Corn, and Others), By Nutrient Type (Minerals, Vitamins), By Distribution Channel (Online, Offline), and By Region – Global and Regional Industry Overview, Market Intelligence, Comprehensive Analysis, Historical Data, and Forecasts 2025 – 2034
  • Dairy-free Yogurt Market By Product Type (Soy, Coconut, Rice, Almonds, and Others), By Packaging Type (Tubs, Pouches), By Category (Conventional, Organic), By Distribution Channel (Store-Based, Non-Store-Based), and By Region – Global and Regional Industry Overview, Market Intelligence, Comprehensive Analysis, Historical Data, and Forecasts 2025 – 2034
  • Ground Chicory Market By Type (Chicory Flour, Chicory Root), By Application (Food, Beverage, Pharmaceutical, and Nutraceutical), and By Region – Global and Regional Industry Overview, Market Intelligence, Comprehensive Analysis, Historical Data, and Forecasts 2025 – 2034
  • Organic Milk Thistle Market By Form (Powder Form, Liquid Extracts, Capsules & Tablets, and Others), By Application (Cosmetics, Nutraceuticals, Pharmaceuticals, and Others), and By Region – Global and Regional Industry Overview, Market Intelligence, Comprehensive Analysis, Historical Data, and Forecasts 2025 – 2034
  • Chicory Ingredients Market By Product Type (Inulin, Oligofructose, Chicory Flour, Roasted Chicory), By Form (Powder, Liquid), By Application (Food and Beverages, Dietary Supplements, Pharmaceuticals, Animal Feed, and Others), By Distribution Channel (Online Retail, Supermarkets/Hypermarkets, Specialty Stores, and Others), and By Region – Global and Regional Industry Overview, Market Intelligence, Comprehensive Analysis, Historical Data, and Forecasts 2025 – 2034

About Zion Market Research:

Zion Market Research is a leading market research organization offering industry expertise and scrupulous consulting services to clients for their business development. The reports and services offered by Zion Market Research are used by prestigious academic institutions, start-ups, and companies globally to measure and understand the changing international and regional business backgrounds.

Our clients’/customers’ conviction in our solutions and services has pushed us to always deliver the best. Our advanced research solutions have helped them in making appropriate decision-making and providing guidance for strategies to expand their business.

Contact Us:

Zion Market Research

USA/Canada Toll Free:  1 (855) 465-4651 | Newark: 1 (302) 444-0166

UK: +44 2034 894158

India: +91 7768 006 007 | +91 7768 006 008

Email: sales@zionmarketresearch.com | Web: https://www.zionmarketresearch.com/

Follow Us on – LinkedIn | X | Facebook | Pinterest | YouTube

Visit Our Blog at – https://www.techicy.com/


Source link

26 11, 2025

Can BNBUSD Reach $900 in November 2025? A Technical and Market Analysis

By |2025-11-26T21:34:02+02:00November 26, 2025|Crypto News, News|0 Comments

As BNBUSD hovers around $843.97, down by 2.37% today, many are questioning whether it can climb to $900 in the near term. With a volatile crypto market, it’s crucial to consider the data and explore the technical indicators that could point to its next move.

Current Price and Market Context

BNBUSD is currently priced at $843.97, experiencing a dip of 2.37% or $20.50 today. Its market cap stands at an impressive $125 billion. Despite today’s drop, it has seen a year-to-date increase of 39.2%. The daily trading volume of 1.81 billion contrasts with its average volume of 3.89 billion, reflecting a relative volume of 0.52. This suggests reduced trading activity, which could indicate either consolidation or indecision in the market.

Technical Indicators and Sentiment

Technical indicators are mixed for BNBUSD. The Relative Strength Index (RSI) is at 36.36, indicating that the asset is approaching oversold conditions. Meanwhile, the MACD is at -54.53, with a histogram difference of -9.43, showing bearish momentum. The Average Directional Index (ADX) at 39.87 suggests a strong trend, albeit a downward one. Bollinger Bands show a lower threshold at $802.15, and the CCI of -109.61 confirms an oversold sentiment. These indicators highlight potential for a reversal, but caution is advised given the strong downtrend.

Price Forecasts and Predictions

Forecasts provided by Meyka AI anticipate BNBUSD reaching $1019.66 within a month, which offers a bullish outlook. However, the yearly forecast drops to $645.15, emphasizing long-term bearish evaluations possibly due to macroeconomic factors or regulatory concerns. The five-year forecast brightens again at $1027.19, aligning with a potential recovery or growth scenario.

News and Market Influences

Recent news regarding the BNB Chain’s transition from Ethereum underscores its expanding ecosystem and potential utility gains. Yet, global economic narratives, such as recent EU regulatory approvals, remind investors of the interconnected nature of crypto markets with global policy shifts. These elements could either bolster or hinder BNBUSD’s progress depending on regulatory developments and technological advancements.

Final Thoughts

While the technical indicators suggest a possible short-term reversal, forecasts vary significantly, depicting both potential upsides and longer-term risks. As the market remains unpredictable, keep an eye on sentiment and macro factors impacting the crypto sphere. “Forecasts can change due to macroeconomic shifts, regulations, or unexpected events affecting the crypto market.”

FAQs

What is the current price of BNBUSD?

The current price of BNBUSD is $843.97, experiencing a decrease of 2.37% today from its previous close of $864.471. Check the latest updates on our BNBUSD page.

What are the key technical indicators for BNBUSD?

Technical indicators show an RSI at 36.36, MACD at -54.53, and an ADX indicating a strong trend at 39.87. The CCI suggests oversold conditions at -109.61, providing mixed signals.

What are the forecasted price targets for BNBUSD?

Monthly forecasts suggest a target of $1019.66, while the longer-term five-year forecast projects $1027.19. Conversely, the yearly outlook drops to $645.15 due to potential macroeconomic impacts.

How does market volume affect BNBUSD’s price?

Current trading volume is 1.81 billion, less than the average of 3.89 billion, indicating reduced market activity. This could signal consolidation phases or indecision affecting price stability.

How do recent news events impact BNBUSD?

BNB Chain’s ecosystem developments influence its value positively, whereas global regulatory actions can lead to fluctuations dependent on policy impacts and market sentiment changes.

Disclaimer:


Cryptocurrency markets are highly volatile. This content is for informational purposes only.
The Forecast Prediction Model is provided for informational purposes only and should not be considered financial advice.
Meyka AI PTY LTD provides market data and sentiment analysis, not financial advice.
Always do your own research and consider consulting a licensed financial advisor before making investment decisions.

Source link

26 11, 2025

BI DeFi Announces New Web3 Yield Platform Update Following Reports of a Major $15B Bitcoin Security Breach

By |2025-11-26T20:17:08+02:00November 26, 2025|News, NFT News|0 Comments


London, UK, Nov. 26, 2025 (GLOBE NEWSWIRE) — BI DeFi has issued a timely announcement in response to widespread reports claiming that a U.S. quantum research team may have breached Bitcoin wallets belonging to several major institutions — potentially affecting more than $15 billion in crypto assets.

Although the reports remain unverified, the global crypto market reacted instantly. Bitcoin (BTC), Ethereum (ETH), and Ripple (XRP) all experienced sharp price swings, fueling renewed concerns about digital asset security and the resilience of current encryption standards.

As fear and uncertainty grow, BI DeFi is officially launching a new upgrade to its Web3 yield platform , aimed at providing stable, automated, and beginner-friendly earning tools for users seeking predictable income during market turbulence.

BI DeFi Announces Its Latest Web3 Earning Platform Upgrade

BI DeFi confirmed today that the company has released a new version of its automated digital asset yield system , now available through its mobile application. This upgrade enhances security layers, simplifies asset management, and improves daily yield tracking — making it easier for both new and experienced users to earn steady digital rewards without engaging in high-risk trading.

BI DeFi offers new users a free introductory contract worth $17, with daily yields of $0.60.

A BI DeFi spokesperson stated:

“With global concerns around crypto security rising, we believe users deserve a safe, transparent, and stable way to benefit from digital assets. Our new platform upgrade focuses on simplicity, regulatory compliance, and long-term sustainability.”

Key Advantages of BI DeFi’s Newly Updated Platform

Fully Compliant and Transparent

BI DeFi maintains open, auditable systems to build long-term user trust.

Strengthened Security Architecture

The latest update includes enhanced multi-layer protection using offline cold storage, McAfee® infrastructure, and Cloudflare® network defence.

 Supports Leading Cryptocurrencies

BTC, ETH, XRP, SOL, DOGE, USDT, LTC, USDC, and others are fully supported for deposits and settlements.

 Automated Daily Earnings

Users receive stable, predictable daily yields directly into their accounts — ideal for investors seeking consistent passive income in uncertain markets.

 Sustainable Green Energy Operations

BI DeFi’s digital infrastructure is powered by clean and renewable energy sources across multiple regions.

 Partner & Affiliate Rewards

Users can earn significant long-term commissions, with rewards reaching up to $50,000 for top referrers.

How to Start Earning With BI DeFi’s New Platform Upgrade

  1. Register
    Sign up on the official website and instantly receive a $17 welcome bonus .
  2. Select a Plan
    Choose a yield plan suited to your financial needs.
  3. Start Earning Automatically
    Earnings are credited every 24 hours. Your principal is fully released once the plan matures.

Popular BI DeFi Yield Plans

  • $100 • 2 Days • Daily Yield: $4 • Total: $108
  • $500 • 6 Days • Daily Yield: $6.5 • Total: $539
  • $1,000 • 10 Days • Daily Yield: $13.3 • Total: $1,133
  • $5,000 • 20 Days • Daily Yield: $73.5 • Total: $6,470
  • $10,000 • 30 Days • Daily Yield: $161 • Total: $14,830

(Click here to download the BI DeFi application)

About BI DeFi

BI DeFi is a digital asset yield platform committed to a green, smart, open, and sustainable Web3 ecosystem. With over 2 million users across 180+ countries , the company operates renewable-energy-powered data facilities in the United States, United Kingdom, Australia, Canada, Brazil, Kazakhstan, and more.

The company’s newly upgraded platform allows users to monitor daily earnings, manage yield plans, and access support directly through the mobile app — offering a simplified and accessible gateway into Web3 earning systems.

Disclaimer: The information provided in this press release does not constitute an investment solicitation, nor does it constitute investment advice, financial advice, or trading recommendations. It is strongly recommended that you perform due diligence before investing or trading in cryptocurrencies and securities, including consulting a professional financial advisor.

Primary Logo


Source link

26 11, 2025

Gold (XAU/USD) 
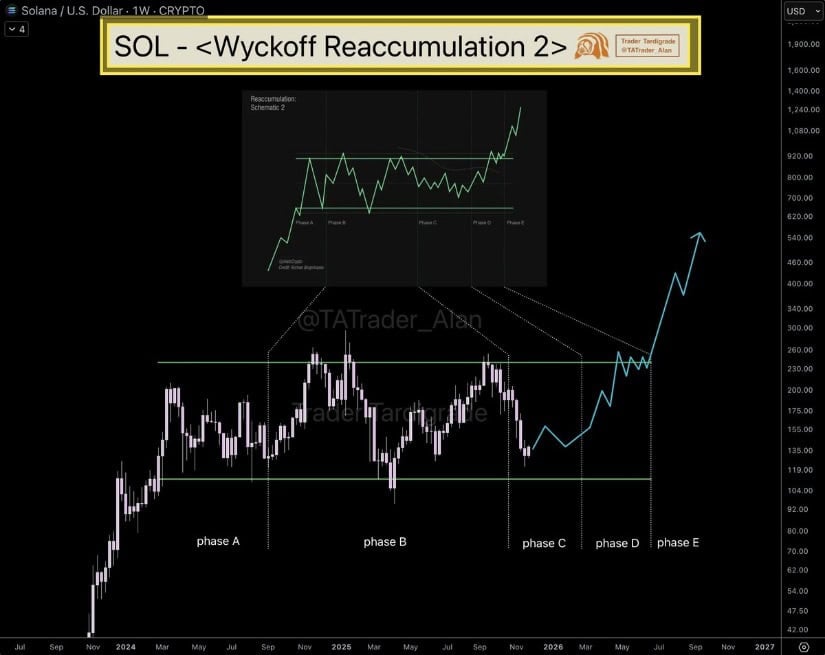
Price Forecast: Bull Pennant Tightens – $4,245 Breakout Key

By |2025-11-26T20:11:03+02:00November 26, 2025|Forex News, News|0 Comments


Resistance Cluster

The daily high respected the long-term rising top channel line (blue) that has repeatedly capped moves. Just overhead, a separate downtrend line intersects a more recent top channel line (black), creating a tight resistance band that further defines the upper pennant boundary. It looks likely that further advances in the short-term may be capped around $4,185, the intersection of the two lines.

20-Day and Deeper Support

The 20-day average at $4,057 has begun turning higher after multiple failed attempts to break below it. Yesterday’s $4,040 low sparked a six-day breakout with a strong close near highs. The 20-day is nearing convergence with the internal uptrend line that defines near-term dynamic support and the lower boundary of the pennant; failure there directs focus to the rising 50-day average at $3,999, untested since the August rally began.

Pennant Breakout Levels

An upside pennant breakout requires a sustained advance above the recent lower swing high at $4,245. Repeated tests of the upper downtrend line that produce a lower swing high would instead lower the bullish trigger level. But that hasn’t happened yet.

Apex Decision Imminent

Gold is rapidly approaching the pennant apex, forcing expanded volatility soon. A downside break first shows on a drop below Monday’s $4,040 low, with confirmation beneath Friday’s $4,022 low. Momentum on any breakdown would remain limited as long as the 50-day average acts as dynamic support.

Outlook

The bull pennant is coiling into its apex with resistance directly overhead and the 20-day/50-day complex below. A decisive push above $4,245 validates continuation higher; failure to clear the upper trend lines keeps risk of a downside break toward $4,040–$4,022, then the 50-day near $3,999. Until a clean directional trigger fires, expect continued tight range trading.

For a look at all of today’s economic events, check out our economic calendar.


Source link

26 11, 2025

USDJPY Forecast: Yen Drops 10% as Traders Brace for CPI, Intervention Risk

By |2025-11-26T19:49:14+02:00November 26, 2025|Forex News, News|0 Comments

During Wednesday’s European session, USDJPY recovered earlier losses and traded back toward 156.60, extending a trend that’s seen…


Register now to be able to add articles to your reading list.

” aria-hidden=”true”>

Quick overview

  • USDJPY has recovered to around 156.60, despite the Yen being the weakest G8 currency.
  • The Bank of Japan is hinting at a possible interest rate hike, but the Yen continues to decline.
  • The Yen has dropped nearly 5% since early October and over 10% since US tariff announcements.
  • US economic data remains mixed, yet the Dollar is supported by the Yen’s weakness.

During Wednesday’s European session, USDJPY recovered earlier losses and traded back toward 156.60, extending a trend that’s seen the Yen post the weakest performance among G8 currencies. Even with the Bank of Japan hinting at a possible rate hike, the currency continues to slide, keeping the Dollar supported despite softer US economic signals.

BoJ Signals a Hike, But Yen Doesn’t Respond

A Reuters report this week suggested the BoJ is preparing markets for a potential interest-rate increase as early as next month. Yet the Yen hasn’t strengthened. Policymakers remain concerned that a fragile Yen could add stress to households and businesses, limiting the BoJ’s ability to tighten policy aggressively.

The decline has been steep: the Yen has dropped nearly 5% since Prime Minister Sanae Takaichi took office in early October, and more than 10% since US tariff announcements earlier this year.

Officials have openly warned that currency intervention is “on the table,” and with US markets thinned by the Thanksgiving holiday, traders see this week as a window where authorities could step in. Japan’s Tokyo CPI report, due Thursday, will also shape expectations for the BoJ’s December stance, with forecasts pointing to cooling inflation.

US Data Keeps the Dollar Supported

Across the Pacific, US economic data has been mixed. Retail Sales softened, producer prices steadied, and consumer confidence fell. Meanwhile, dovish comments from Federal Reserve officials Christopher Waller and John Williams fueled expectations of a December rate cut. Yet even with rate-cut bets rising, the Yen’s weakness has helped the Dollar maintain an upward bias.

USD/JPY Technical Outlook

USDJPY Forecast: Yen Drops 10% as Traders Brace for CPI, Intervention Risk
USD/JPY Price Chart – Source: Tradingview

USDJPY is attempting to build momentum after finding support near 155.68, a level that aligns with the rising November trendline. Price has climbed back above the 20-EMA, showing early signs of stabilization, though the pair remains capped below 157.19, a level that sellers defended earlier this week.

The RSI has pushed above 50, pointing to improving sentiment while avoiding any overbought signals. A decisive break above 157.19 would clear the way toward 157.88, followed by a retest of 158.56, a key resistance zone.

If price slips back under 156.00, downside pressure may re-emerge, exposing 155.68 and potentially 154.79 as the next support areas.

Arslan Butt

Lead Markets Analyst – Multi-Asset (FX, Commodities, Crypto)

Arslan Butt serves as the Lead Commodities and Indices Analyst, bringing a wealth of expertise to the field. With an MBA in Behavioral Finance and active progress towards a Ph.D., Arslan possesses a deep understanding of market dynamics.

His professional journey includes a significant role as a senior analyst at a leading brokerage firm, complementing his extensive experience as a market analyst and day trader. Adept in educating others, Arslan has a commendable track record as an instructor and public speaker.

His incisive analyses, particularly within the realms of cryptocurrency and forex markets, are showcased across esteemed financial publications such as ForexCrunch, InsideBitcoins, and EconomyWatch, solidifying his reputation in the financial community.

Related Articles


Source link

26 11, 2025

10 Best Collagen Powders, According to Doctors and Dietitians

By |2025-11-26T19:40:09+02:00November 26, 2025|Dietary Supplements News, News|0 Comments


✔️ Consider collagen source: Some packaging disclaims the type of collagen within, for example, type I or type II. “There are a few different types of collagen, but the primary ones are known as types I, II, and III,” explains Jones. “Some research suggests the benefits of type I and type III collagen supplements are mainly related to muscle growth and support, weight management, beauty, and skin, while type II is best for supporting healthy joints.”

✔️ Look for the words “collagen peptides” or “hydrolyzed collagen”: “Not all collagen is created equal,” says Jones. “This means the collagen is put through a special production process that hydrolyzes the collagen protein into smaller components, called peptides. Peptides are microscopic bundles of amino acids that are easier for the body to absorb–which means you get the most benefits!”

✔️ Know that collagen powders are not plant-based: Collagen powders are derived from animals, and there are currently no vegan or vegetarian-friendly supplements on the market. However, there are plant-based supplements that may help boost the body’s natural collagen production.


Source link

26 11, 2025

ETHUSD Price Prediction: Is a Rebound to $3605 Likely?

By |2025-11-26T19:33:10+02:00November 26, 2025|Crypto News, News|0 Comments

Ethereum (ETHUSD) has experienced a sharp decline, shedding 5.13% to trade at $2801.14. This drop comes amid increased volatility, sparking interest in its short-term price trajectory. As we dissect the numbers and technical indicators, we explore whether Ethereum can rebound to its monthly forecast of $3605.28.

Current Market Performance

Ethereum is currently priced at $2801.14, reflecting a decrease of 5.13% from its previous close at $2952.53. The recent trading session saw ETHUSD dip to a low of $2766.72 before climbing to a high of $2857.19. With a market cap of $351.93 billion and a trading volume of $20.36 billion, Ethereum’s current levels pose questions on its potential recovery.

Technical Analysis: Indicators and Signals

Technical indicators for Ethereum highlight a challenging phase. The RSI stands at 36.55, suggesting it is nearing oversold territory, while the MACD is at -285.64, indicating a bearish sentiment with a strong trend as shown by an ADX of 50.25. Bollinger Bands are narrowing, with the lower band at 2662.11, pointing to a potential support level. However, volatility remains high, as indicated by an ATR of 262.58. Forecasts can change due to macroeconomic shifts, regulations, or unexpected events affecting the crypto market.

Market Forecasts and Future Outlook

Looking ahead, Ethereum’s monthly forecast suggests a potential rise to $3605.28. However, the quarterly and yearly projections of $3457.18 and $3429.94 respectively, emphasize a cautiously optimistic outlook. Long-term predictions by Meyka AI, an AI-powered platform, show Ethereum climbing to $4169.63 in three years and $4912.25 in five years. Current bearish momentum is influenced by broader market trends, but recovery could be on the horizon.

Implications of Recent News

Recent news from Yahoo Finance highlights Ethereum’s fluctuating supply and recent price stagnation. This backdrop aligns with current bearish trends, influenced by wider economic factors. Ethereum’s current supply stands at 120,695,601.134, adding a layer of complexity to its market dynamics. External factors such as regulatory changes could disrupt or bolster Ethereum’s position in the coming months.

Final Thoughts

Ethereum’s recent price drop has raised concerns, but the underlying data suggests potential recovery. While current market indicators are bearish, price forecasts offer hope for a rebound. Traders should remain aware of macroeconomic influences that could rapidly alter these predictions.

FAQs

What is the current ETHUSD price?

The current price of ETHUSD is $2801.14, reflecting a 5.13% decline from its previous close of $2952.53.
Explore more on ETHUSD.

What do the technical indicators suggest for Ethereum?

Technical indicators show Ethereum in a bearish trend with an RSI of 36.55 and a MACD of -285.64, indicating possible oversold conditions soon. An ADX of 50.25 confirms a strong trend.

What are Ethereum’s price predictions for the near future?

Ethereum’s monthly forecast targets a price of $3605.28, while longer-term projections are optimistic, with potential to reach $4169.63 in three years.

How does recent news affect Ethereum’s outlook?

Recent news indicates fluctuating supply and a stable price range, influencing the market’s bearish mood. Regulatory changes may impact Ethereum’s future trends.

Why has ETHUSD recently declined?

The decline in ETHUSD to $2801.14, down 5.13%, is attributed to market volatility and broader economic influences reflected in decreased trading volumes.

Disclaimer:


Cryptocurrency markets are highly volatile. This content is for informational purposes only.
The Forecast Prediction Model is provided for informational purposes only and should not be considered financial advice.
Meyka AI PTY LTD provides market data and sentiment analysis, not financial advice.
Always do your own research and consider consulting a licensed financial advisor before making investment decisions.

Source link

Go to Top