About Editorial team of BIPNs

Main team of content of bipns.com. Any type of content should be approved by us.
2 03, 2026

EUR/USD Forex Forecast for March 2026

By |2026-03-02T19:04:03+02:00March 2, 2026|Forex News, News|0 Comments

The Euro has been very choppy during the month of February as traders are trying to figure out where the two central banks are heading at the moment.

EURUSD

The Euro has been very choppy during the month of February as traders continue to try to sort out what the outlook is going to be for the Federal Reserve and the US dollar. Quite frankly, this pair will probably move on what goes on in Washington DC rather than anything on the continent of Europe, at least as far as I can see looking forward.

The Federal Reserve is thought to be potentially cutting rates 2 times later this year, but the reality is that the United States economy—not only the inflationary numbers but also the labor numbers—have made it not as certain as it once was. This has been the story for 2 years now where the market starts to try to price in the idea of the Federal Reserve cutting aggressively and the reality is something quite different.

Resistance and Monetary Policy

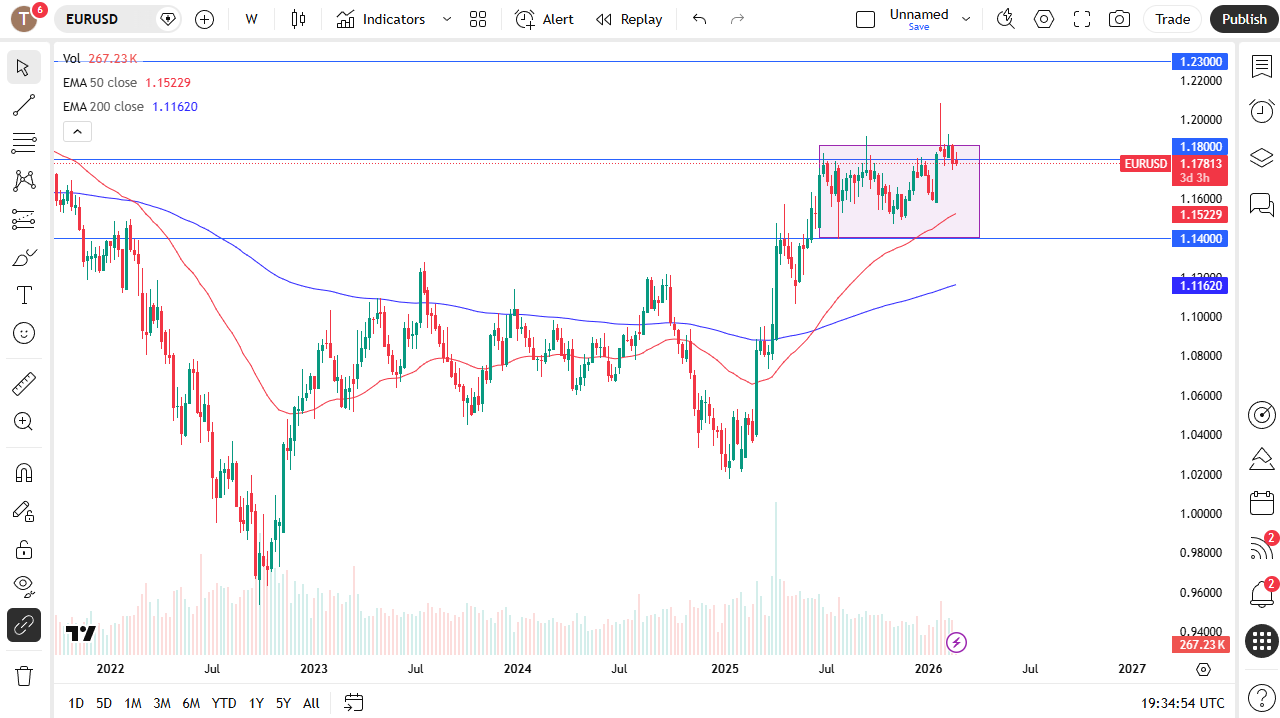
This is not to say that the US central bank is going to start hiking rates, but the reality is that it is not as dovish as a lot of people would have thought. With that being the case, I think you have to look at this as a pair that most likely will be choppy in the month of March as well. If we do rally, the 1.23 level is a major resistance barrier going back several years and it is at least in theory the measured move of the consolidation area that we have been in since last summer.

Quite frankly, this is all about the US dollar as I mentioned previously and I really don’t have an opinion on the Euro because we know that the European Central Bank is likely to be flat for the rest of the year as far as its monetary policy is concerned and economic growth, or lack of growth in the European Union depending on the country that you are talking about, is a bit of a mixed picture.

Ultimately, there are a lot of geopolitical concerns that could work in the favor of the US dollar so I believe that unless the Euro can break the 1.20 level during the month of March it is likely to remain a very tight market that you will be looking for fading signs of exhaustion.

Source link

2 03, 2026

XAG/USD Soars Near $95.00 As Soaring Safe-Haven Demand Meets Middle East Crisis

By |2026-03-02T15:12:57+02:00March 2, 2026|Forex News, News|0 Comments


Silver Price Forecast: XAG/USD Soars Near $95.00 As Soaring Safe-Haven Demand Meets Middle East Crisis


Source link

2 03, 2026

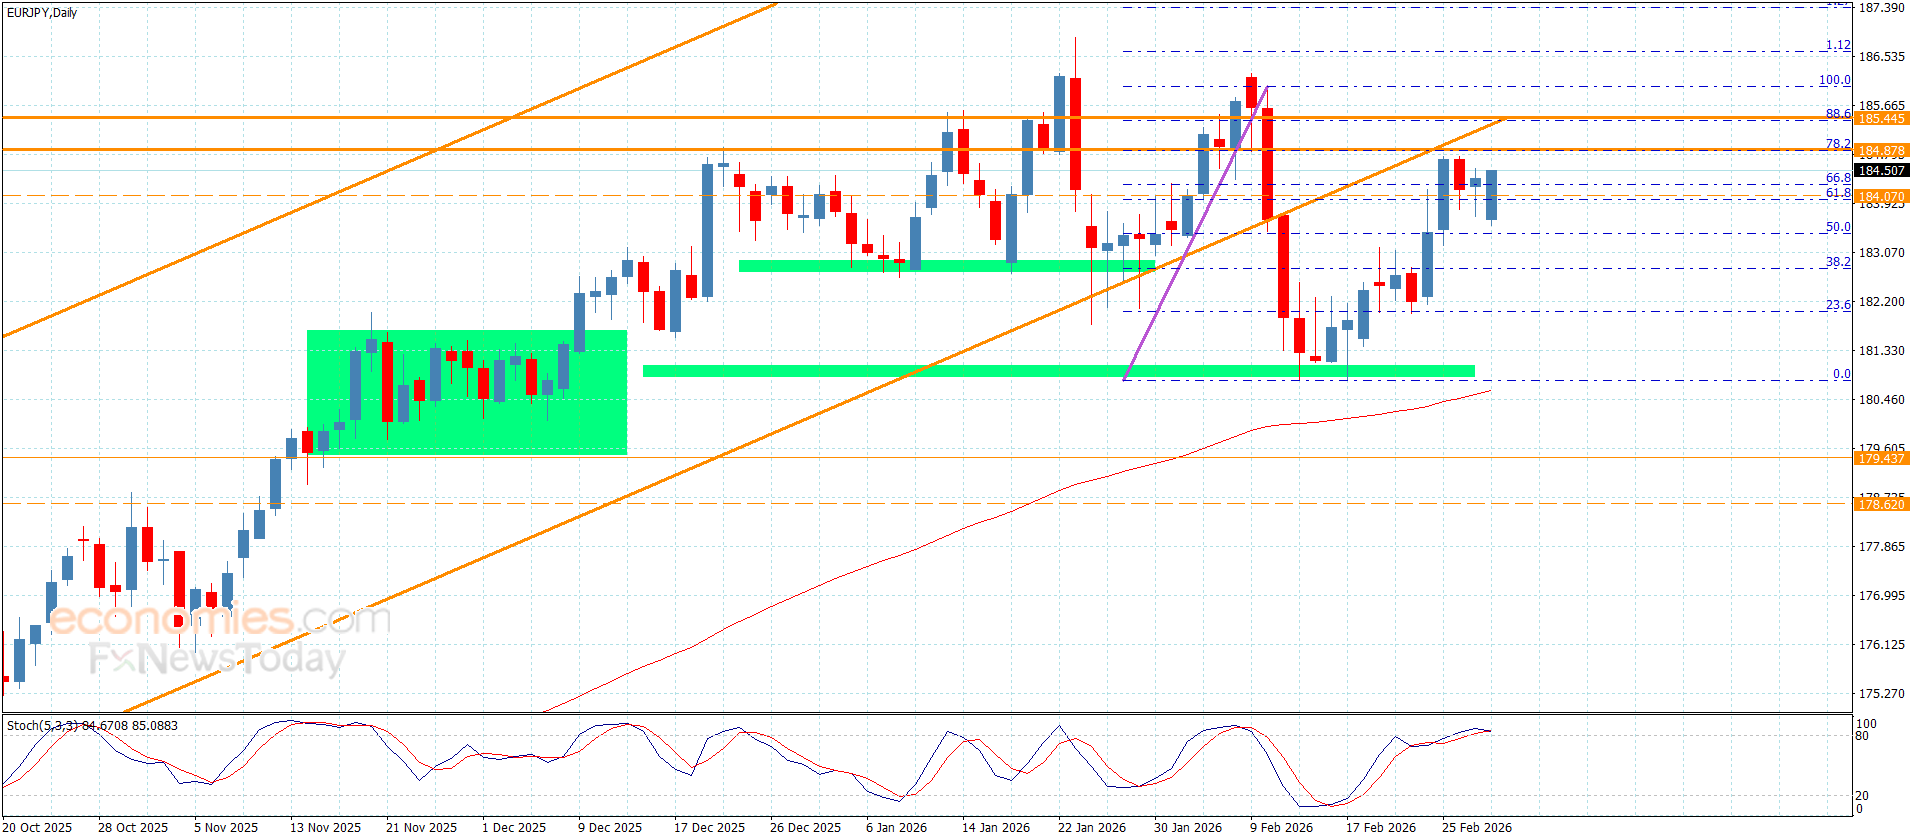
The EURJPY begins with strong positivity– Forecast today – 2-3-2026

By |2026-03-02T15:03:01+02:00March 2, 2026|Forex News, News|0 Comments

The GBPJPY pair ended the last negative attack by reaching 209.15 target, forming an important extra support, which pushes it to form strong bullish rebound, to approach the initial barrier at 210.45.


Noticing stochastic attempt to provide bullish momentum by its rally above 50 level, and the price attempt to settle above the moving average 55 makes us prefer the bullish attempts again, to settle above 210.65 to begin targeting positive stations by its rally above 211.25, attempting to press on 212.05 resistance again.


The expected trading range for today is between 209.80 and 211.25


Trend forecast: Bullish


Source link

2 03, 2026

Coffee price is fluctuating above the support – Forecast today – 2-3-2026

By |2026-03-02T11:12:15+02:00March 2, 2026|Forex News, News|0 Comments


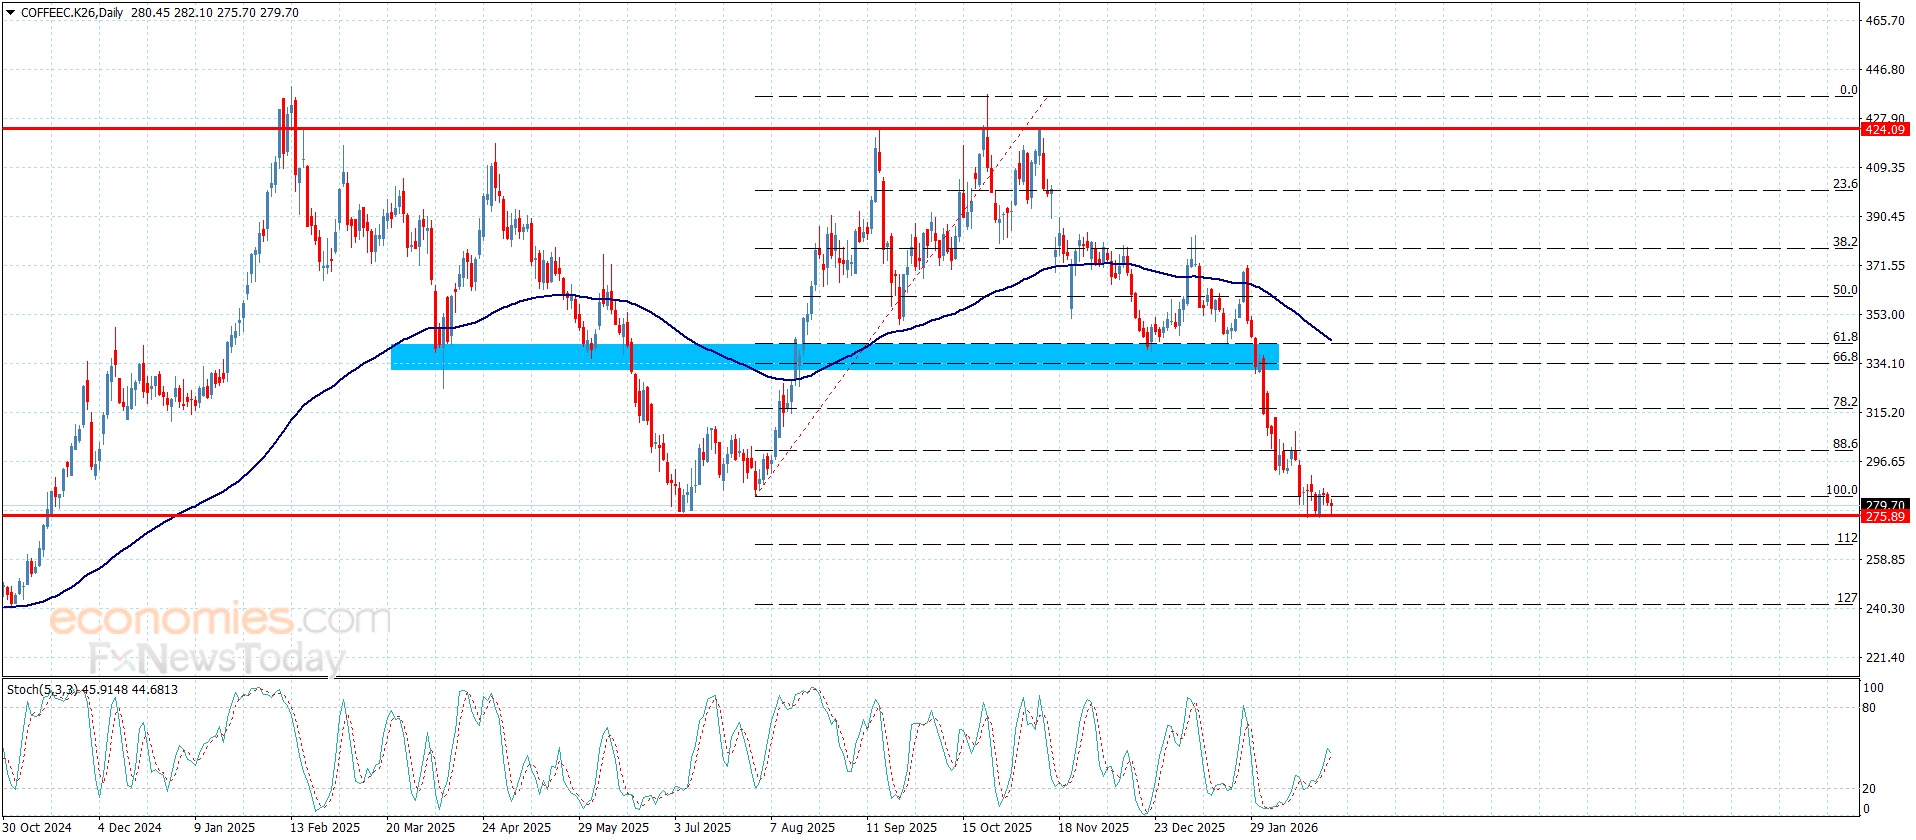
Coffee price kept its stability above 275.80 support until this moment, attempting to find a chance to reduce the losses, farming sideways waves by its fluctuation near 280.00 level.


The price needs new bullish momentum, reinforcing the chances of beginning recovering the losses, to expect its rally towards 293.50 directly, to press on the barrier at 301.00, while the decline below the current support will confirm the continuation of the negativity in the upcoming trading, expecting the next negative target at 264.80 level.


The expected trading range for today is between 275.00 and 293.50


Trend forecast: Bullish


Source link

2 03, 2026

Hovers around 184.00 above nine-day EMA

By |2026-03-02T11:02:26+02:00March 2, 2026|Forex News, News|0 Comments

EUR/JPY pares daily losses but remains in the negative territory, trading around 184.00 during the early European hours on Monday. The technical analysis of the daily chart shows a consolidation phase as the currency cross remains within the horizontal channel.

The 14-day Relative Strength Index (RSI) at 55.38 sits above its midline and confirms positive momentum rather than overstretched conditions, aligning with scope for further upside while the moving average zone continues to underpin the pair.

The near-term bias stays mildly bullish as spot holds above the clustered nine- and 50-day Exponential Moving Averages (EMAs) around 183.70–183.10, keeping the broader uptrend intact despite recent consolidation.

Price has recovered from last week’s dip toward 181.00 and now trades comfortably above the latest swing area, suggesting buyers retain control on pullbacks. The EUR/JPY cross may target the upper boundary of the horizontal channel around 185.90, followed by the all-time high of 186.88, reached on January 23.

On the downside, primary support lies at the nine-day EMA at 183.69, followed by the 50-day EMA at 183.07. Further declines below the averages would weaken the momentum and expose a two-month low at 180.81, recorded on February 12, aligned with the lower horizontal channel boundary around 180.50. Further declines would cause the emergence of the bearish bias and put downward pressure on the EUR/JPY cross to navigate the region around the four-month low at 175.70.

EUR/JPY: Daily Chart

(The technical analysis of this story was written with the help of an AI tool.)

Euro Price Today

The table below shows the percentage change of Euro (EUR) against listed major currencies today. Euro was the weakest against the US Dollar.

USD EUR GBP JPY CAD AUD NZD CHF
USD 0.77% 0.81% 0.53% 0.14% 0.77% 0.86% 0.36%
EUR -0.77% 0.05% -0.26% -0.62% 0.00% 0.10% -0.40%
GBP -0.81% -0.05% -0.31% -0.66% -0.04% 0.05% -0.45%
JPY -0.53% 0.26% 0.31% -0.37% 0.25% 0.34% -0.16%
CAD -0.14% 0.62% 0.66% 0.37% 0.62% 0.71% 0.22%
AUD -0.77% -0.00% 0.04% -0.25% -0.62% 0.10% -0.40%
NZD -0.86% -0.10% -0.05% -0.34% -0.71% -0.10% -0.50%
CHF -0.36% 0.40% 0.45% 0.16% -0.22% 0.40% 0.50%

The heat map shows percentage changes of major currencies against each other. The base currency is picked from the left column, while the quote currency is picked from the top row. For example, if you pick the Euro from the left column and move along the horizontal line to the US Dollar, the percentage change displayed in the box will represent EUR (base)/USD (quote).

Source link

2 03, 2026

XAU/USD looks further north as Iran war boosts haven demand

By |2026-03-02T07:11:00+02:00March 2, 2026|Forex News, News|0 Comments


Gold is taking a breather after the initial run to over one-month highs near $5,400, kicking off the new week with a bang.

A global flight to safety theme, following the US-Israel joint attacks on Iran over the weekend, bolstered the demand for the traditional store of value, Gold.

Gold thrives on risk aversion and global uncertainty

Gold buyers resort to cashing in on their long positions, fuelling a modest retracement in the prices heading toward the European opening bells.

However, the bullish potential for Gold remains intact in the near-term amid continued geopolitical escalation in the Middle East.

The Times of Israel reported that the Israel Defence Force (IDF) struck Hezbollah targets in Beirut and across Lebanon in response to rocket fire.

Meanwhile, the UK Defense Ministry stated that British forces responded to a suspected drone strike at its military base in Cyprus.

Additionally, US President Donald Trump suggested the conflict could last for four more weeks, saying that attacks would continue until US objectives were met.

Gold also continues to draw support from surging Oil prices, caused by supply disruption fears, which could spike inflation and send the global economy into a tailspin once again. The bright metal is widely known as a hedge against inflation.

Several oil shipments were not permitted by Iran’s Islamic Revolutionary Guard Corps (IRGC) Navy to pass through the Strait of Hormuz.

“While Iran has yet to officially confirm that the vital waterway has been blocked, marine tracking sites showed tankers piling up on either side of the strait wary of attack or maybe unable to get insurance for the voyage,” according to the Guardian.

Looking ahead, all eyes remain on the Middle East tensions, while top-tier US economic data will also be awaited for fresh trading cues on Gold. However, geopolitical developments will continue to lead the sentiment.

US Defense Secretary Pete Hegseth is scheduled to hold a press conference at 13 GMT, according to the Defense Department on X.

Gold price technical analysis: Daily chart

The near-term bias is mildly bullish as price holds above the 21-day and 50-day Simple Moving Averages (SMAs), which both rise above the slower 100- and 200-day SMAs and signal an established uptrend. The Relative Strength Index (RSI) at 64.48 stays above the 50 midline, indicating firm but not extreme bullish momentum after cooling from earlier overbought readings. Price trades above the 50.00% Fibonacci retracement at $4,999.94 and the 61.80% retracement at $5,141.05 measured from the $4,401.99 low to the $5,597.89 high, reinforcing the view that recent pullbacks remain corrective within a broader advance.

Initial support aligns with the 21-day SMA near $5,036.64, ahead of the 50.00% retracement at $4,999.94, where a break would expose the 38.20% retracement at $4,858.82. Below that, the area around the rising 50-day SMA at $4,814.84 forms a deeper support zone. On the upside, immediate resistance emerges at the 78.60% retracement at $5,341.96, with a sustained break opening the way toward the prior swing high region near $5,598. A daily close above the 78.60% level would strengthen the bullish bias, while a drop through the 50.00% retracement would shift focus back to the lower supports.

(The technical analysis of this story was written with the help of an AI tool.)

Gold FAQs

Gold has played a key role in human’s history as it has been widely used as a store of value and medium of exchange. Currently, apart from its shine and usage for jewelry, the precious metal is widely seen as a safe-haven asset, meaning that it is considered a good investment during turbulent times. Gold is also widely seen as a hedge against inflation and against depreciating currencies as it doesn’t rely on any specific issuer or government.

Central banks are the biggest Gold holders. In their aim to support their currencies in turbulent times, central banks tend to diversify their reserves and buy Gold to improve the perceived strength of the economy and the currency. High Gold reserves can be a source of trust for a country’s solvency. Central banks added 1,136 tonnes of Gold worth around $70 billion to their reserves in 2022, according to data from the World Gold Council. This is the highest yearly purchase since records began. Central banks from emerging economies such as China, India and Turkey are quickly increasing their Gold reserves.

Gold has an inverse correlation with the US Dollar and US Treasuries, which are both major reserve and safe-haven assets. When the Dollar depreciates, Gold tends to rise, enabling investors and central banks to diversify their assets in turbulent times. Gold is also inversely correlated with risk assets. A rally in the stock market tends to weaken Gold price, while sell-offs in riskier markets tend to favor the precious metal.

The price can move due to a wide range of factors. Geopolitical instability or fears of a deep recession can quickly make Gold price escalate due to its safe-haven status. As a yield-less asset, Gold tends to rise with lower interest rates, while higher cost of money usually weighs down on the yellow metal. Still, most moves depend on how the US Dollar (USD) behaves as the asset is priced in dollars (XAU/USD). A strong Dollar tends to keep the price of Gold controlled, whereas a weaker Dollar is likely to push Gold prices up.


Source link

2 03, 2026

Crucial 1.3500 Barrier Looms Near Moving Averages As Bulls Gain Momentum

By |2026-03-02T07:00:54+02:00March 2, 2026|Forex News, News|0 Comments


GBP/USD Forecast: Crucial 1.3500 Barrier Looms Near Moving Averages As Bulls Gain Momentum


Source link

2 03, 2026

EUR/USD Weekly Forecast 1/03: Inflation and Tensions (Chart)

By |2026-03-02T03:00:15+02:00March 2, 2026|Forex News, News|0 Comments

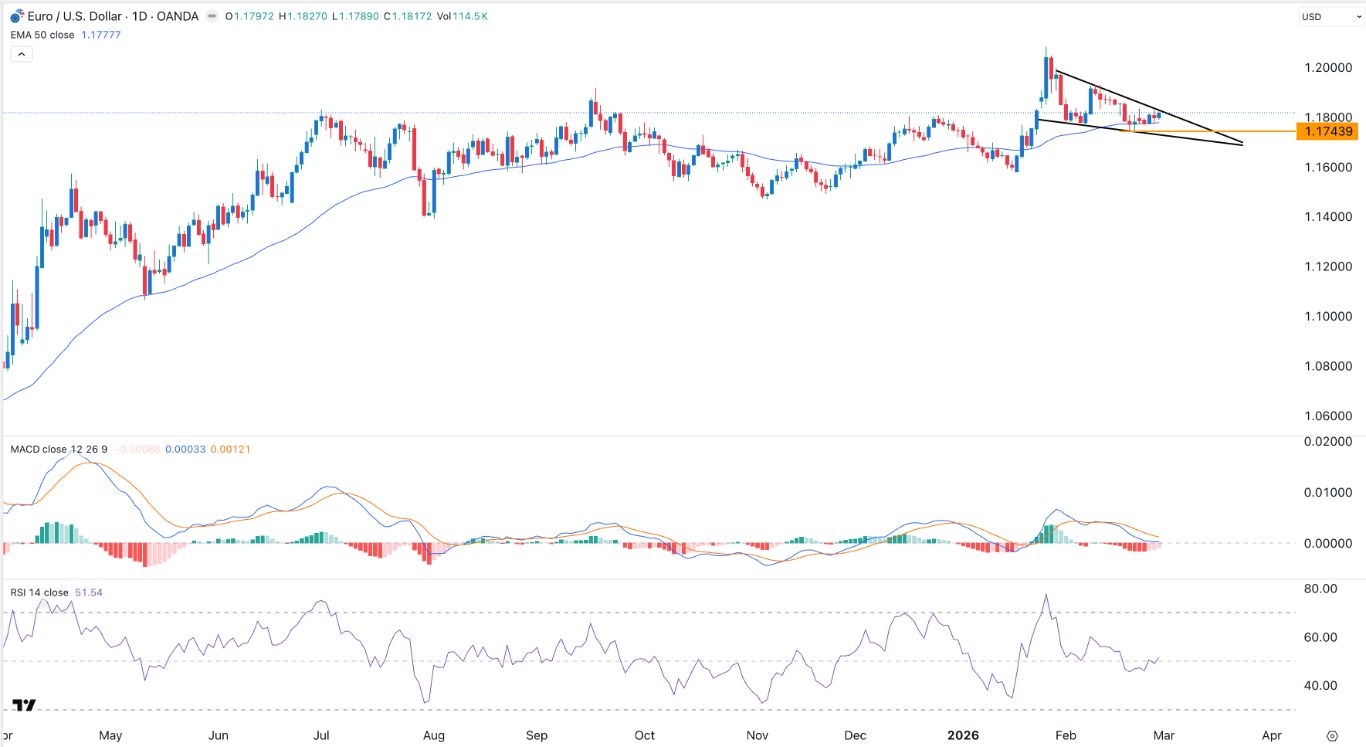
The EUR/USD exchange ended the week in a tight range after the US published a strong inflation report, raising concerns about the Federal Reserve’s next move. The pair was trading at 1.1817, a few points above last week’s low of 1.1745.

The EUR/USD pair remained in a tight range after the US published a higher inflation report. Data released on Friday showed that the Producer Price Index (PPI) jumped from 0.4% in December to 0.5% in January. This increase led to an annual move from 3.3% to 3.6%.

The core PPI inflation report moved from 0.6% to 0.8% on a MoM basis and from 3% to 2.9%. These numbers mean that inflation is still a major concern in the United States. As such, there is a risk that the Federal Reserve may not cut interest rates as soon as analysts were expecting.

US inflation may remain at an elevated level in the coming months now that a new war has started in the Middle East. Israel and Iran bombed key sites in Iran on Saturday, leading to a major retaliation by Iranian forces. The new war will likely lead to higher crude oil prices as oil ships are avoiding the Strait of Hormuz.

The EUR/USD pair also reacted to the latest European inflation report. Data by the German statistics agency showed that the headline Consumer Price Index (CPI) dropped from 2.1% in January to 1.9% in February.

Looking ahead, the US will publish the latest non-farm payrolls data on Friday. These numbers will provide more information on what to expect in the coming meetings. Economists expect the data to show that the unemployment rate remained unchanged at 4.3% in February as the economy added over 60k jobs.

The daily chart shows that the EUR/USD pair was flat on Friday. It was trading at 1.1817, a few points above last week’s low of 1.1743. It has also rebounded above the 50-day Exponential Moving Average (EMA).

At the same time, the pair has formed a falling wedge pattern, which is made up of two descending and converging trendlines. Also, the Relative Strength Index (RSI) and the MACD have pointed upwards.

Therefore, the pair will likely be highly volatile on Monday as investors assess the impact of the ongoing war in Iran and its impact on the market. The key support and resistance levels to watch will be at 1.1700 and 1.2000.

Ready to trade our weekly forecast? We’ve shortlisted the best European brokers in the industry for you.

Crispus Nyaga is a financial analyst, coach, and trader with more than 8 years in the industry. He has worked for leading companies like ATFX, easyMarkets, and OctaFx. Further, he has published widely in platforms like SeekingAlpha, Investing Cube, Capital.com, and Invezz. In his free time, he likes watching golf and spending time with his wife and child.

Source link

1 03, 2026

Silver Price Prediction: Will Geopolitical Chaos Drive XAG/USD to $104 as $100 Target Looms?

By |2026-03-01T23:09:20+02:00March 1, 2026|Forex News, News|0 Comments


Silver is no longer just a “precious metal”, it has become the primary financial barometer for global instability.

•

Register now to be able to add articles to your reading list.

” aria-hidden=”true”>

Quick overview

  • Silver has surged nearly 8% to the $93.80–$94.50 range due to escalating geopolitical tensions in the Middle East.
  • A critical liquidity trap in the COMEX market is causing a disconnect between paper and physical silver, heightening demand.
  • Major banks are revising silver price targets, with some predicting potential prices as high as $300 if supply issues persist.
  • Traders should exercise caution as the market approaches key resistance levels, with volatility expected at the Monday open.

Silver is no longer just a “precious metal”, it has become the primary financial barometer for global instability. As of today, Sunday, March 1, 2026, silver (XAG/USD) is ending the week with an explosive surge, trading in the $93.80–$94.50 range. This nearly 8% single-day gain follows the dramatic escalation of the US-Israel-Iran conflict, specifically the reported strikes on Tehran and the subsequent death of Iran’s Supreme Leader.

With the Strait of Hormuz facing a potential blockade and safe-haven demand hitting fever pitch, the “Silver Squeeze” of 2026 is entering a parabolic phase. When markets reopen on Monday, March 2, traders are bracing for a massive gap-up that could finally push silver into triple-digit territory.

The Fundamental Fire: War, Tariffs, and a 67M Ounce Deficit

The current rally is being supercharged by a “Triple-Engine” catalyst that gold simply cannot match:

  1. The “Epic Fury” Risk Premium

Following the US-Israeli joint military operations (dubbed “Epic Fury” and “Roaring Lion”), geopolitical risk has reached a decade-high. Silver’s reaction, surging 8% compared to gold’s 2%, confirms its status as a “high-beta” safe haven. Investors are fleeing equities and the dollar, rotating into silver as a hedge against a prolonged Middle Eastern conflict.

  1. The COMEX Liquidity Trap

A critical “paper vs. physical” disconnect is emerging. Recent reports of a 159-million-ounce sell order triggering a CME trading halt have raised alarms, as the order far exceeded the registered inventory available for delivery. With March First Notice Day approaching and registered stocks under 60 million ounces, the physical market is tighter than at any point since the 1970s.

  1. The $100 “Institutional Target”

Major banks are rapidly revising their year-end targets. Deutsche Bank recently signaled that the current gold-to-silver ratio of 57 presents a significant upside risk to their $100/oz forecast. Meanwhile, billionaire Eric Sprott has warned that if the physical supply drain continues, a “revaluation shock” could eventually target the $300 mark.

 [[XAG/USD-graph]]

Silver Technical Outlook: The Path to $104.14

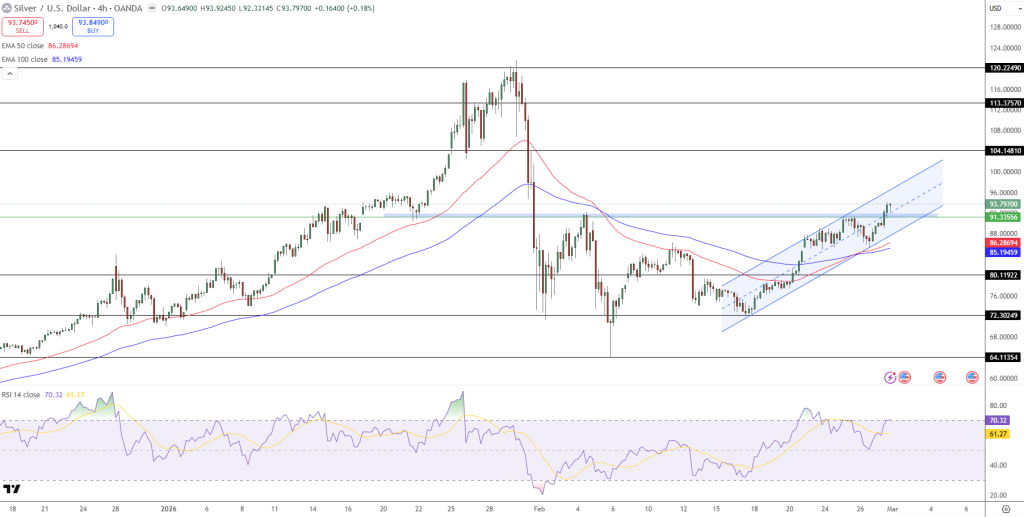
On the 4-hour chart, silver is exhibiting a textbook ascending channel breakout. The metal has decisively reclaimed the $91.33 horizontal resistance, flipping it into a rock-solid support floor.

Silver Price Prediction: Will Geopolitical Chaos Drive XAG/USD to 4 as 0 Target Looms?
Silver Price Chart – Source: Tradingview
  • The Immediate Resistance: $95.00 – $104.14. The $95 level is the final psychological barrier. Once cleared, the channel extension points directly to $104.14 as the next major structural objective.
  • Support Safety Net: $91.33. This is the “Line in the Sand” for the bulls. As long as silver holds above this level on a daily closing basis, the parabolic trend remains intact.
  • Momentum Warning: The RSI is currently hovering near 70. While this indicates extreme bullish strength, it also signals that the market is entering “overbought” territory. Expect high volatility and potential “stop-hunting” wicks near the Monday open.

The Analyst’s Verdict: Watch the Monday Gap

As a professional analyst, I am advising extreme caution for the Monday open. We are likely to see a “Gap and Run” scenario if the headlines from the Middle East continue to deteriorate. However, silver is famous for its “bull traps”, if diplomatic de-escalation signals emerge over the weekend, we could see a rapid “fill the gap” move back toward $91.

Trade Idea: Look for bullish continuation above $95.00 targeting $104.14.
Stop Loss: Place a tight stop below $91.33 to protect against a “buy the rumor, sell the news” reversal.

Arslan Butt

Lead Markets Analyst – Multi-Asset (FX, Commodities, Crypto)

Arslan Butt serves as the Lead Commodities and Indices Analyst, bringing a wealth of expertise to the field. With an MBA in Behavioral Finance and active progress towards a Ph.D., Arslan possesses a deep understanding of market dynamics.

His professional journey includes a significant role as a senior analyst at a leading brokerage firm, complementing his extensive experience as a market analyst and day trader. Adept in educating others, Arslan has a commendable track record as an instructor and public speaker.

His incisive analyses, particularly within the realms of cryptocurrency and forex markets, are showcased across esteemed financial publications such as ForexCrunch, InsideBitcoins, and EconomyWatch, solidifying his reputation in the financial community.

Related Articles


Source link

1 03, 2026

Weekly Forex Forecast – 1st to 6th March 2026 (Charts)

By |2026-03-01T22:59:21+02:00March 1, 2026|Forex News, News|0 Comments

I wrote on the 22nd February that the best trades for the week would be:

  1. Long of the S&P 500 Index following a daily (New York) close above 7,025. This did not set up.
  2. Long of Gold following a daily (New York) close above $5,418.55. This did not set up.
  3. Long with a small position in WTI Crude Oil on short-term bullish price action while New York is open but be quick to take profits once war breaks out or if an agreement is reached. This would have you already in a long trade, possibly taken intraday Friday near the 7-month high price.

A summary of last week’s most important data in the market:

  1. US PPI – this is seen as an indicator for inflation, and this data released on Friday came in much hotter than expected, showing a month-on-month increase of 0.5% while an increase of only 0.3% was expected. This sent US stock markets lower and was a minor hawkish tilt for expectations of the path of rate cuts, but it had little effect on the US Dollar.
  2. US President Trump State of the Union speech – this had little to no effect on the markets.
  3. Australian CPI (inflation) – this also came in a bit hotter than expected, with a month-on-month increase of 0.4% when only 0.2% was expected, which prevented the annualized rate from falling from 3.8%. This helped keep the Aussie a little bit stronger than it would otherwise have been.
  4. Canadian GDP – this was slightly higher than expected, showing a monthly increase of 0.2% while an increase of only 0.1% was expected, although this had no real effect on the market.
  5. US Unemployment Claims – almost exactly as expected.

The only significant effects last week’s economic data had was minor dovish tilt on expected rate cuts by the Fed, and the stronger AUD after the higher inflation data.

The week brought little clarity on tariffs. In any case, markets seem to have calmed down a lot about that issue.

The week was really dominated by speculation over the possibility of an American attack on Iran, with the prediction market Polymarket seeing odds narrowing Friday as the US Ambassador told Americans to leave Israel “today” if they wanted too but still showing only an approximate 30% chance of an attack over the weekend.

Ambassador Huckabee’s warning was worth paying attention to, as a few hours after dawn on Saturday morning saw a joint Israeli / US strike, generating an element of surprise as the opening salvo was expected to be made during hours of darkness.

The initial strike killed several senior Iranian figures, including the Chief of Staff, the Head of the Revolutionary Guards, Ayatollah Khamenei’s major advisor, and the Ayatollah himself, as well as several others. Iran is hitting back with frequent attacks on Israel (damage has been very minimal so far) and on US-allied Gulf states, where the psychological impact has been greater and the air defenses weaker. The USA and Israel are openly calling for regime change in Iran and seem very bullish about the war.

Ayatollah Khamenei has been the Supreme Leader of Iran since 1989 and has been arguably the leading global figurehead of hostility towards the USA and Israel.

It seems clear that this war is going to last for a few days at least, maybe even for a few weeks, and that a surrender by the regime remains unlikely, at least for time being.

Interestingly, there has been no military response yet from any of Iran’s proxies, notably Hezbollah which is positioned on Israel’s northern border and could still add to Israeli damage and logistical issues. It is telling that despite the confirmed death of the Ayatollah, the proxies have still not joined battle, that is a very bullish sign for the USA and Israel.

Yesterday the Iranian navy warned ships not to enter the Gulf of Hormuz, and traffic remains down by about 70%. More than 10% of the world’s Crude Oil passes through this narrow waterway, so if the US does not manage to undo this semi-blockade, Crude Oil markets will likely be under supply pressure unless OPEC agrees to increase production. There are signs OPEC already agreed this with President Trump. The price of WTI Crude Oil rose strongly on Friday and broke the 6-month high price, so many trend traders will already be long here. The price of Gasoline has also risen.

The coming week’s most important data points, in order of likely importance, are:

  1. US Average Hourly Earnings
  2. US Non-Farm Employment Change
  3. US Retail Sales
  4. US ISM Services PMI
  5. US ISM Manufacturing PMI
  6. Australian GDP
  7. UK Annual Budget
  8. US Unemployment Rate
  9. US Unemployment Claims

Currency Price Changes and Interest Rates

For the month of February, I forecasted that the EUR/USD currency pair would rise in value.

Weekly Forex Forecast – 1st to 6th March 2026 (Charts)

February 2026 Monthly Forecast Final Performance

Last week saw no currency crosses with excessive volatility, so I am making no forecast for the coming week.

The Swiss Franc was the strongest major currency last week, while the Japanese Yen was the weakest. Directional volatility decreased last week, with only 11% of all major pairs and crosses changing in value by more than 1%.

Next week’s volatility is likely to be higher due to the outbreak of war in the Middle East, which might generate volatility in the US Dollar, the Japanese Yen, and the Canadian Dollar. There could also be unforeseen side effects which might affect other currencies.

You can trade these forecasts in a real or demo Forex brokerage account.

Weekly Forex Forecast – 1st to 6th March 2026 (Charts)

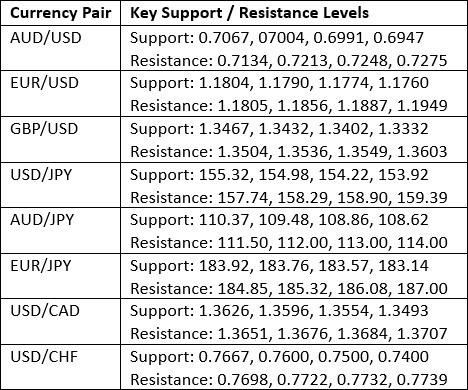
Key Support and Resistance Levels

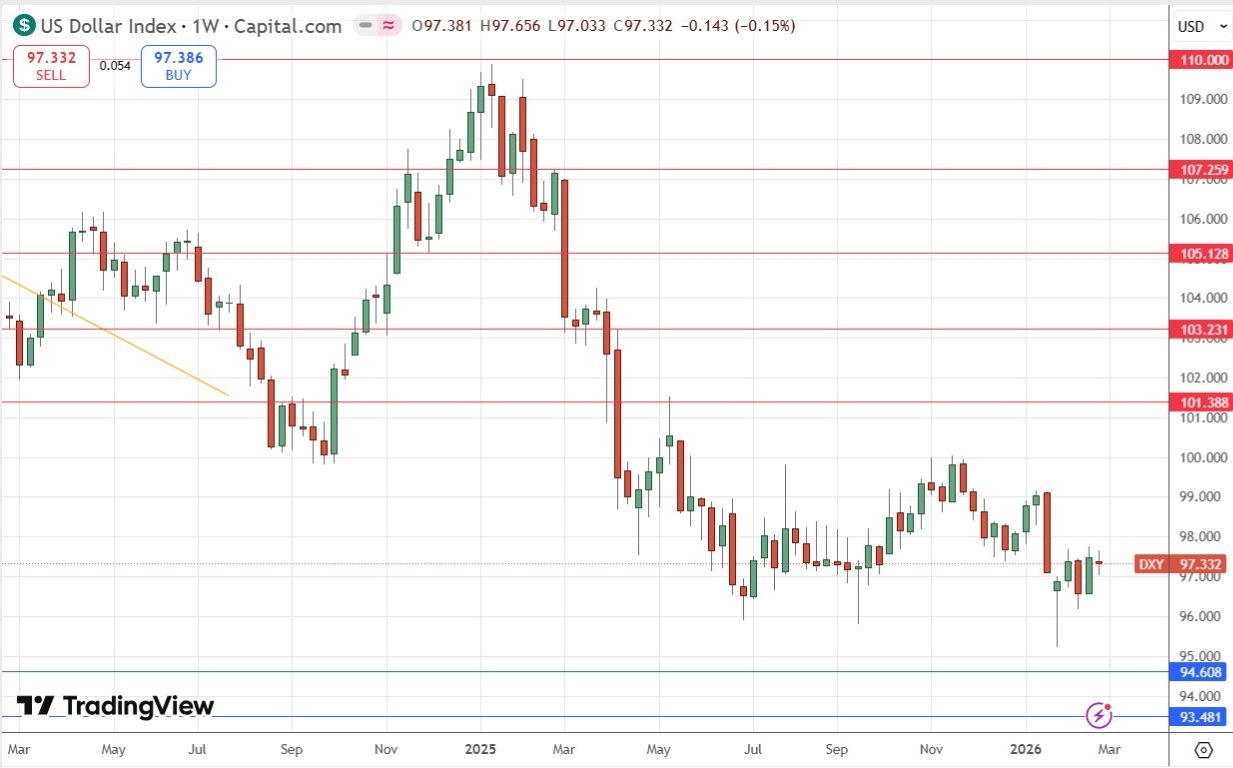
Last week, the US Dollar printed a small doji candlestick, which is typically seen as indecision. I see it more as a consolidation as the area of the candlestick is located where the price has been comfortable in recent weeks.

Zooming out, we can see that although the price action of recent months suggests a bearish consolidation pattern, the most recent price action has been bullish over recent weeks. The long-term trend is mixed, with the price below its level of 3 months ago but just above its level of 6 months ago.

We saw the interest rate outlook remain more bullish last week on the greenback, with markets now pricing in only two rate cuts of 0.25% over the course of 2026 instead of the three that were expected in the previous week. This was reinforced by hot PPI data.

I take no bias here on the US Dollar, which is not of much concern to the market. I think it will be better to watch other assets on their own merits this week.

Weekly Forex Forecast – 1st to 6th March 2026 (Charts)

US Dollar Index Weekly Price Chart

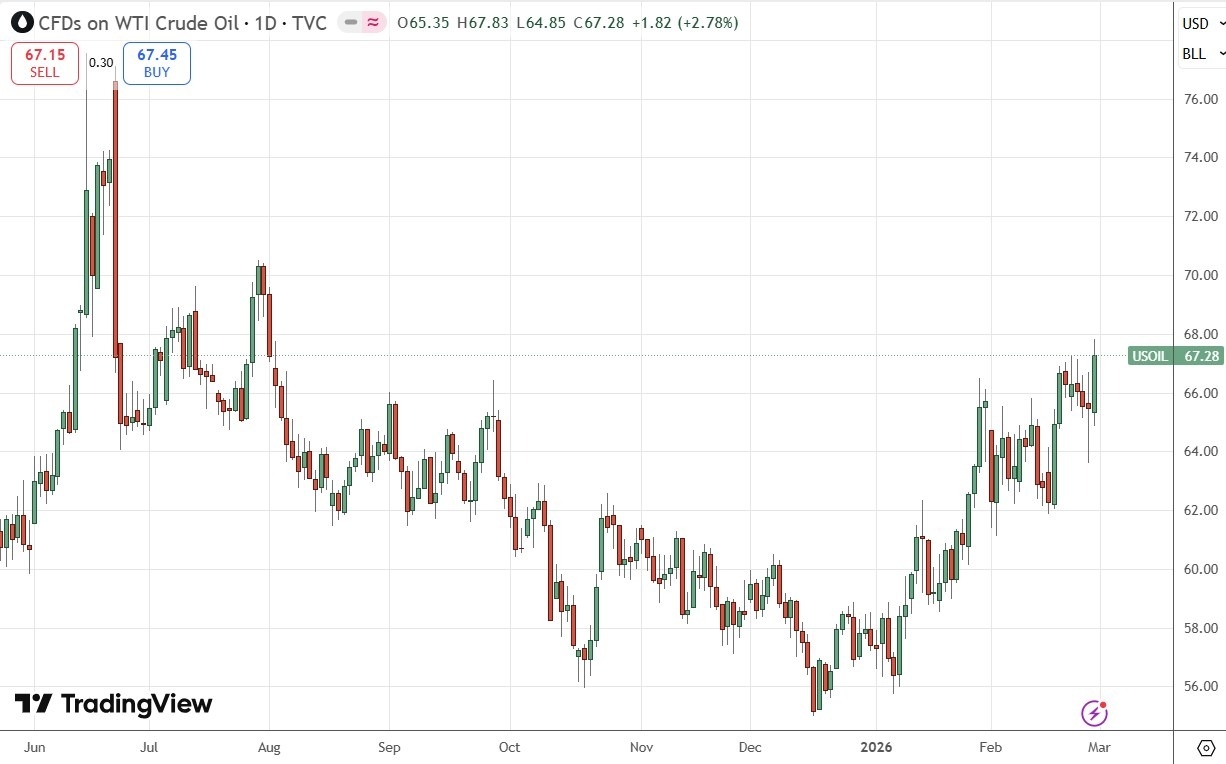
WTI Crude Oil rose last week, especially on Friday when the odds of an American attack on Iran seemed to narrow, sending the price higher to make a new 6-month high and close at what was nearly a 7-month high.

The rumour of war was correct, and it appears both sides are playing for as high stakes as could be, with the USA and Israel openly calling for regime change after killing Ayatollah Khameini and many other very senior figures in the opening strike Saturday morning.

Although it seems that neither side is targeting crude oil facilities, yesterday Iran announced a blockade of the Straits of Hormuz, and it seems 70% of oil tankers are still afraid to pass through. Iran attacked one oil tanker Sunday in the Strait. If this situation persists, it will reduce the supply of crude oil to the market as over 10% of global crude oil passes through the Strait. Still, OPEC looks poised to increase production, which may save the Americans from having to reopen the Strait to get the prices of Crude Oil and Gasoline down.

No matter what damage control happens now, I think it is likely that we will see a higher open for WTI Crude Oil on Monday. I am already long of it as a trend trader, but I will be exiting my long position quickly, by close on Monday or Tuesday, as I expect that OPEC will oblige and open the crude oil tap.

I could be wrong and just the sentiment could see the price move higher for several days if the war continues. It does seem likely that the war will go on for several days or weeks.

Weekly Forex Forecast – 1st to 6th March 2026 (Charts)

WTI Crude Oil Daily Price Chart

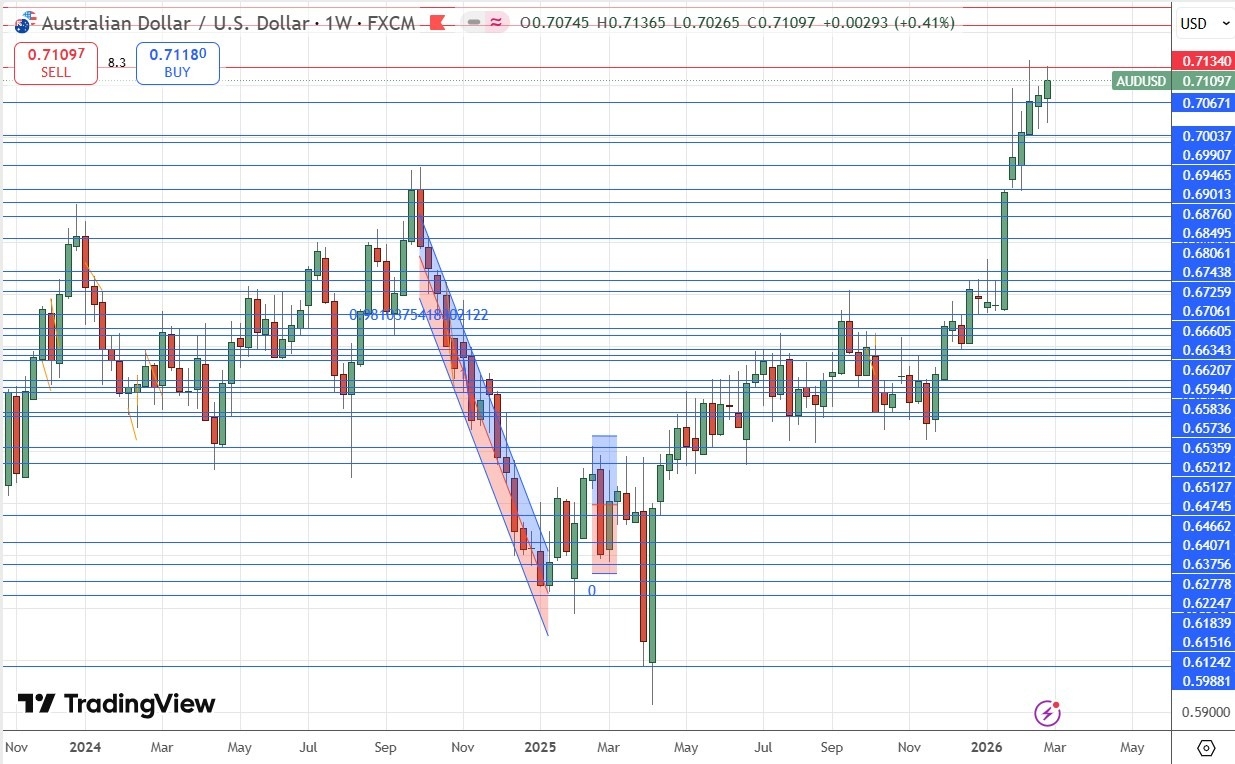
The AUD/USD currency pair is very interesting right now, as the Australian Dollar is even stronger than the US Dollar, being one of the few currencies that has outpaced it over recent weeks, trading at long-term high prices two weeks ago.

The Australian Dollar is one of three major currencies whose central banks are on a path of rate hikes rather than cuts, and its path is the strongest and most convincing.

I think the Australian Dollar is an excellent long prospect.

Technically, last week’s candlestick looks bullish as a breakout from the previous week’s inside candlestick, so if the price can get established later above $0.7134, it will be trading in bullish blue sky and could easily go on to make further gains.

Weekly Forex Forecast – 1st to 6th March 2026 (Charts)

AUD/USD Weekly Price Chart

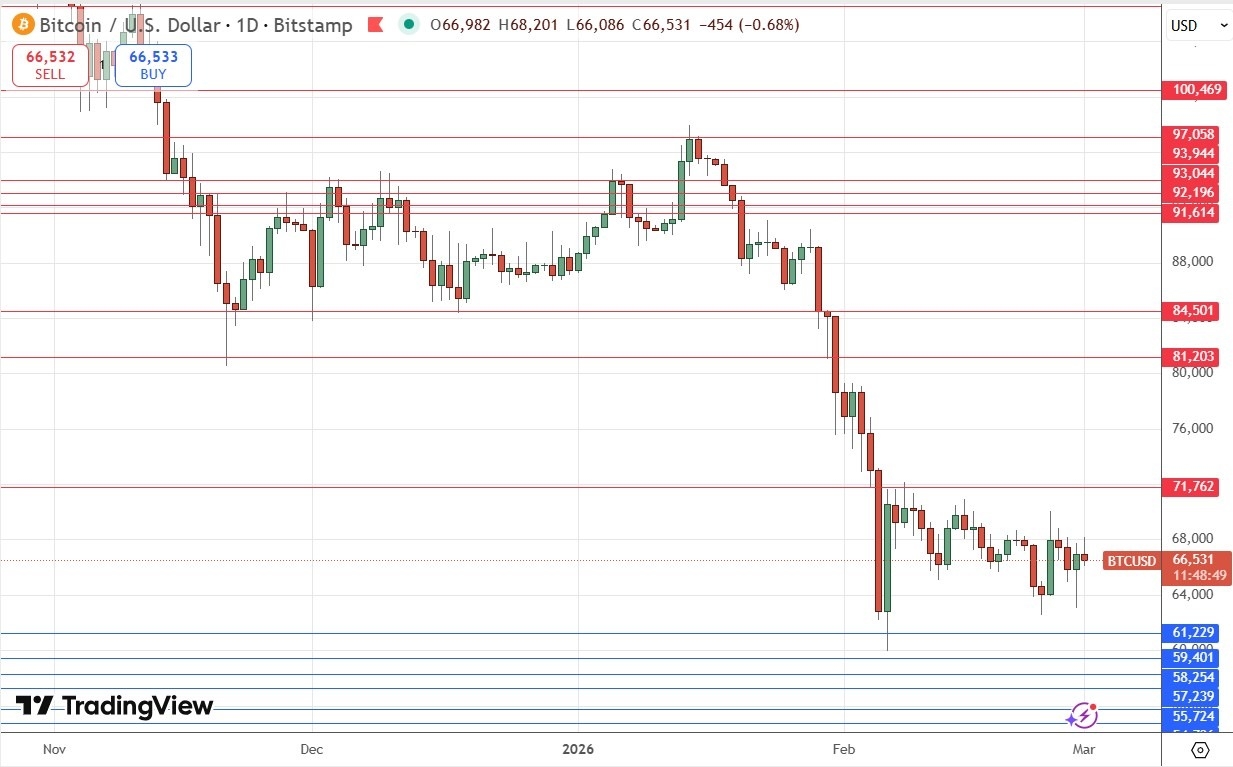
BTC/USD is starting to show a very textbook range consolidation between $61,229 and $71,762. This is an extension downwards of the lower border of the range, which is a bearish sign. The daily price chart below shows that a break of this range could be very significant technically. Although there has been lots of bearish pressure on Bitcoin, it may be that long-term investors see it as cheap in this range and are buying it. A convincing bullish breakout above $71,762 could trigger a fast rise to $81,203. This feels the less likely scenario.

A bearish breakdown below the very pivotal long-term low at $61,229 will be a dramatic even and likely trigger a further rapid fall in the price of Bitcoin.

Weekly Forex Forecast – 1st to 6th March 2026 (Charts)

Bitcoin Daily Price Chart

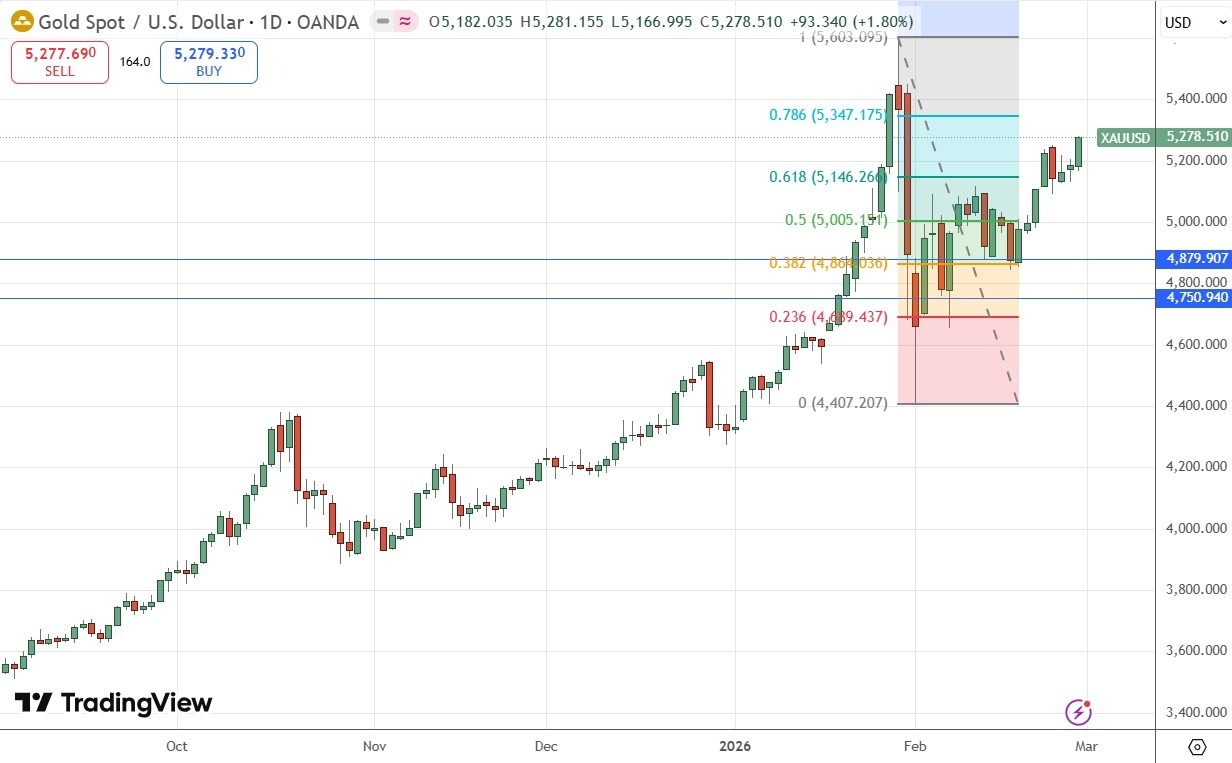
Gold has started to rise convincingly again, although it is still a meaningful way off its record high which it made a few weeks ago. The daily chart below shows that Friday’s rise was especially impressive, with the price closing right on the high of the day and the week.

It looks as if Gold will continue to go higher, and the rise seems to be changing from a grind higher into a firmer upwards move.

The price remains well above the 50% Fib retracement level of the recent sharp crash in value, which is another bullish sign.

Trend and momentum traders who do not want to wait for long-term breakouts will probably want to be long here already. I prefer to wait for long-term new high prices, so I will wait for a daily close above $5,418.55 before I enter a long trade.

Another bullish factor is the strong rise in Silver we saw last week, with the price closing above $93 per ounce. Both precious metals are at their highest prices since the huge crash one month ago.

Weekly Forex Forecast – 1st to 6th March 2026 (Charts)

Gold Daily Price Chart

I see the best trades this week as:

  1. Long of Gold following a daily (New York) close above $5,418.55.
  2. Short of Bitcoin following a daily (New York) close below $61,000 targeting $50,000.

Ready to trade our weekly Forex forecast? Check out our list of the top 10 Forex brokers in the world.

Source link

Go to Top