About Editorial team of BIPNs

Main team of content of bipns.com. Any type of content should be approved by us.
24 11, 2025

CRN Spotlights Supplement Safety Science

By |2025-11-24T17:11:03+02:00November 24, 2025|Dietary Supplements News, News|0 Comments


Washington, DC—The Council for Responsible Nutrition (CRN) announced the publication of new and updated chapters in its Vitamin & Mineral Safety, Fourth Edition (VMS4) series. The content expands this comprehensive, science-based resource on nutrient safety. The latest updates include:

A new safety evaluation for choline and citicoline.

These are essential nutrients for brain and liver health. Based on data from more than 20 human clinical trials, and consistent with prior evaluations by the Institute of Medicine (IOM), CRN reaffirmed IOM’s UL of 3,500 mg per day for choline and derived a new supplemental UL of 2,000 mg per day for citicoline. This new content also reviews recent observational studies exploring possible links between choline intake and cardiovascular disease (CVD) outcomes; CRN determined that a clear relationship between dietary choline intake and CVD outcomes cannot be established from the current body of evidence. “This new chapter closes a long-standing gap in nutrient safety guidance,” said Andrea Wong, Ph.D., Senior Vice President, Scientific & Regulatory Affairs, CRN. “Choline and citicoline play vital roles in cognition, liver health, and metabolism—and the evidence confirms their safety when consumed at reasonable supplemental levels.”

A new chapter on lutein, zeaxanthin, and meso-zeaxanthin.

These carotenoids are associated with vision and eye health. Building upon CRN’s earlier risk assessment for lutein (Shao and Hathcock, 2006), the updated review draws from approximately 75 human clinical trials and global evaluations by the Joint FAO/WHO Expert Committee on Food Additives (JECFA) and the European Food Safety Authority (EFSA). CRN reported that no serious adverse effects were identified across studies, even at doses far exceeding typical dietary intakes. Based on the available data, CRN maintained the Highest Observed Intake (HOI) of 22 mg per day for lutein previously established in 2006, and established an HOI of 26 mg per day for zeaxanthin and 17 mg per day for meso-zeaxanthin. “This chapter offers the most updated picture of the clinical safety of lutein, zeaxanthin, and meso-zeaxanthin,” said Dr. Wong. “It affirms these bioactives’ strong safety record and their important contribution to visual health.”

An updated folate chapter.

This new content reaffirms the existing UL of 1 mg per day for folic acid. This chapter also includes a new section on methylfolate (5-MTHF)—the active form increasingly featured in supplements and fortified foods.The updated review synthesizes the latest findings on the safety, metabolism, and bioavailability of methylfolate, establishing a UL of 1.5 mg per day. “Our updated folate chapter provides clarity for today’s market,” said Dr. Wong. “By distinguishing folic acid and methylfolate, CRN is helping ensure safety standards keep pace with innovation.”

An updated Vitamin K2 (menaquinone-7, MK-7) chapter.

The evaluation established a supplemental HOI level of 375 µg/day for adults. Previous editions of CRN’s Vitamin & Mineral Safety derived a single UL value for vitamin K, encompassing vitamin K1 and vitamin K2. Given the growing consumer interest and use of vitamin K2 supplements worldwide, a separate assessment was conducted for vitamin K2, specifically MK-7. CRN noted that this offers essential new guidance for manufacturers, regulators, and health practitioners seeking evidence-based recommendations for this nutrient, which is widely recognized for its role in supporting bone and cardiovascular health. “CRN’s updated MK-7 chapter reflects our commitment to providing rigorous, transparent safety evaluations grounded in the totality of evidence,” said Dr. Wong. “Establishing a HOI for Vitamin K2 (MK-7) represents a major step forward for scientific understanding and responsible product development across the dietary supplement category.”

The new content is accessible at www.crnusa.org/resources/vitamin-mineral-safety. Additional nutrient reviews are scheduled for release throughout 2026.

Related: High Levels of Lead in Protein Powder? Setting the Record Straight

Safety of Melatonin Supplements Questioned; Experts Offer Clarity & Perspectives

CRN Spotlights Regulatory Issues Related to MAHA, State Actions and More


Source link

24 11, 2025

I Recognized the Signs of Ovarian Cancer When It Came Back

By |2025-11-24T16:44:39+02:00November 24, 2025|Fitness News, News|0 Comments


Cancer is a wake-up call. I answered it in the fall of 2018 when I received a shocking ovarian cancer diagnosis at the age of 45. I was stage 2a and had a successful debulking surgery and chemotherapy during the spring of 2019. Then I set about changing almost everything! I relocated from the East Coast to the Midwest to be closer to my friends and family. I began and ended a relationship, changed jobs and started Pilates and TRX classes. I finally redecorated my house, something that was long overdue. I took the bucket list trips I had always dreamed about. I even threw myself a month-long 50th birthday party on the shore of Lake Michigan.

And it wasn’t all Instagram-worthy moments. After cancer, I pushed past my fear of failure and started writing. I took classes to learn playwriting and performed at public storytelling events. I worked a 12-step program for Adult Children of Alcoholics and Dysfunctional Families. I wanted to break patterns that dogged me since childhood.

You see, I’d seen the statistics. I did not like the term “progression-free survival” — I thought remission was still a thing. But I’d seen that the median was 18.4 months to live without cancer progressing after diagnosis. I’d had 1,800 days. I was a unicorn, and I was determined not to take a moment for granted. As they say, most people overestimate what they can do in a year and underestimate what they can do in 10 years. I was living my best life. I had slammed the phone down and hung up on cancer.

Annie, 2019

I sensed something was wrong in March 2024. I was determined not to miss the signs this time around. I noted a sort of phantom pain that came and went on my left side. Every time I walked past a mirror, I stopped to examine my midsection. The main blood test for a tumor marker associated with ovarian cancer is called CA125. I had been receiving a 4 or 5 (essentially undetectable) since initial treatment. I messaged my care team, telling them I was anxious and unable to shake the fear that I was missing early signs of bloat. In April, my CA125 was 7. I told myself to stop fixating. Surely cancer had misdialed.

I was cautiously optimistic going into my July blood draw. It was the weekend of a musical festival. Friends that I’d started taking those bucket list trips with had flown into town. Before the blood draw, I asked my medical team, What number should concern us? They said that so long as I stayed below 12, we wouldn’t sound the alarm. I got a 14. I was sure this was my last music festival.

I Recognized the Signs of Ovarian Cancer When It Came Back Annie, at a music festival, 2024.

I was then scheduled for a CT scan. The results were totally inconclusive. My joy was short-lived. I understood what my nurse practitioner meant when she said, “Sometimes it takes a while for these things to develop.” I lived in this awkward state of “inconclusive” for a couple of months. Every conversation was difficult to navigate. How much should I share? Would I add unnecessary stress to their lives? Would their emotional response stress me out? When my number went down one point in September, I celebrated like I’d won the lottery. By December, my CA125 was 19. A second set of scans confirmed what I’d known for nine months — my cancer was back. Initial diagnosis felt like a kick in the butt, a nudge from the universe. Recurrence felt like a kick in the teeth. A sucker punch to the gut. An absolutely shattered heart and broken spirit.

It was a sort of miracle that I’d caught my own cancer recurrence so early. A sign of how much I’d grown since the last go around, when I missed glaring, blinking neon signs. One morning, before it was confirmed, but when my deep knowing was sure, I asked myself what I still regretted in my life. One item rose to the surface immediately: I had not made total peace with my body. I immediately got with my therapist, who referred me to a body image group. Over the course of many weeks, with the help of tools and support, I gradually shifted my feelings. I could not go into treatment at war with myself.

My amazing friends, family and coworkers once again rallied to support me. I had a laparoscopic surgery and then started another six-chemo regimen. It was so much harder the second time around. Was it age? Or a trauma response to having to endure icing during treatment (I really hate the icing!)? A slow realization was dawning — this is now a chronic condition. I was ashamed. I was being stripped of my unicorn title.

The optimism and faith I had in the first go-round simply were not there. I was dogged daily by existential grief. Even the smallest decisions were difficult. I’m extremely extroverted and usually most comfortable surrounded by people. But this time I felt like a wounded animal. I wanted to be alone and hide in my bed. I could not summon a positive frame of mind for my caregivers. I also struggled to receive their positive intentions.

Things got worse and worse through the first four treatments. Finally, in cycle five, I started to see the light at the end of the tunnel. I had my last treatment the day after my 52nd birthday. I’d found some of my mojo. In a totally unexpected twist of fate, I had also met someone just before my December scans. She was also a cancer survivor, and she quite literally pulled me across the finish line.

Since completing treatment, I’m getting stronger and finding a new normal. I’m grateful to be on a PARP inhibitor, which I hope will extend my progression-free survival for a long time. (I’ve come around on this concept!) I am slowly seeing recurrence not as failure but as just a finer sieve that I’m once again shaking my life into. Cancer is clarifying. Only the most critical and meaningful things can get through. After recurrence, my relationship with cancer has changed. I’m unable to disconnect from it; we’re now in an ongoing dialogue. But I’m grateful that neither of us is spending much time these days talking about dying.

This educational resource was created with support from Merck.

Have your own Real Women, Real Stories you want to share? Let us know.

Our Real Women, Real Stories are the authentic experiences of real-life women. The views, opinions and experiences shared in these stories are not endorsed by HealthyWomen and do not necessarily reflect the official policy or position of HealthyWomen.

From Your Site Articles

Related Articles Around the Web


Source link

24 11, 2025

Forecast update for EURUSD -24-11-2025.

By |2025-11-24T15:43:13+02:00November 24, 2025|Forex News, News|0 Comments


The EURNZD price is forced to form mixed trading, despite its stability within the bullish channel’s levels, affected by the strength of the barrier of 2.0635, fluctuating near 2.0550 level, taking advantage of the continuation of the support stability at 2.0410, increasing the chances of gathering the required bullish momentum of resuming the bullish attack.


Stochastic fluctuation below 80 level confirms the effect of the temporary sideways bias dominance, to keep waiting for gathering bullish momentum to ease the mission of surpassing the barrier at 2.0635, to begin targeting the extra stations near 2.0700 and 2.0760.


The expected trading range for today is between 2.0475 and 2.0635


Trend forecast: Bullish


Source link

24 11, 2025

USD/JPY Forecast Today 24/11: Remains Supported (Chart)

By |2025-11-24T15:22:11+02:00November 24, 2025|Forex News, News|0 Comments

  • The US dollar slid quickly against the Japanese yen on Friday before stabilizing, with buyers expected to appear on further dips.
  • Wide interest rate differentials and limited BoJ tightening prospects continue to underpin longer-term bullish pressure.

The US dollar dropped against the Japanese yen rather quickly during the trading session on Friday, as we are testing the 156.50 yen level. That being said, we are seeing a little bit of a bounce at this point at the end of the session, and it suggests that we continue to see a little bit of hesitation on the downside. Even if we do fall from here, we will likely continue to see plenty of buyers near the 155 yen level, followed by the 154 yen level, and then ultimately the 153 yen level, where the 50-day EMA is racing toward it.

Underlying Rate-Differential Support

The 158 yen level has been a bit of a barrier, and that’s not a huge surprise considering that it’s been important in the past. But I look at this through the prism of a market that has a major interest rate differential, and therefore, you have to keep in mind that a lot of professional traders are collecting swap at the end of the session.

Ultimately, it’s not until we are looking at this as a market that cannot be shorted anytime soon, and really, it’s not until we break down below the 150 yen level. All things being equal, this is a very volatile market, but with the Bank of Japan in a situation where they may not be able to tighten monetary policy anytime soon, and after the most recent election, it certainly looks like there won’t be the political will. I do think it’s probably only a matter of time before we go higher, but this pullback makes sense as people may have been taking profit heading into the weekend.

Want to trade our USD/JPY forex analysis and predictions? Here’s a list of forex brokers in Japan to check out.

Christopher Lewis has been trading Forex and has over 20 years experience in financial markets. Chris has been a regular contributor to Daily Forex since the early days of the site. He writes about Forex for several online publications, including FX Empire, Investing.com, and his own site, aptly named The Trader Guy. Chris favours technical analysis methods to identify his trades and likes to trade equity indices and commodities as well as Forex. He favours a longer-term trading style, and his trades often last for days or weeks.

Source link

24 11, 2025

At-Home Micronutrient Testing Market Growth

By |2025-11-24T15:10:04+02:00November 24, 2025|Dietary Supplements News, News|0 Comments


Report Overview

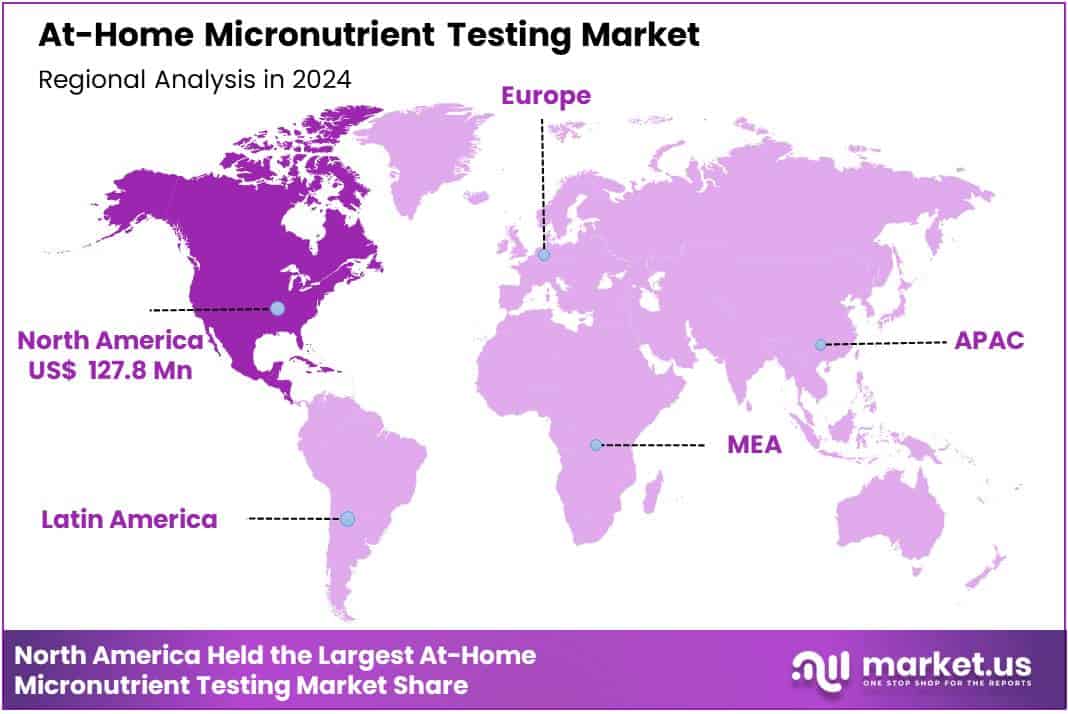
Global At-Home Micronutrient Testing Market size is expected to be worth around US$ 592.8 Million by 2034 from US$ 321.8 Million in 2024, growing at a CAGR of 6.3% during the forecast period 2025 to 2034. In 2024, North America led the market, achieving over 39.7% share with a revenue of US$ 127.8 Million.

The at-home micronutrient testing market has grown into a transformative segment of modern healthcare, reshaping how individuals track and manage their nutritional well-being. By offering convenient tools for evaluating micronutrient levels without requiring a clinic or laboratory visit, the market enables consumers to oversee their health directly from home.

At-Home Micronutrient Testing Market Growth

These solutions allow users to understand their vitamin, mineral, and antioxidant status through technologically advanced testing methods, helping them make informed choices about diet, supplementation, and lifestyle improvements. Most kits rely on simple collection techniques such as finger-prick blood spots or saliva samples which are processed in certified laboratories to generate detailed reports. Many platforms now complement results with personalized nutritional insights, dietary guidance, and supplement suggestions tailored to each individual’s needs.

By focusing on ease of use, affordability, and wide availability, the market has expanded access to micronutrient assessments across diverse age groups and health profiles. Its value lies in strengthening preventive healthcare by enabling early recognition of nutrient deficiencies and metabolic imbalances before they progress into more serious health issues. As consumer awareness increases, at-home micronutrient testing continues to support proactive, data-driven approaches to everyday wellness.

At-home kits enable users to collect finger-prick blood, saliva, or urine samples and receive digital reports that explain deficiencies in vitamins, minerals, and essential biomarkers linked to immunity, metabolism, and energy levels. For instance, platforms offering vitamin D and B12 testing have seen rising adoption among people experiencing fatigue or low immunity, especially after lifestyle disruptions during the pandemic.

Companies increasingly integrate these tests with telehealth consultations, supplement recommendations, and fitness tracking apps to provide a complete wellness ecosystem. Examples include home kits paired with mobile dashboards that compare past and present nutrient levels, helping users understand dietary gaps.

The convenience of doorstep delivery and lab-verified results strengthens consumer trust, while expanding e-commerce channels improves accessibility. Growing interest from athletes, individuals following vegan diets, and people managing chronic conditions also contributes to market traction. As personalized nutrition advances, at-home micronutrient testing becomes a key entry point for continuous health monitoring.

Key Takeaways

  • In 2024, the market generated a revenue of US$ 321.8 Million, with a CAGR of 6.3%, and is expected to reach US$ 592.8 Million by the year 2034.
  • The Product segment is divided into Strips, Cassettes, Kits, and Others, with Strips taking the lead in 2024 with a market share of 42.5%.
  • The Micronutrient Type segment is divided into Vitamins, Minerals, and Comprehensive panels, with Vitamins taking the lead in 2024 with a market share of 51.7%
  • The Distribution Channel segment is divided into Hospital pharmacies, Online pharmacies, Retail pharmacies, Hypermarkets, and Others, with Online pharmacies taking the lead in 2024 with a market share of 43.5%
  • North America led the market by securing a market share of 39.7% in 2024.

Product Analysis

Strips account for the largest share of the at-home micronutrient testing market with 42.5% because they offer quick, low-cost, and user-friendly testing for common nutrients such as vitamin D, iron, and B-vitamins. Consumers prefer strips due to their simplicity—most require only a drop of blood or urine and provide results within minutes without the need for specialized equipment.

This convenience aligns well with the growing trend of routine self-monitoring, especially among individuals managing fatigue, immunity concerns, or dietary restrictions. Fitness-focused users and people following vegan or low-nutrient diets frequently adopt strip-based tests to track essential biomarkers associated with energy metabolism.

For example, vitamin D and iron deficiency strips are widely used in regions with limited sunlight exposure or among menstruating women, where deficiency risks are higher. The affordability of strips also expands adoption among younger users and first-time testers. Manufacturers continue to enhance strip sensitivity and colorimetric accuracy, making them more reliable for home use. As preventive healthcare awareness increases, strips remain the entry-level product preferred by a broad demographic, sustaining their dominant market position.

In August 2024, Quest Diagnostics, a major provider of diagnostic information services, introduced 13 new blood tests aimed at assessing micronutrient deficiencies. These tests help individuals determine whether they lack essential vitamins and minerals required for maintaining overall health. The panels are offered directly to consumers and can be purchased exclusively through questhealth.com.

Micronutrient Type Analysis

Vitamins form the leading micronutrient testing segment with 51.7% market share because deficiencies in vitamin D, B12, and folate are widely recognized and frequently screened by both consumers and healthcare providers. These nutrients directly influence immunity, bone strength, mood regulation, neurological function, and overall metabolic performance, making them central to preventive health routines. For example, vitamin D insufficiency is prevalent among indoor workers and older adults, driving high demand for simple at-home vitamin D tests.

Vitamin B12 testing is also growing among individuals following plant-based diets, where deficiency risk is higher due to limited dietary sources. Home-based vitamin tests are often bundled in easy-to-use kits that allow users to collect finger-prick samples and access digital reports with actionable insights.

The widespread availability of vitamin-specific panels through online pharmacies and consumer wellness platforms reinforces their dominance. As wellness programs and tele-nutrition services increasingly emphasize personalized vitamin optimization, this category continues to attract both routine and first-time users, solidifying its position as the most sought-after micronutrient testing type.

Distribution Channel Analysis

Online pharmacies dominated the distribution channel landscape with 43.5% market share as consumers increasingly prefer digital platforms for purchasing home diagnostic kits due to convenience, privacy, and wider product availability. The ability to compare brands, read reviews, and order tests without visiting physical stores drives strong adoption, especially among tech-savvy urban populations.

Many leading online health platforms also integrate value-added services such as subscription testing plans, sample-collection guides, teleconsultations, and personalized supplement recommendations. For example, companies offering vitamin D, B12, or multinutrient panels often provide mobile dashboards that track historical test trends, enhancing engagement and repeat usage.

Online channels are particularly effective for reaching individuals with busy schedules or limited access to diagnostic labs. They also support direct-to-consumer marketing, enabling emerging brands to scale rapidly without relying on retail presence. Seasonal promotions and automated re-ordering features further stimulate consistent demand.

At-Home Micronutrient Testing Market SizeAt-Home Micronutrient Testing Market Size

Key Market Segments

By Product

  • Strips
  • Cassettes
  • Kits
  • Others

By Micronutrient Type

  • Vitamins
  • Minerals
  • Comprehensive panels

By Distribution Channel

  • Hospital pharmacies
  • Online pharmacies
  • Retail pharmacies
  • Hypermarkets
  • Others

Drivers

Growing consumer shift toward preventive and personalized nutrition

The rise of preventive healthcare and personalized nutrition is expected to strengthen demand for at-home micronutrient testing as consumers increasingly monitor deficiencies that influence energy, immunity, cognitive performance, and metabolic health. A growing volume of clinical literature highlights the widespread prevalence of micronutrient gaps, such as vitamin D insufficiency affecting more than one-third of adults in several countries, which encourages individuals to seek convenient and affordable testing options without visiting a clinic.

The shift toward virtual care ecosystems further accelerate home-based testing adoption, as digital platforms integrate micronutrient reports with supplement recommendations, teleconsultations, and lifestyle guidance. Companies offering finger-prick vitamin D, B12, iron, or magnesium tests have expanded online distribution, enabling rapid purchase, doorstep delivery, and seamless digital result interpretation.

Examples include platforms providing personalized dashboards that show trends over time, correlating diet patterns with test outcomes. Consumers engaged in fitness programs, weight-loss regimens, or immunity-focused lifestyles increasingly prefer home tests to understand nutrient gaps that influence performance or fatigue levels.

With rising awareness through health campaigns and educational content from healthcare providers, the driver gains momentum as more individuals adopt proactive monitoring rather than waiting for clinical symptoms to emerge. This structural consumer behavior shift continues to anchor growth.

Restraints

Limited accuracy compared to laboratory-based diagnostics

Despite rising demand, accuracy challenges associated with home-based micronutrient tests act as a restraint, as results may vary due to collection inconsistencies, environmental exposure, or limitations of finger-prick sampling for certain analytes.

For example, blood spot tests may not perfectly reflect serum concentrations for markers such as zinc or magnesium because micronutrient distribution differs between plasma and whole-blood compartments. This discrepancy leads some clinicians to caution against using home kits for complex deficiency assessment, especially for patients with underlying conditions or those requiring high-precision monitoring.

Additionally, improper collection techniques, such as insufficient blood volume or contamination during sample drying, can lead to errors or invalid results. Users without medical training may find it difficult to follow exact procedural steps, increasing the probability of variability compared to standardized phlebotomy in diagnostic labs. Regulatory considerations also restrict certain biomarkers from being offered outside professional settings, limiting the scope of nutrients measurable at home.

For example, some markets allow only specific vitamin assays through direct-to-consumer channels, while others require physician involvement. These combined concerns reduce confidence among healthcare professionals, potentially slowing adoption among populations that rely on clinically validated results. The restraint persists as long as testing accuracy remains uneven across nutrient categories.

Opportunities

Integration of AI-enabled personalized nutrition ecosystems

A major opportunity emerges from integrating at-home micronutrient testing into AI-driven personalized nutrition platforms that combine biomarker data, dietary habits, genomic markers, and lifestyle inputs into tailored recommendations. As consumers increasingly adopt digital health tools, companies are developing algorithms that correlate micronutrient levels with sleep quality, activity performance, stress responses, and dietary intake patterns.

For example, vitamin D trends can be linked with sunlight exposure data from wearable devices, while iron or B12 levels may be analyzed alongside menstrual cycle tracking or diet logs to predict depletion risks. This integrated ecosystem creates recurring revenue models through subscription-based testing, supplement delivery programs, and personalized meal planning applications.

Startups are exploring AI-generated supplement formulation systems that adjust dosage recommendations based on follow-up test results, enabling dynamic correction of deficiencies. Partnerships between diagnostics firms, nutrition technology companies, and wellness platforms present opportunities to expand market reach across fitness, corporate wellness, and preventive health services.

As governments and health organizations emphasize chronic disease prevention through nutrition, digital micronutrient monitoring platforms align with population-level health goals. The rise of remote care and tele-nutrition services strengthens this opportunity, allowing micronutrient testing to function as a foundational component of long-term health optimization.

Impact of Macroeconomic / Geopolitical Factors

Macroeconomic and geopolitical factors influence the At-Home Micronutrient Testing Market by shaping consumer spending, supply chain stability, and access to diagnostic materials. Periods of economic slowdown typically shift household spending toward essential healthcare, which benefits at-home testing because it offers a lower-cost alternative to clinical diagnostics.

However, inflation-driven increases in raw material and logistics costs can raise kit prices, affecting affordability in price-sensitive markets. Geopolitical tensions also impact the sourcing of assay components, microfluidic cartridges, reagents, and lateral-flow materials, which are often manufactured across multiple countries. Disruptions in global trade routes or restrictions on chemical exports may slow production timelines and limit inventory availability for online and retail channels.

Public health policy changes in response to geopolitical events further influence demand. For example, global energy and food supply uncertainties increase consumer awareness of immunity, fatigue, and nutritional well-being, contributing to higher self-monitoring behavior.

Shifts in labor markets, such as the rise of remote work, encourage more people to adopt home diagnostics rather than visiting clinics. At the same time, increased government scrutiny over cross-border data transfers and digital health privacy may affect how testing companies store and process user data.

Latest Trends

Rapid adoption of home-based finger-prick vitamin and mineral panels

A prominent trend in the market is the rapid adoption of home-based finger-prick testing panels that allow individuals to measure multiple vitamins and minerals in a single kit with minimal effort. These panels often include vitamin D, B12, folate, ferritin, magnesium, zinc, and other commonly deficient nutrients, offering a broader view of nutritional status than single-analyte tests.

Consumers increasingly prefer bundled panels because they provide deeper insight into health drivers such as fatigue, hair thinning, muscle performance, and immune resilience. The convenience of collecting a small blood sample at home and shipping it to certified laboratories aligns well with work-from-home lifestyles and the broader acceptance of telehealth services.

Companies expanding test portfolios frequently promote user-friendly sampling devices designed to reduce discomfort and improve sample accuracy, which enhances trust and repeat usage. In addition, the trend is reinforced by growing online health communities where individuals share experiences, compare deficiency patterns, and seek advice on restoring optimal nutrient levels.

Regional Analysis

North America is leading the At-Home Micronutrient Testing Market

North America represents the largest regional share in the At-Home Micronutrient Testing Market due to its strong digital health adoption, high prevalence of vitamin and mineral deficiencies, and widespread integration of home-based diagnostics into consumer wellness routines. The region benefits from advanced telehealth frameworks, making it easier for users to combine at-home testing with remote consultations and personalized supplement plans.

For example, at-home vitamin D and B12 testing is commonly used in the US among individuals with limited sun exposure or plant-based diets, two groups where deficiency risks are significantly higher. The presence of major consumer-focused diagnostic brands with nationwide distribution further supports market concentration.

Online pharmacies and direct-to-consumer wellness platforms also have strong penetration, enabling rapid purchasing and access to multi-panel micronutrient kits. High disposable income and growing interest in preventive health contribute to continued regional dominance.

The Asia Pacific region is expected to experience the highest CAGR during the forecast period

Asia Pacific is the fastest-growing region due to rising health awareness, expanding middle-class populations, and rapid adoption of digital wellness services. Increasing urbanization and lifestyle changes in countries such as China, Japan, and South Korea contribute to higher rates of nutrient deficiencies, prompting more individuals to use home-based vitamin and mineral testing kits.

At-home diagnostics are also gaining traction due to crowded healthcare systems, where consumers prefer convenient self-testing to avoid long clinic wait times. For example, vitamin D deficiency screening demand has surged in urban centers with indoor-dominant lifestyles.

The region’s strong e-commerce infrastructure accelerates accessibility, with online pharmacies offering bundled micronutrient panels at competitive prices. Local wellness brands are increasingly partnering with diagnostic labs to launch culturally tailored tests such as iron panels for women or B-vitamin screenings for vegetarian populations further boosting growth.

At-Home Micronutrient Testing Market RegionAt-Home Micronutrient Testing Market Region

Key Regions and Countries

North America

Europe

  • Germany
  • France
  • The UK
  • Spain
  • Italy
  • Russia
  • Netherland
  • Rest of Europe

Asia Pacific

  • China
  • Japan
  • South Korea
  • India
  • Australia
  • New Zealand
  • Singapore
  • Thailand
  • Vietnam
  • Rest of APAC

Latin America

  • Brazil
  • Mexico
  • Rest of Latin America

Middle East & Africa

  • South Africa
  • Saudi Arabia
  • UAE
  • Rest of MEA

Key Players Analysis

Key players in the market include Everlywell, LetsGetChecked, Thorne, Labcorp, Quest Diagnostics, ZRT Laboratory, MyLabBox, Genova Diagnostics, Nutritional Testing Services, Vitagene, GenePlanet, imaware, and Other key Players.

Everlywell is a US-based at-home testing company offering micronutrient panels (e.g., vitamin D, B12) that use CLIA-certified labs, mail-in self-collection kits and digital results within days. LetsGetChecked is a direct-to-consumer provider whose micronutrient test covers vitamins D, B12, E and minerals like copper and selenium, with home blood-sample kits and results in 2-5 days plus board-certified clinical support.

Thorne is a wellness brand offering at-home biomarker and micronutrient tests tied to its nutrition/supplement ecosystem, including home sample collection and personalized follow-up via its health intelligence platform.

Top Key Players

  • Everlywell
  • LetsGetChecked
  • Thorne
  • Labcorp
  • Quest Diagnostics
  • ZRT Laboratory
  • MyLabBox
  • Genova Diagnostics
  • Nutritional Testing Services
  • Vitagene
  • GenePlanet
  • imaware
  • Other key Players

Recent Developments

  • In May 2022 Everlywell announced the expansion of its nutritional health suite, launching a line of vitamins and supplements alongside its at-home micronutrient test offerings.
  • In September 2022 LetsGetChecked announced a US $20 million strategic investment from Morgan Health (a unit of JPMorgan Chase & Co.) aimed at scaling access to at-home diagnostics and personalised health services.

Report Scope


Source link

24 11, 2025

XRP News Today: ETF Buzz vs. Technical Doubts – What’s Next for XRP?

By |2025-11-24T15:07:08+02:00November 24, 2025|Crypto News, News|0 Comments

As of November 24, 2025, XRP is back in the spotlight. The crypto world is buzzing with talk about a possible XRP exchange-traded fund (ETF). Many traders see this as a big step that could pull more institutional money into the market. The excitement is real. But so are the doubts.

While social media is full of bold predictions, XRP’s price charts tell a different story. The technical signals still look weak. Momentum is slow. Key resistance levels remain unbroken. This makes some traders wonder if the ETF buzz is enough to push XRP into a strong rally.

At the same time, Ripple continues to expand its global payment solutions. Banks and financial firms still see value in its fast, low-cost transactions. This gives XRP a solid use case that most altcoins lack.

So now the big question stands: Does the ETF hype outweigh the technical concerns? Or is the market moving faster than XRP’s actual performance? The answer may shape what happens next for one of crypto’s most watched assets.

XRP Market Overview 

Meyka AI: XRP USD (XRPUSD) Stock Overview

As of November 24, 2025, XRP trades near the $2 mark. Price moved up from lows earlier in the year. The token saw strong inflows after several ETF developments surfaced. Still, daily swings remain large. Traders show a mix of hope and caution. Volume has risen on some days. That increase often comes during ETF-related headlines. Such swings point to high interest and high risk.

The XRP ETF Buzz: What’s Driving the Hype?

Regulatory shifts in 2025 opened new doors. The SEC adopted generic listing standards for crypto ETFs in September. This change makes it easier for funds to list assets on major exchanges. Market participants then speculated that XRP products could follow. That talk turned louder when clearing systems and filings hinted at upcoming ETF listings. Those moves do not mean formal approval yet. But they signal that big firms are preparing for launch.

Several asset managers listed XRP products or filed paperwork. Some exchanges and custodians prepared settlement lines. The market responded fast. Media coverage and influencer posts amplified the story. On top of that, Ripple’s legal clarity in 2025 removed a major barrier. That clarity made institutional conversations more practical. The combined effect boosted demand for XRP exposure through ETFs and funds.

Technical Analysis Raises Red Flags

Charts show mixed signals. XRP broke into higher ranges earlier in November. Then the price pulled back to a decision zone. Momentum indicators do not look strongly bullish. Moving averages are close together. That reduces clear trend confirmation. Several technical traders point to repeating resistance at certain levels. Failure to hold above these levels often triggers sharper drops. Thus, some technical analysts advise caution until clear breakouts occur.

XRP News Today: ETF Buzz vs. Technical Doubts – What’s Next for XRP?
Meyka AI: Momentum Indicators & Trend Current Overview

On-chain technicals add nuance. Exchange inflows jumped recently. Dormant whales moved large amounts. Such transfers increased selling pressure on some days. When whales deposit in exchanges, the market often faces a sharper short-term supply. That activity can cancel bullish ETF flows and create price dislocation. Monitoring whale and exchange flows remains critical for short-term traders.

Fundamental Factors Supporting XRP

Beyond charts, XRP retains clear utility. Ripple’s On-Demand Liquidity (ODL) keeps finding partners overseas. Banks and payment firms still test or use XRP rails for fast transfers. That real-world use case is rarer among top altcoins. Legal clarity in 2025 also helped. Courts and settlements reduced uncertainty about XRP’s status in public markets. This removal of legal overhang makes long-term institutional interest more realistic.

An ETF listing would widen access. Retail and institutional investors can buy XRP exposure through regulated wrappers. That tends to reduce custody friction and increase capital flow. However, actual adoption by banks and payment firms depends on compliance, KYC, and internal risk rules. Utility alone does not guarantee instant price gains.

ETF Hype vs. Technical Reality: The Core Debate

Optimists point to the clearing preparations and legal progress. They expect steady inflows once funds go live. ETF listings in other crypto markets set a precedent. Inflows can lift liquidity and raise valuation multiples. Pundits also cite on-chain accumulation as a bullish sign. Recent fund flows into XRP ETFs have shown notable sums.

Skeptics highlight immediate selling from whales. Some large holders sold into ETF demand. That trade can mute rallies. Also, charts do not yet show a clean breakout. The market often prices in expected events before they happen. When the event arrives, traders may sell the news. That pattern could lead to sudden dips even if long-term fundamentals are sound.

What’s Next for XRP?

Short term: expect volatility. Watch the $2.30-$2.50 zone as a resistance area in late November 2025. A sustained move above those levels would signal stronger momentum. If the price falls below $1.80, bears may push toward lower support. Traders should follow daily volume and whale flows closely. Price reaction to ETF listings or DTCC/clearing announcements will be decisive.

Medium term (3-6 months): ETF launches or S-1/S-3 filings will be the main catalysts. Additional Ripple partnership news can help. Also, watch macro liquidity and Bitcoin trends. Crypto flows often track larger market risk appetite. On-chain metrics such as long-term holder accumulation and exchange reserves will shape the trend.

Long term (2026+): institutional adoption and real payments use will matter most. If banks integrate ODL at scale, XRP’s utility case strengthens. ETF access can lock in passive demand. But regulatory shifts and competitive tech remain risks. A clear adoption path could push valuation much higher. Failure to expand use cases may limit gains.

Smart Steps for Handling XRP Market Volatility

Adopt strict position sizing. Use stop losses and clear profit targets. Track on-chain flows and exchange balances daily. Treat ETF chatter as a catalyst, not a certainty. Balance technical signals with fundamental events. For portfolio exposure, consider staged entry. Using tools such as an AI stock research analysis tool can help analyze flows and filings efficiently, but do not rely solely on automation. Always validate automated outputs with primary filings or reputable news.

Final Words

XRP sits at a crossroad on November 24, 2025. ETF preparations and legal clarity support a bullish narrative. Still, technical weakness and whale selling create real short-term risks. Traders should remain alert. Follow ETF filings, clearing notices, on-chain flows, and major partnership announcements. Those signals will decide whether ETF buzz turns into a lasting trend or a short-lived rally.

Frequently Asked Questions (FAQs)

Is an XRP ETF coming in 2025?

As of November 24, 2025, no XRP ETF is officially approved. Some filings and rumors exist, but regulators have not confirmed anything yet. Investors are still waiting for clear news.

Why is the XRP price not rising even with the ETF news?

XRP price stays quiet because charts show weak momentum. Some large holders are selling on rallies. ETF talk creates hope, but the market needs stronger demand to move higher.

What is the XRP price prediction after a possible ETF launch?

No one can predict the price with certainty. If an ETF is approved, demand may rise. But price will still depend on market trends, risk levels, and investor interest.

Disclaimer: The content shared by Meyka AI PTY LTD is solely for research and informational purposes. Meyka is not a financial advisory service, and the information provided should not be considered investment or trading advice.

Source link

24 11, 2025

EUR/USD Forecast: Fed Cut Speculations Limit Losses, Eyes on Key Releases

By |2025-11-24T13:21:04+02:00November 24, 2025|Forex News, News|0 Comments

  • EUR/USD forecast remains tilted to the upside amid narrowing rate differentials.
  • The short-term view remains consolidating, with focus on German IFO data.
  • Technical forecast is mildly bearish within the current consolidation, supported by 1.1470, with eyes on 1.1590.

The EUR/USD forecast remains slightly up on Monday, as renewed odds of a December Fed rate cut have pressured the US dollar. The pair stays steady above the 1.1500 level as the Dollar Index pulls back while the ECB’s interest rate outlook remains stable.

-Are you looking for the best AI Trading Brokers? Check our detailed guide-

The New York Fed President William’s comments suggested that labor market risks outweigh concerns about inflation. This pushes rate cut expectations, with markets reacting swiftly. The CME FedWatch tool now shows a 70% probability of a rate cut, up from 30% last week.

Still, the Fed’s outlook remains mixed, with other officials, such as Lorie Logan and Susan Collins, cautioning against premature easing. These comments have limited dollar selling, but the broader narrative tilts toward policy loosening.

On the European side, the ECB is widely expected to keep interest rates unchanged in December, supported by stable inflation at around 2% and resilient labor markets. This has kept the EUR/USD safe from downside shocks.

Markets now focus on Germany’s IFO Business Climate Survey, projected to tick up to 88.5. Before the data release, the pair appears to be supported by a firm ECB, reigniting speculation about Fed rate cuts.

Strategists maintain a positive medium-term outlook for the euro, as Danske Bank expects the pair to move to 1.2200 over the next 12 months, as rate differentials narrow. Meanwhile, Morgan Stanley forecasts 1.23 by mid-2026 but anticipates a subsequent pullback.

Key Events Ahead

  • Germany IFO Business Climate – Monday
  • US September PPI – Tuesday
  • US Retail Sales – Tuesday
  • FOMC Speakers – Throughout the Week
  • Eurozone confidence and sentiment surveys – Later in the week

EUR/USD Technical Forecast: Range-bound Above 1.1500

EUR/USD Forecast: Fed Cut Speculations Limit Losses, Eyes on Key Releases
EUR/USD 4-hour chart

The EUR/USD 4-hour chart shows a mild bearish tilt as the price remains below the 20-period MA but is supported by the 1.1500 level ahead of swing low support near 1.1470. The RSI staying below the 50.0 mark, pointing south, suggests more weakness.

-Are you looking for the best MT5 Brokers? Check our detailed guide-

However, the overall trend remains one of consolidation, looking for a catalyst to trigger a breakout. If a bullish surprise occurs, the price could test the ultimate resistance near the 200-period MA at 1.1590.

Looking to trade forex now? Invest at eToro!

75% of retail investor accounts lose money when trading CFDs with this provider. You should consider whether you can afford to take the high risk of losing your money.

Source link

24 11, 2025

DOGE Price Prediction 2025

By |2025-11-24T13:06:05+02:00November 24, 2025|Crypto News, News|0 Comments

Dogecoin trades near $0.1478, showing a one-month drop of 25.69% and a weekly decline of 8.3%. The timing is interesting because DOGE enters a major catalyst window as Grayscale prepares to launch the GDOG ETF on the New York Stock Exchange. ETFs often shift market psychology fast, and traders are watching to see whether DOGE reacts like Bitcoin did during its ETF debut or takes a more gradual path. 

The setup raises a simple question: Is DOGE preparing for its next major trend?

ETF Debuts Reshape Market Expectations

Grayscale’s new DOGE and XRP ETFs arrive at a time when the market is warming up to regulated crypto products. GDOG will become one of the first Dogecoin-linked ETFs available to U.S. investors, and the fund uses spot DOGE as its underlying asset.

Some elements in this launch stand out:

  • GDOG converts from an existing private trust

  • Coinbase handles custody

  • NYSE Arca provides the listing venue

This combo signals strong compliance alignment. It also gives DOGE a direct pipeline into traditional portfolios. Many observers expect GDOG to attract meaningful attention, especially with analyst Eric Balchunas projecting up to $11 million in first-day volume. It’s rare for a meme coin to gain institutional framing like this. DOGE now stands beside BTC, ETH, and XRP in ETF-ready status.

Regulatory Climate Improves

A key driver of these ETF approvals comes from SEC Chairman Paul Atkins. He shifted the agency’s stance from restrictive enforcement to transparency-based oversight. His “Project Crypto” approach encourages compliant issuers to enter regulated markets.

This creates a healthier environment for DOGE. Even better, GDOG arrives alongside GXRP, forming a broader wave of non-BTC, non-ETH ETFs. If institutions diversify into alternative assets, DOGE may benefit more than expected.

Institutional and Retail Dynamics Strengthen DOGE’s Case

ETF inflows often behave as accelerators. If GDOG follows historical patterns, traders may see an influx of both institutional flows and retail interest. Consider why this matters:

  • Retail participation rises when access becomes easier

  • Institutions prefer regulated, custodied exposure

  • Meme-driven assets benefit from momentum cycles

DOGE has always thrived on narrative shifts. With ETF approval, the narrative gains a new angle: “compliance premium.”

Leverage Adds Volatility Through TXXD

Source: X

The launch of the 21Shares 2x Long DOGE ETF (TXXD) introduces a high-intensity product built for short-term traders. The leveraged nature makes DOGE more visible to traders seeking amplified exposure. It also hints at increased intraday volatility.

This fund tracks DOGE’s daily performance with double sensitivity, which raises an interesting question: Will this increase market depth or exaggerate short-term liquidation events? Or should we treat TXXD with caution due to its compounding effects.

Technical Outlook: Reaction Zone Ahead

DOGE trades around $0.1466, holding a mid-range position. The structure shows consolidation and weakness, with room for a dip toward $0.09270, a strong historical support area. Many watch that zone closely, if the current one breaks, since it marks a key reaction area.

Source: X

If buyers defend current levels, price may push toward resistance at $0.30 and $0.48. A break and close above those levels would signal a stronger shift toward bullish territory. For now, DOGE remains in a neutral-to-bearish setup while holding potential for a sharp recovery if ETF momentum supports inflows.

Dogecoin Price Prediction Table: 2025

2025 $0.11 $0.19 $0.42
November 2025 $0.12 $0.15 $0.21
December 2025 $0.13 $0.17 $0.24

Conclusion

DOGE’s ecosystem enters a new phase as ETF products strengthen its legitimacy and broaden investor access. The combination of GDOG, TXXD, and improved regulatory clarity gives DOGE fresh catalysts heading into the final months of 2025. 

While risks exist, the landscape now favors structured institutional participation. DOGE’s 2025 outlook hinges on whether buyers defend key levels and whether ETF inflows activate the next bullish cycle.

Source link

24 11, 2025

The EURNZD remains bullish – Forecast today – 24-11-2025

By |2025-11-24T11:41:06+02:00November 24, 2025|Forex News, News|0 Comments


The EURNZD price is forced to form mixed trading, despite its stability within the bullish channel’s levels, affected by the strength of the barrier of 2.0635, fluctuating near 2.0550 level, taking advantage of the continuation of the support stability at 2.0410, increasing the chances of gathering the required bullish momentum of resuming the bullish attack.


Stochastic fluctuation below 80 level confirms the effect of the temporary sideways bias dominance, to keep waiting for gathering bullish momentum to ease the mission of surpassing the barrier at 2.0635, to begin targeting the extra stations near 2.0700 and 2.0760.


The expected trading range for today is between 2.0475 and 2.0635


Trend forecast: Bullish


Source link

24 11, 2025

The GBPJPY gathers some gains– Forecast today – 24-11-2025

By |2025-11-24T11:20:03+02:00November 24, 2025|Forex News, News|0 Comments

The GBPJPY pair ended its last bullish rally by recording the target at 206.90, facing strong barriers to push it to activate the attempts of gathering the gains by reaching 204.30, to provide some sideways trading by its fluctuation near %2.00 Fibonacci extension level at 205.20.


Note that stochastic exit from the overbought level might force the price to resume the bearish corrective attempts, to renew the pressure on 204.20 level, then wait for testing extra support at 203.75. 


The expected trading range for today is between 204.30 and 205.70


Trend forecast: Bearish


Source link

Go to Top