About Editorial team of BIPNs

Main team of content of bipns.com. Any type of content should be approved by us.
22 01, 2026

Pound to Dollar Forecast: “Sell America” Risks Test GBP/USD Near 1.35

By |2026-01-22T02:53:50+02:00January 22, 2026|Forex News, News|0 Comments


– Written by

The Pound to Dollar exchange rate (GBP/USD) has edged closer to 1.35 as renewed dollar weakness offsets a softer risk backdrop, with markets increasingly focused on US political risks rather than UK fundamentals.

GBP/USD Forecasts: Trump Agenda Dominates

The Pound to Dollar (GBP/USD) exchange rate held above 1.3400 in Asia on Tuesday and has advanced to highs just below 1.3500 amid dollar losses. Major GBP/USD resistance levels come in above 1.3550.

Risk conditions are likely to dominate and a key issue will be whether the dollar can gain defensive support or whether there is a renewed sell-off in the currency amid fears over the US outlook. If equities continue to slide, it will be tough for the Pound to make headway.

The key issues are likely to be intense uncertainty and higher volatility with a focus on rhetoric at the Davos gathering.

RBC Capital Markets has a year-end GBP/USD target of 1.36 and added; “while some cable downside risks can be priced out of 2026, new uncertainties may emerge.”

Geo-political developments have dominated with further concerns over the US threat of tariffs on eight European countries if there is no deal on Greenland.

Save on Your GBP/USD Transfer

Get better rates and lower fees on your next international money transfer.
Compare TorFX with top UK banks in seconds and see how much you could save.


Compare the Best GBP/USD Rates »

The dollar has been hurt by renewed talk of a sell America mentality, especially with the risk of retaliation from Europe. Overall risk appetite, however, has dipped again with sharp losses for equities.

Adding to the sense of unease has been a highly critical post from Trump calling the UK deal on the Chagos Islands as an act of great stupidity.

Markets are also still having to deal with uncertainty surrounding Federal Reserve independence.

According to MUFG; “The trade uncertainty, Fed independence threats, and Trump’s approach to geopolitics generally are all factors that could result in a sudden pick up in appetite for reducing US dollar exposures. The cost involved in that should also cheapen if we see the Fed deliver further rate cuts this year.”

ING notes that US assets are still performing well and added; “until the performance outlook for those assets significantly shifts, we are unlikely to see a significant exodus of European capital from the US.”

It added; “That said, we are a little negative on the dollar this year for macro reasons. But a 10% sell-off akin to last April’s ‘sell America’ theme looks unlikely.”

As far as data is concerned, the UK unemployment rate held at 5.1% in the three months to November, matching the 4-year high, and in line with consensus forecasts.

The ONS reported a 33,000 decline in payrolls for November with a provisional decline of 43,000 for December.

Headline average earnings growth slowed to 4.7% from 4.8% with underlying growth at 4.5% from 4.6% previously and in line with expectations.

There was no shift in Bank of England expectations with markets not expecting a February cut.

Like this piece? Please share with your friends and colleagues:


International Money Transfer? Ask our resident FX expert a money transfer question or try John’s new, free, no-obligation personal service! ,where he helps every step of the way,
ensuring you get the best exchange rates on your currency requirements.

TAGS: Pound Dollar Forecasts

Source link

21 01, 2026

Why is Natural Gas Soaring Today? Short Squeeze and Freeze-Off Risks Drive Prices Toward $5.00

By |2026-01-21T22:59:36+02:00January 21, 2026|Forex News, News|0 Comments


Colder Forecasts and Short-Covering Drive the Rally

Traders are blaming the price surge on colder U.S. weather forecasts and short-covering as key factors behind the move. Attention now turns to Thursday’s U.S. government storage report and fresh demand figures due in late January.

Weekend Forecast Shift Triggers Aggressive Buying

After hitting a multi-month low last week, prices consolidated for a couple of days ahead of the weekend. However, a gap higher opening Sunday night set in motion the current price spike. The initial move was fueled by a shift in the 10-15 day forecast over the weekend. The sudden shift is driving traders to rapidly adjust heating demand forecasts, catching some bearish bets off guard.

Front-Month Squeeze Amplifies Price Action

The rally comes about a week before the near-month futures rollover from the February to March contract. The front or prompt month is crucial because that is where the physical squeeze hits first. When the front-month contract is set off by weather, prices jump because short-sellers, caught on the wrong side of the trade, will pay almost anything to get out of their positions or risk turning winning trades into losing ones. Typically, utilities and industrial buyers, who haven’t hedged their purchases, often face sharp price increases, and are forced to pay up.

Sharpest Gain Since January 2022

On Tuesday, for example, the jump in February futures was its sharpest gain since January 2022. Traders pointed toward short-covering as the main reason for the price spike after U.S. CFTC data revealed speculative short positions hitting their highest level since November 2024.

Demand Surge and Freeze-Off Risks Loom

Not only is total demand, including exports, set to rise next week with some models showing an increase of more than 200 billion cubic feet in implied demand since Friday, but with more cold weather approaching, Energy Intelligence is warning of potential freeze-off risks. This could produce supply disruptions, new price spikes and potential power outages.

Technical Outlook: Uptrend Confirmed with Key Breakouts


Source link

21 01, 2026

USD/JPY Forecast Today 21/01: Major Volatility (Chart)

By |2026-01-21T22:52:33+02:00January 21, 2026|Forex News, News|0 Comments

The US dollar has been very noisy against the Japanese yen on Tuesday as we see the JGB markets show signs of stress.

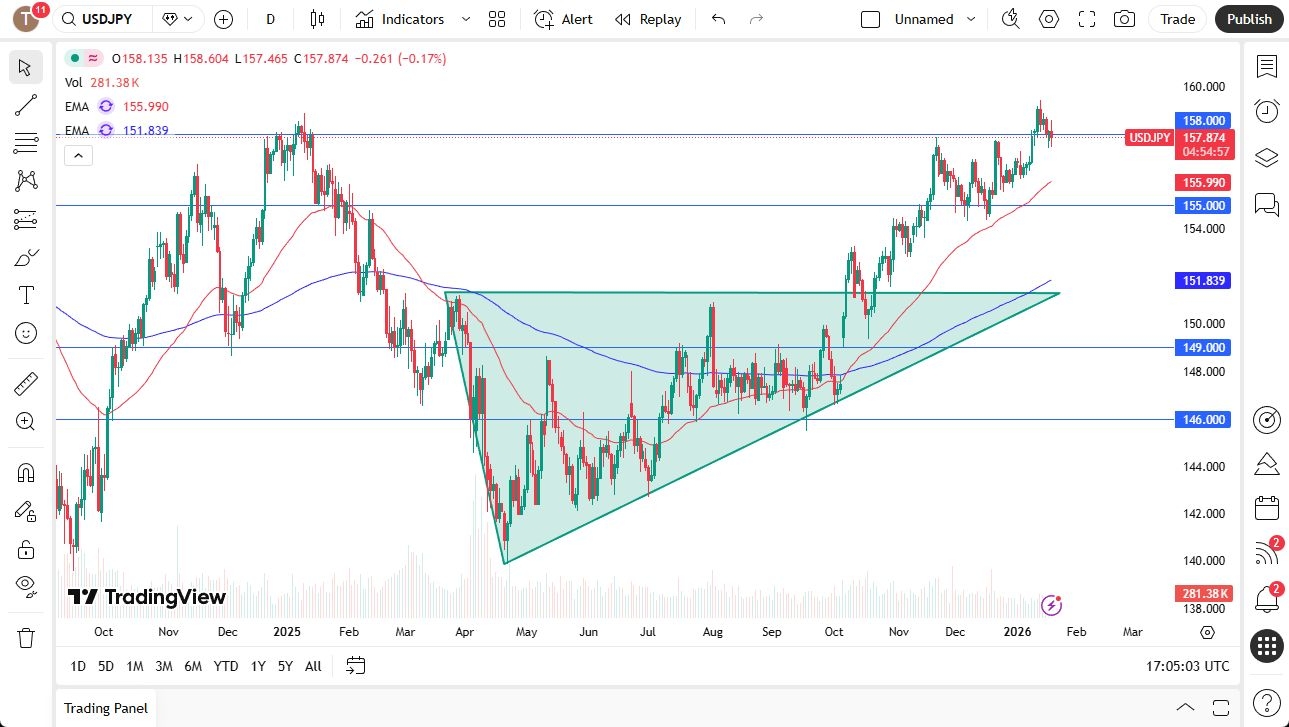
The US dollar has been very noisy against the Japanese yen during the bulk of the Tuesday trading session, as we continue to see a lot of noisy action. That being said, you should also pay close attention to the fact that the Japanese bond market is showing extreme stress and volatility, so this is going to make the Japanese yen very difficult to get a handle on in the short term.

That being said, longer term, we certainly have a lot of upward pressure at this point with the 158 yen level being a bit of a magnet, and I think the 160 yen level being a bit of a target. Short-term pullbacks would open up the possibility of buying opportunities with the 156 yen level offering support at the 50-day EMA.

The 50-day EMA, of course, is an indicator that I think a lot of people will continue to look at as a potential trend line. To the upside, I do think that we could eventually go looking to the 162 yen level after we get above 160 yen, but I think that would take a certain amount of momentum.

The Carry Trade Is Still Alive

Keep in mind that the carry trade is still very much alive, and of course, the US dollar does pay you to hold it against the Japanese yen despite the fact that yields are rising in Japan, because that’s a sign of stress.

That will be very volatile, and I think at this point in time, the market is trying to tell Japan you are not going to be able to raise rates too much, and therefore, the Bank of Japan may find itself acquiescing. There is the possibility of intervention, but intervention just gets bought into before it’s all said and done, as we have seen multiple times.

Want to trade our USD/JPY forex analysis and predictions? Here’s a list of forex brokers in Japan to check out.

Source link

21 01, 2026

Platinum price attempts to resume the rise– Forecast today – 21-1-2026

By |2026-01-21T18:58:37+02:00January 21, 2026|Forex News, News|0 Comments


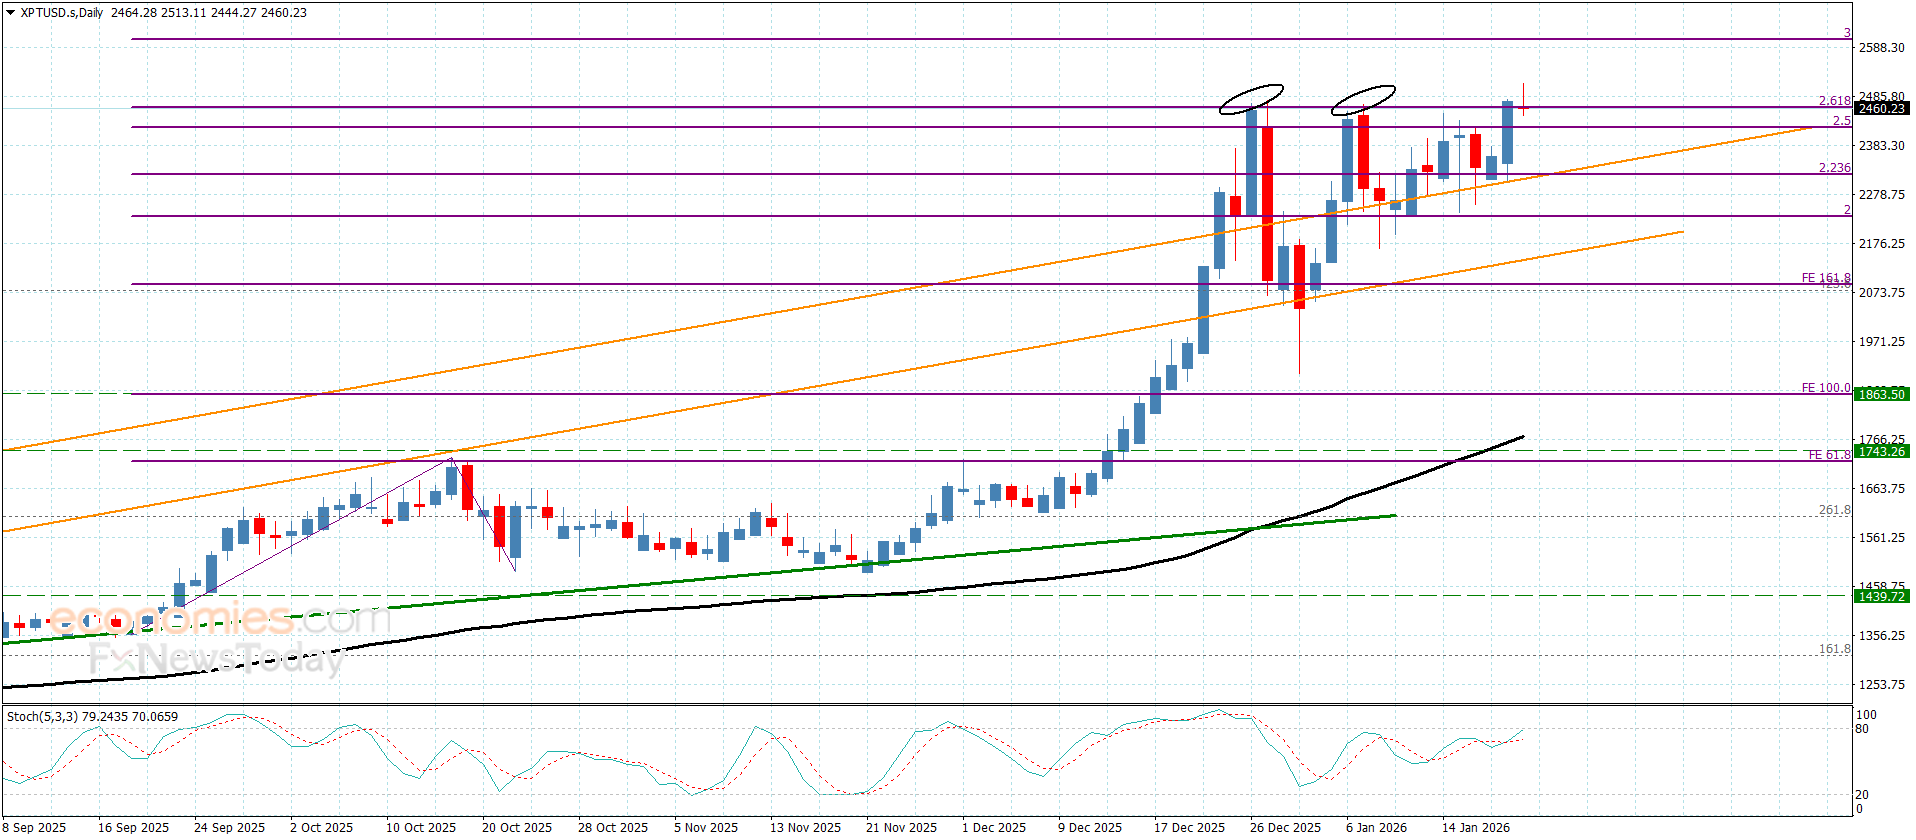
Copper price remains affected by the contradiction between the main indicators besides the negative stability below $5.9700 barrier, which obstructs the chances of renewing the bullish attempts, which increases the chances of forming new bearish corrective waves in the near period, to expect targeting $5.6500 level, reaching the initial main support at $5.5100.


While the price success in breaching the barrier and holding above it will open the way for recording new historical gains, to expect reaching the resistance of the bullish channel at $6.1900, and surpassing it will confirm its move to new bullish station in the futuristic trading.


The expected trading range for today is between $5.6500 and $5.9500


Trend forecast: Bearish


Source link

21 01, 2026

EUR/USD Analysis Today 21/01: Stable Below 1.1800 (Chart)

By |2026-01-21T18:50:39+02:00January 21, 2026|Forex News, News|0 Comments

EUR/USD Analysis Summary Today

  • Overall Trend: Bearish Technical Correction
  • Support Levels for EUR/USD Today: 1.1590 – 1.1530 – 1.1440
  • Resistance Levels for EUR/USD Today: 1.1800 – 1.1860 – 1.1920

EUR/USD Trading Signals:

  • Buy EUR/USD from the support level of 1.1650 with a target of 1.1800 and a stop-loss at 1.1560.
  • Sell EUR/USD from the resistance level of 1.1800 with a target of 1.1500 and a stop-loss at 1.1880.

Technical Analysis of EUR/USD Today:

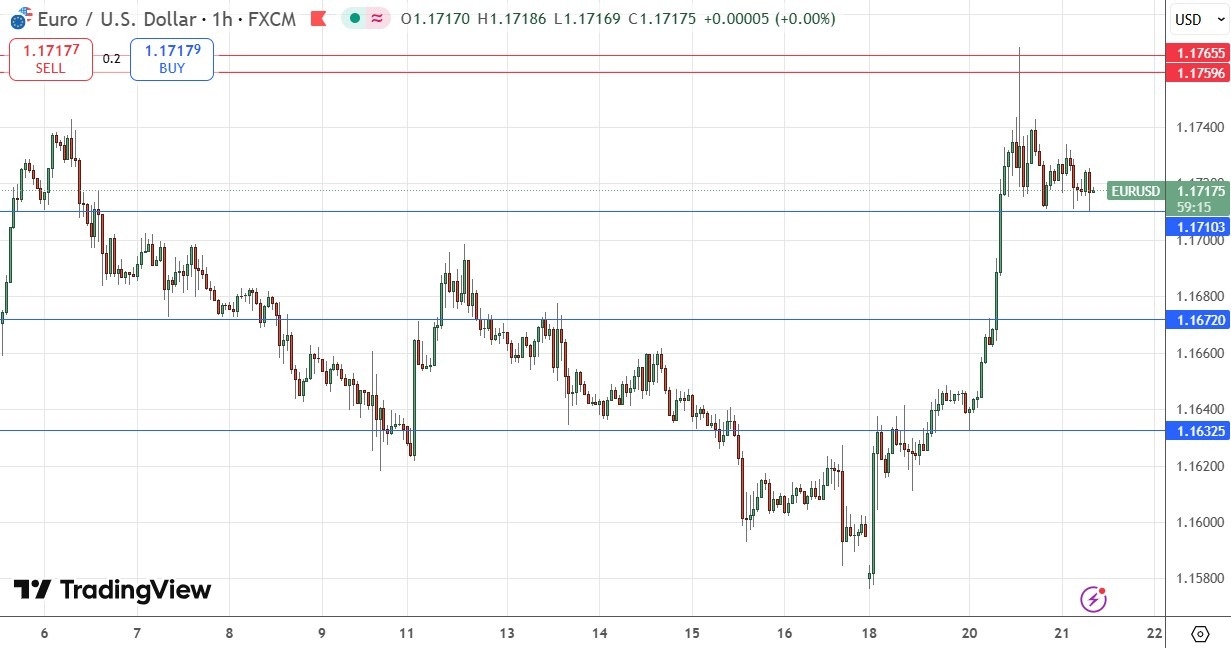
For two consecutive sessions, the EUR/USD pair has been rebounding from the support level of 1.1576 – the pair’s lowest level in two months. Gains extended to the resistance level of 1.1768, and the price is currently stabilizing around 1.1730 at the time of writing. According to performance on reliable trading platforms, the “Greenland Deal” continues to dominate the narrative for the second straight day, as traders begin to fear this is more than just a passing headline.

Generally, financial markets perceive heightened risks associated with the confrontation between the United States and Europe over the Greenland issue. As of Tuesday, Trump did not appear willing to back down from his stance on annexing Greenland to the United States, meaning that the UK and the EU will face a 10% tariff starting February 1st.

According to Forex market activity, the U.S. Dollar tends to decline as investors realize the negative economic impact of tariffs, which are largely borne by American consumers. Conversely, the Euro tends to benefit as a “large” and more liquid alternative to the U.S. Dollar, even if it is the party directly hit by Trump’s tariffs.

In general, Trump’s recent statements represented a new escalation in the Greenland dispute and confirmed the deterioration in relations between the United States and the European Union, keeping financial markets on edge. However, the euro avoided sustained losses. Its strong inverse relationship with the US dollar (USD) provided some protection, as the dollar came under pressure following Trump’s latest tariff threat.

EUR/USD Opportunities for a Bearish Breakout

The EUR/USD pair’s upward trend, as seen on the daily chart, could gain positive momentum if bulls manage to push the currency above the psychological resistance level of 1.1800. Recent gains have pushed the 14-day Relative Strength Index (RSI) towards 57, away from the neutral line, suggesting bullish momentum towards stronger upward levels if investor sentiment improves amid the recent US-EU dispute over the Greenland trade deal. Technically, the MACD indicator is also trending upwards, awaiting further positive momentum.

A EUR/USD a bearish scenario on the daily chart would require bears to push the currency back towards the support levels of 1.1655 and 1.1580, respectively. The EUR/USD’s direction today will be influenced first by statements from European Central Bank President Lagarde at 9:30 AM Egypt time. Then, most importantly, statements from US President Trump at 3:30 PM Egypt time.

Trading Advice:

We advise waiting for the EUR/USD to break through the 1.1800 resistance level before considering selling again. However, never take risks, no matter how strong the available currency trading opportunities may seem.

Ready to trade our daily Forex analysis? We’ve made this forex brokers list for you to check out.

Source link

21 01, 2026

XAG/USD wobbles near all-time highs around $96 ahead of Trump’s speech

By |2026-01-21T14:57:52+02:00January 21, 2026|Forex News, News|0 Comments


Silver price (XAG/USD) turns sideways near the all-time high of 95.90 during the early European session on Wednesday. The white metal consolidates as investors await speech from United States (US) President Donald Trump in the World Economic Forum (WEF) at Davos, scheduled at 13:00 GMT.

Trump’s speech will be closely watched by financial market participants as it will indicate what other measures Washington has at disposal to extend the pressure on European Union (EU) members, who are opposing US intentions to acquire Greenland.

So far, US President Trump has announced 10% tariffs on several EU members and the United Kingdom (UK), which will become effective from February 1, and has threatened that he could raise them further.

The appeal of safe-haven assets, such as Silver, has strengthened, in an uncertain geopolitical environment. However, the appeal of US Dollar (USD) and US assets has diminished amid US-EU disputes. Technically, weak US Dollar makes the Silver price an attractive bet for investors.

In response, EU members have called Trump’s tariff threats as “undesirable” and warned of equal retaliatory measures. French President Emmanuel Macron has condemned Trump’s tariff tactic and has stressed the old continent to invoke “anti-coercion instrument”.

Silver price technical analysis

In the daily chart, XAG/USD trades at $94.92. Price holds well above the rising 20-Exponential Moving Average (EMA) at $82.96, keeping the bullish trend intact. The 20-day EMA’s upward slope reinforces positive momentum.

The 14-day Relative Strength Index (RSI) at 73.38 (overbought) underscores strength, though stretched readings could precede brief consolidation.

The distance above the moving average has widened, and trend extension prevails while pullbacks could stall near the rising mean. A close back below the average would weaken the setup, whereas continued acceptance above it would favor further upside. RSI has stayed elevated through recent sessions, confirming momentum; a moderation toward neutral would reset conditions without undermining the broader advance.

(The technical analysis of this story was written with the help of an AI tool.)

Silver FAQs

Silver is a precious metal highly traded among investors. It has been historically used as a store of value and a medium of exchange. Although less popular than Gold, traders may turn to Silver to diversify their investment portfolio, for its intrinsic value or as a potential hedge during high-inflation periods. Investors can buy physical Silver, in coins or in bars, or trade it through vehicles such as Exchange Traded Funds, which track its price on international markets.

Silver prices can move due to a wide range of factors. Geopolitical instability or fears of a deep recession can make Silver price escalate due to its safe-haven status, although to a lesser extent than Gold’s. As a yieldless asset, Silver tends to rise with lower interest rates. Its moves also depend on how the US Dollar (USD) behaves as the asset is priced in dollars (XAG/USD). A strong Dollar tends to keep the price of Silver at bay, whereas a weaker Dollar is likely to propel prices up. Other factors such as investment demand, mining supply – Silver is much more abundant than Gold – and recycling rates can also affect prices.

Silver is widely used in industry, particularly in sectors such as electronics or solar energy, as it has one of the highest electric conductivity of all metals – more than Copper and Gold. A surge in demand can increase prices, while a decline tends to lower them. Dynamics in the US, Chinese and Indian economies can also contribute to price swings: for the US and particularly China, their big industrial sectors use Silver in various processes; in India, consumers’ demand for the precious metal for jewellery also plays a key role in setting prices.

Silver prices tend to follow Gold’s moves. When Gold prices rise, Silver typically follows suit, as their status as safe-haven assets is similar. The Gold/Silver ratio, which shows the number of ounces of Silver needed to equal the value of one ounce of Gold, may help to determine the relative valuation between both metals. Some investors may consider a high ratio as an indicator that Silver is undervalued, or Gold is overvalued. On the contrary, a low ratio might suggest that Gold is undervalued relative to Silver.


Source link

21 01, 2026

The GBPJPY rebounces after recording the target– Forecast today – 21-1-2026

By |2026-01-21T14:50:13+02:00January 21, 2026|Forex News, News|0 Comments

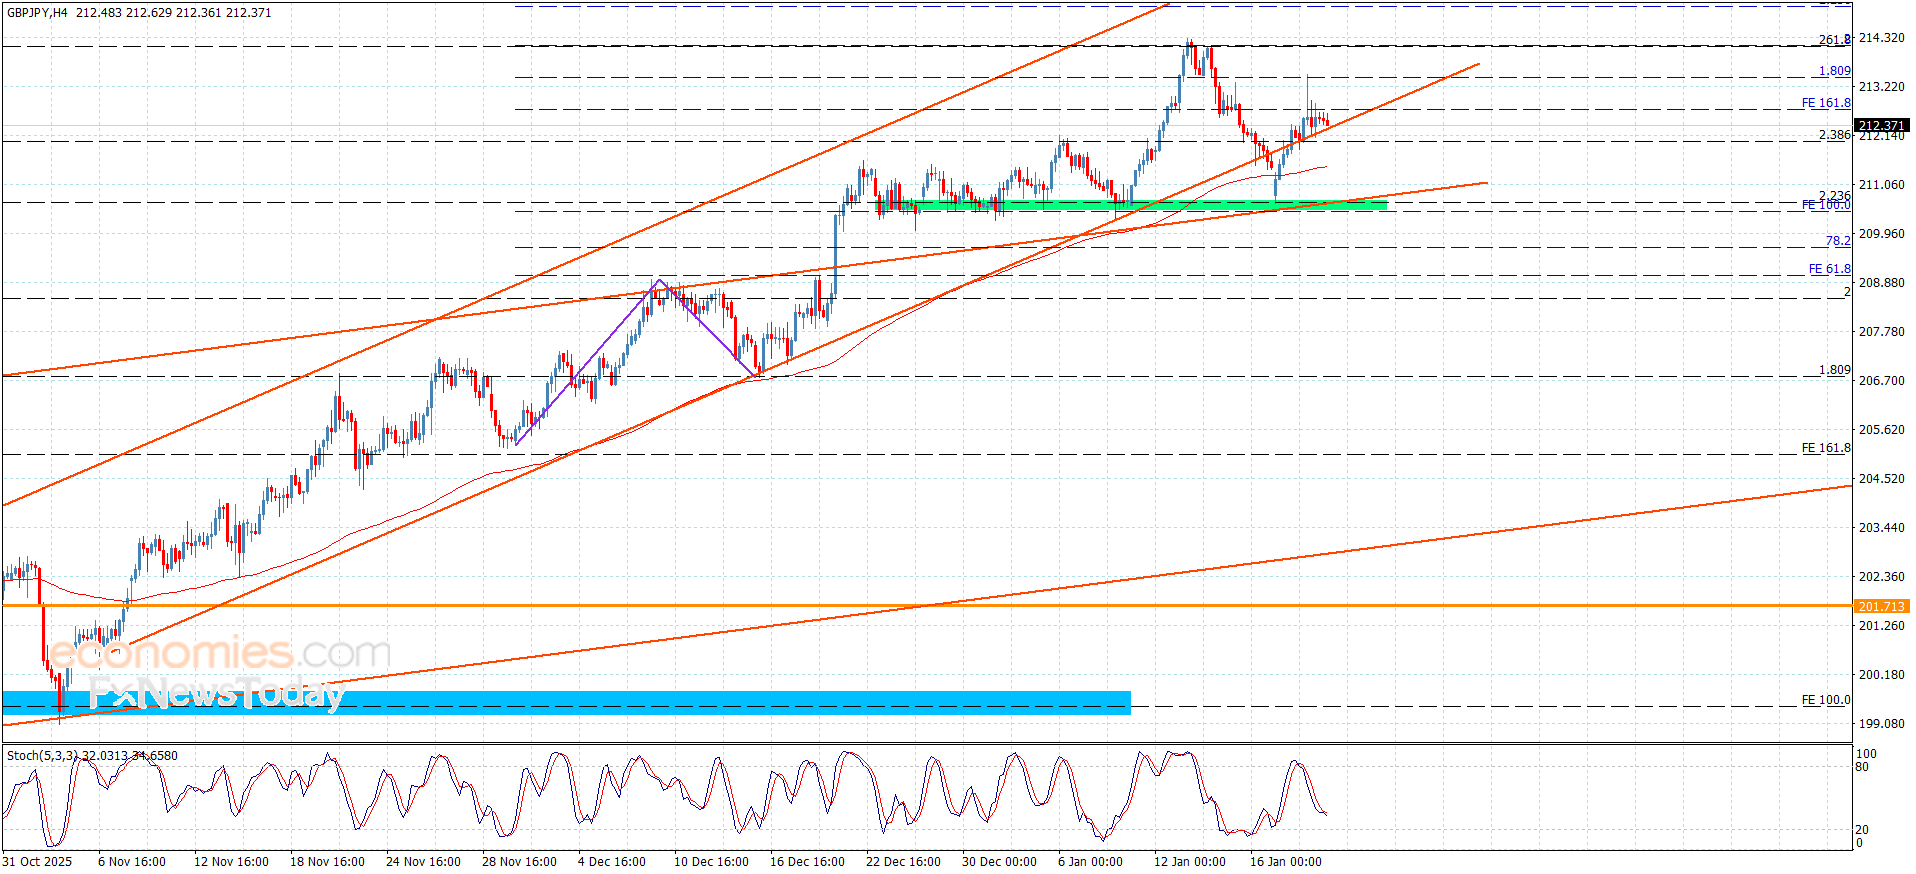
The GBPJPY pair ended its last bullish rally by recording the target at 213.45, to form a strong obstacle against the attempts of resuming the bullish trend, which forces it to activate with the stochastic negativity by forming corrective rebound, to notice testing the bullish channel’s support at 212.30.


Reminding you that the repeated rise above 212.00 level which represents %2.380 Fibonacci extension level supports the chances of renewing the bullish attempts, to expect targeting 213.00 level, to attempt to surpass the mentioned obstacle, while declining below 212.00 and providing a negative close will confirm its surrender to the dominance of the bearish corrective bias, to expect suffering some losses by reaching 211.45 initially.


The expected trading range for today is between 212.00 and 213.45


Trend forecast: Bullish


Source link

21 01, 2026

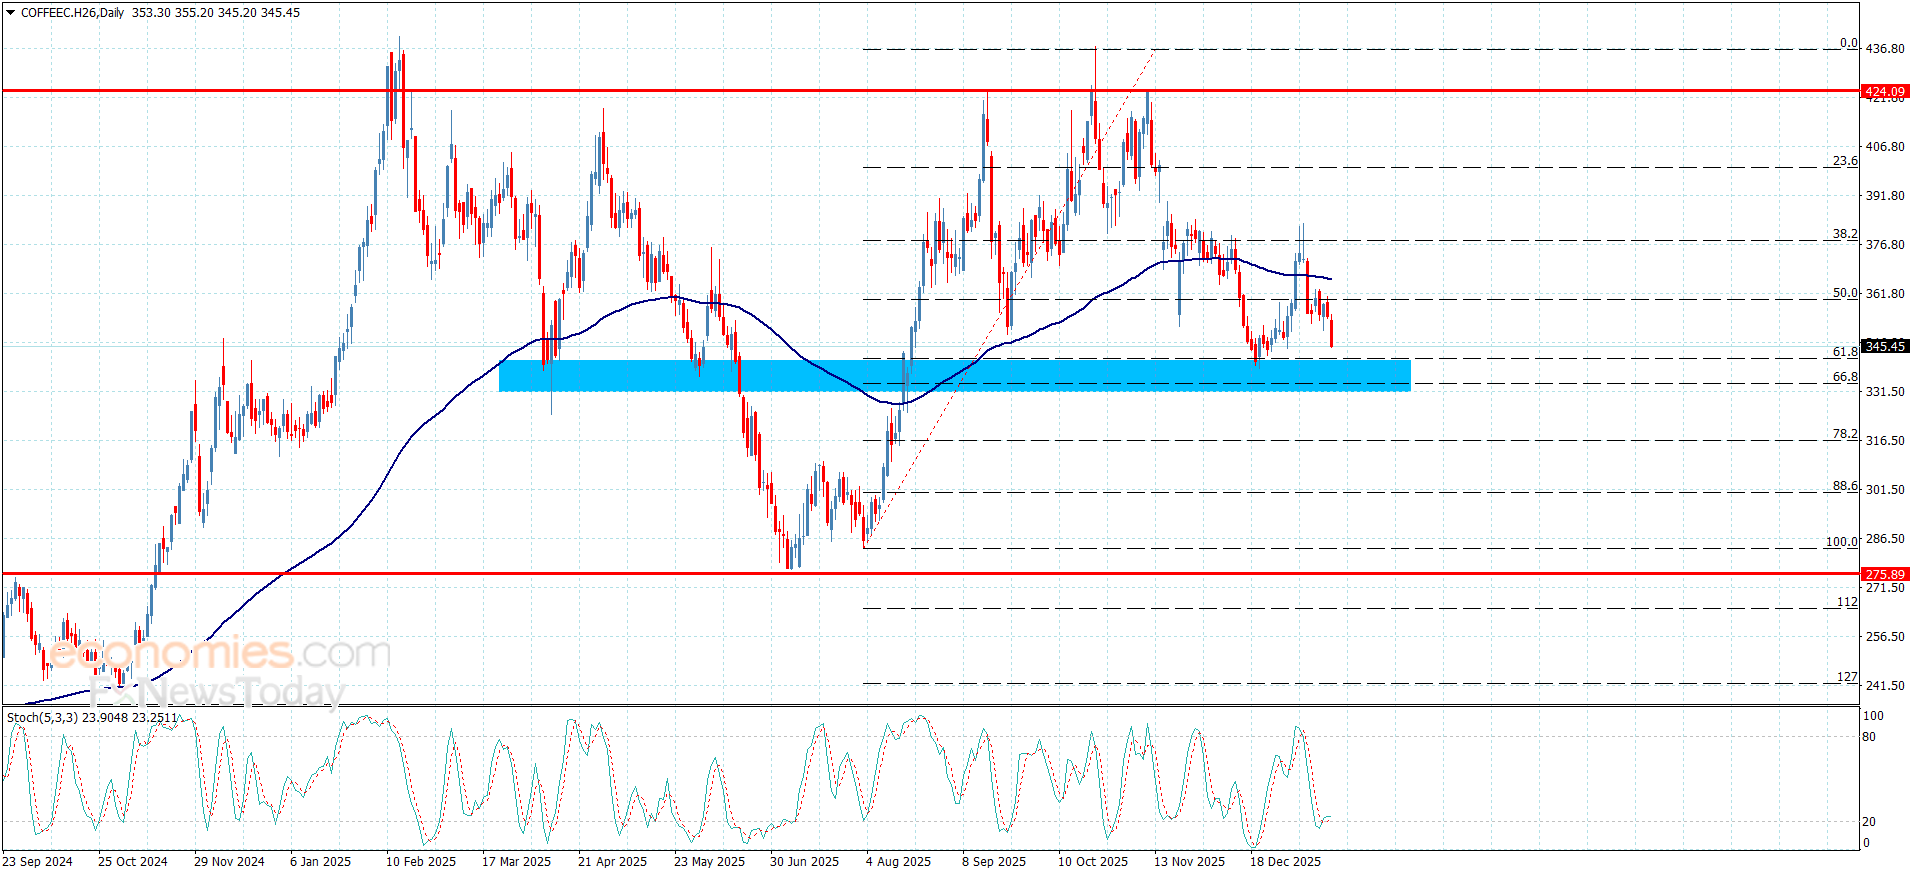
Coffee price is under negative effect – Forecast today – 21-1-2026

By |2026-01-21T10:56:40+02:00January 21, 2026|Forex News, News|0 Comments


Natural gas price continued forming strong bullish waves since yesterday, to notice achieving the suggested targets by reaching $4.00 level, to reach the support of the broken bullish channel’s support, which represents a key resistance.


Noticing that stochastic begins to exit the oversold level, attempting to provide a new bullish momentum, to increase the chances of surpassing the current resistance, and its stability above this level will confirm its readiness to record new gains by its rally towards $4.185, while the failure to breach it will support the dominance of the sideways bias in the current trading, and there is a chance to retest $3.620 level before reaching extra bullish target.


The expected trading range for today is between $3.780 and $4.185


Trend forecast: Bullish


Source link

21 01, 2026

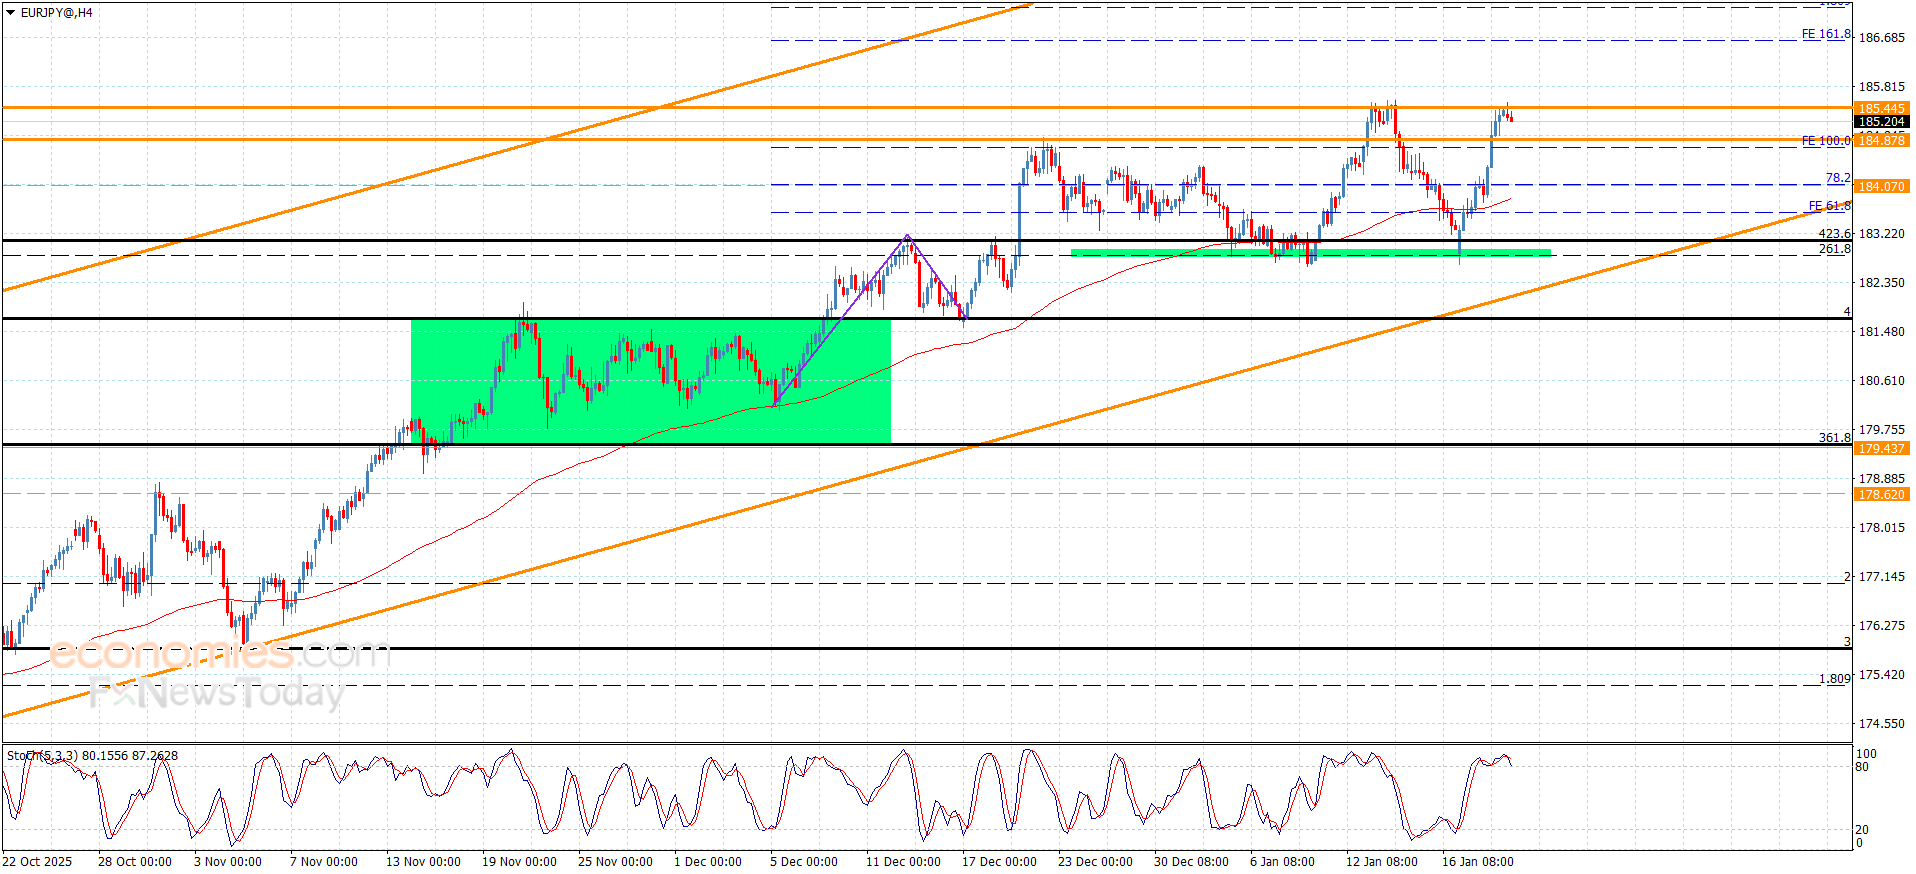
The EURJPY reaches the top again– Forecast today – 21-1-2026

By |2026-01-21T10:48:48+02:00January 21, 2026|Forex News, News|0 Comments

The GBPJPY pair ended its last bullish rally by recording the target at 213.45, to form a strong obstacle against the attempts of resuming the bullish trend, which forces it to activate with the stochastic negativity by forming corrective rebound, to notice testing the bullish channel’s support at 212.30.


Reminding you that the repeated rise above 212.00 level which represents %2.380 Fibonacci extension level supports the chances of renewing the bullish attempts, to expect targeting 213.00 level, to attempt to surpass the mentioned obstacle, while declining below 212.00 and providing a negative close will confirm its surrender to the dominance of the bearish corrective bias, to expect suffering some losses by reaching 211.45 initially.


The expected trading range for today is between 212.00 and 213.45


Trend forecast: Bullish


Source link

21 01, 2026

Gold rises above $4,750 amid US-Europe tensions

By |2026-01-21T06:56:03+02:00January 21, 2026|Forex News, News|0 Comments


Gold price ( XAU/USD) climbs to near $4,775 during the early Asian trading hours on Wednesday. The precious metal extends the rally and is poised for another record high amid a time of political and economic uncertainty. The speech by US President Donald Trump at the World Economic Forum in Davos, Switzerland, will be in the spotlight later on Wednesday. 

Traders continue to pile into safe-haven assets amid tensions between the US and Europe over Greenland. US President Donald Trump over the weekend threatened to impose tariffs on eight European nations that oppose his plans to take control of Greenland. 

The BBC reported on Wednesday that the European Parliament is planning to suspend approval of the US trade deal agreed in July, according to sources close to its international trade committee. The suspension is scheduled to be announced in Strasbourg, France, on Wednesday. Escalation in tensions between the US and Europe could boost traditional safe-haven assets such as Gold in the near term. 

Traders push back their bets that the US Federal Reserve (Fed) would cut interest rates later this month after signs of an improving US labour market. Traders are now pricing in the next rate reduction coming in June, the month after Fed Chair Jerome Powell’s tenure ends, with another easing to follow in the fourth quarter. The view that the US central bank can keep interest rates higher for longer generally underpins the US Dollar (USD) and weighs on the non-interest-bearing assets like Gold.

Gold FAQs

Gold has played a key role in human’s history as it has been widely used as a store of value and medium of exchange. Currently, apart from its shine and usage for jewelry, the precious metal is widely seen as a safe-haven asset, meaning that it is considered a good investment during turbulent times. Gold is also widely seen as a hedge against inflation and against depreciating currencies as it doesn’t rely on any specific issuer or government.

Central banks are the biggest Gold holders. In their aim to support their currencies in turbulent times, central banks tend to diversify their reserves and buy Gold to improve the perceived strength of the economy and the currency. High Gold reserves can be a source of trust for a country’s solvency. Central banks added 1,136 tonnes of Gold worth around $70 billion to their reserves in 2022, according to data from the World Gold Council. This is the highest yearly purchase since records began. Central banks from emerging economies such as China, India and Turkey are quickly increasing their Gold reserves.

Gold has an inverse correlation with the US Dollar and US Treasuries, which are both major reserve and safe-haven assets. When the Dollar depreciates, Gold tends to rise, enabling investors and central banks to diversify their assets in turbulent times. Gold is also inversely correlated with risk assets. A rally in the stock market tends to weaken Gold price, while sell-offs in riskier markets tend to favor the precious metal.

The price can move due to a wide range of factors. Geopolitical instability or fears of a deep recession can quickly make Gold price escalate due to its safe-haven status. As a yield-less asset, Gold tends to rise with lower interest rates, while higher cost of money usually weighs down on the yellow metal. Still, most moves depend on how the US Dollar (USD) behaves as the asset is priced in dollars (XAU/USD). A strong Dollar tends to keep the price of Gold controlled, whereas a weaker Dollar is likely to push Gold prices up.


Source link

Go to Top