About Editorial team of BIPNs

Main team of content of bipns.com. Any type of content should be approved by us.
13 12, 2025

WTI at $57 and Brent at $61 as 2026 Glut Builds

By |2025-12-13T03:36:52+02:00December 13, 2025|Forex News, News|0 Comments


Global Benchmarks WTI (CL=F) And Brent (BZ=F) Locked In The High 50s And Low 60s

Spot Levels Spreads And What They Signal About The Barrel

U S benchmark WTI crude CL=F trades around 57 30 dollars, down roughly 0 30 dollars, which is about 0 52 percent on the day. Sea borne benchmark Brent BZ=F sits near 60 96 dollars, off about 0 32 dollars, also around 0 52 percent lower. That leaves Brent carrying a premium of roughly 3 7 dollars per barrel over WTI, which is consistent with a market that is oversupplied but still pays extra for seaborne flexibility and non U S grades.

Other key blends confirm the same soft structure. Murban crude trades close to 62 00 dollars and is down almost 0 93 percent. Louisiana Light sits near 59 62 dollars with only a mild decline, while the OPEC Basket is around 61 28 dollars and down just under 1 percent. Heavy sour Mars U S, which is structurally tighter because of sanctions and refining demand, still trades near 70 36 dollars even after a decline of about 1 35 percent. Premium West African Bonny Light remains elevated near 78 62 dollars despite a nearly 2 84 percent drop.

Refined products and U S gas also point to pressure. Gasoline is trading around 1 749 dollars per gallon and slipping by a little more than half a percent. U S natural gas sits near 4 088 dollars with a loss of about 3 38 percent. When crude benchmarks, refined products and gas move lower together, the message is simple. Demand is not tight enough to absorb the available molecules, and the market is trading barrels on an oversupply narrative, not on a scarcity story.

Structural Oversupply Keeps WTI CL=F And Brent BZ=F Under A Downward Bias

The forward balance explains why every short term bounce in CL=F and BZ=F is being faded. The latest global outlook projects a 2026 oil surplus of 3 84 million barrels per day. That figure is only reduced by 250 thousand barrels per day from the prior month, but the composition matters. Expected demand growth is around 860 thousand barrels per day, while supply growth is near 2 4 million barrels per day. In other words, supply is rising at almost three times the pace of demand.

In that environment, the high 50s on WTI and just above 60 dollars on Brent are not anomalies. They are exactly where the strip should trade when the next year’s projected glut is measured in millions of barrels per day rather than a marginal imbalance. The problem is not a lack of awareness among producers either. Canada’s Cenovus plans to increase oil output into 2026. Suncor targets a major production boost over the same horizon. Equinor is deploying roughly 400 million dollars to lift volumes at a new Arctic oilfield. An Australian state has launched its first gas tender in seven years. None of these moves reflects a producer base preparing for scarcity. They reflect a supply side that is still building capacity even as balances already point to surplus.

For WTI CL=F, which sits around 57 30 dollars, this supply backdrop is exactly why rallies into the low 60s keep reversing. The global barrel is long, and every extra dollar on the screen is an invitation for producers and hedgers to sell forward.

Russian Revenues Urals Discounts And The Brent BZ=F Risk Premium Cap

Russian fundamentals play directly into the Brent curve and the discounts versus benchmark. In December, Russia’s combined oil and gas revenues are projected around 5 15 billion dollars, equivalent to roughly 410 billion rubles. That is almost 50 percent lower than the same month a year earlier and represents the weakest level since August 2020, when revenues hovered near 5 1 billion dollars, or about 405 billion rubles, during the pandemic demand collapse.

In November, Russian oil and gas revenues already fell about 35 percent year on year as the price of Russian crude slumped while the ruble strengthened. Total oil exports including crude and products dropped by roughly 420 thousand barrels per day to 6 9 million barrels per day as buyers reassessed the sanctions risk on Russia’s biggest exporters. The fall in flows combined with weaker prices and a wider Urals discount cut Russian oil revenues to about 11 billion dollars, down roughly 3 6 billion dollars from a year before.

Even with the pressure, Russia produced around 9 367 million barrels per day in the last reading, only 10 thousand barrels per day above October and still about 165 thousand barrels per day below its formal OPEC plus quota. For the global benchmark BZ=F, the important point is not only volume but price. A wider Urals discount into Asia puts persistent downward pressure on other sour and medium grades. Asian refiners that can run discounted Urals do not need as much Brent linked crude at full price. That weakens the ability of Brent to build a sustained risk premium, which is why BZ=F trades near 60 96 dollars with a soft tone even as sanctions tighten around Russian flows.

China And India Redirect The Physical Barrel And Undercut WTI CL=F Exports

The trade flows behind CL=F and BZ=F are being reshaped by China and India as they chase discounts and differential cuts. Chinese term buyers have requested about 49 5 million barrels of Saudi crude, a sharp rise from roughly 36 million barrels the previous month. This change came after Saudi Aramco cut the Arab Light differential to the weakest level in almost five years. That price cut made Saudi barrels more competitive against both Russian and Atlantic Basin grades, anchoring more Chinese demand to Middle Eastern supply.

India continues to exploit discounted Russian barrels. Russian oil imports into India are set to reach a six month high, as refiners are actively seeking non sanctioned Russian cargoes available at deep discounts. Every barrel India pulls from Russia or Saudi Arabia is a barrel it does not need from the U S Gulf Coast or the North Sea.

For U S blends connected to CL=F, this matters directly. Louisiana Light trading near 59 62 dollars shows modest weakness, while Mars U S near 70 36 dollars confirms that sour grades remain tight. The more Russia and Saudi Arabia discount into Asia, the more U S barrels must compete on price to clear exports. That dynamic is what keeps WTI CL=F anchored in the high 50s. When Asian refiners can secure cheaper barrels elsewhere, U S exporters must concede on price or accept lower volumes.

Macro Fed Cuts Tanker Seizures And A Surprisingly Weak Risk Premium In Brent BZ=F

Macro policy and geopolitics are normally bullish inputs for crude. Right now, they are being overwhelmed by fundamentals. The U S Federal Reserve has cut the federal funds rate to a 3 50 percent to 3 75 percent range, which should in theory support commodities and risk assets. At the same time, the administration seized a Venezuelan VLCC named Skipper on its way to Cuba and has signaled its intention to intercept more ships carrying Venezuelan crude. The U S is also preparing to seize additional tankers tied to sanctioned flows, putting segments of the shadow fleet on notice.

Despite all of this, Brent BZ=F trades only slightly above 61 dollars and has recently logged about a 2 percent decline on a day with multiple bullish headlines. The market is effectively saying that rate cuts and tanker seizures are not enough to offset the persistent surplus and soft global demand. Even an oil tanker rate shock, with daily tanker rates reportedly up around 467 percent, is not translating into sustained price strength. Higher freight costs add noise and volatility but do not fix an underlying surplus of crude.

The macro backdrop is not aggressively supportive either. Global electric vehicle growth is slowing in the United States and flattening in China. That moderates long term demand but does not deliver an immediate collapse. Instead, the near term economic picture remains sluggish, reinforcing the idea that energy demand growth will underperform supply growth into 2026. In this environment, traders default to selling rallies in CL=F and BZ=F rather than paying up for barrels on geopolitical fear.

Technical Structure WTI CL=F And Brent BZ=F Behave Like Markets In A Grinding Downtrend

The technical setup for WTI CL=F and Brent BZ=F is aligned with the fundamental story. On WTI, price gapped higher at the Friday open and then faded, closing the gap and drifting lower. The chart shows a well defined downtrend line and a 50 day exponential moving average acting together as a ceiling. Every push toward that confluence is rejected, turning short term strength into an opportunity for short entries rather than the start of a trend reversal. Only a decisive move above 60 dollars would even open a discussion about a run toward 62 dollars, and the tape is not showing that kind of momentum right now. Instead, the prevailing pattern is a gentle but persistent grind lower with rallies failing quickly.

For Brent BZ=F, price also opened higher but then reversed, treating 60 dollars as a fragile floor rather than a robust base. The 60 dollar mark is a round psychological level and a technical pivot. Holding above it keeps the market in a controlled slide. A break below it would be an unambiguous negative signal and could drag both Brent and WTI into deeper losses as funds reprice their early 2026 assumptions. In practice, that would align price action with the forecast that sees oil trading near 60 dollars next year. The market appears to be front loading that forecast today.

Gas Products Nigeria Pipeline Incident And The Broader Energy Tape Around Crude

Outside crude, the rest of the energy complex is confirming the soft tone rather than contradicting it. U S natural gas trading near 4 088 dollars and down more than 3 percent indicates that even winter pricing is struggling against supply and storage. Gasoline at 1 749 dollars per gallon and modestly weaker shows that refined product demand is not tight enough to pull crude higher.

In Nigeria, an explosion on the Escravos Lagos gas pipeline occurred on the evening of December tenth near communities in Delta State. The event caused a pressure drop consistent with a loss of containment and forced the operator to activate emergency response procedures. The line is a significant conduit of gas to industrial users and power plants in southwestern Nigeria. The operator has emphasized community safety and environmental protection while the cause is being investigated.

The incident came only days after a deal between the state oil company and Heirs Energies to capture and monetize flared gas at their OML seventeen joint venture near Port Harcourt. Under that arrangement, flared gas will be redeployed into power generation, industrial uses, liquefied petroleum gas and compressed natural gas. This aligns with Nigeria’s gas development and energy transition strategy. However, gas flaring volumes in Nigeria rose about 12 percent in 2024, the second largest increase globally behind Iran. The contrast between rising flaring and efforts to capture gas underscores how much supply remains underutilized. For crude benchmarks, this is further evidence that the broader hydrocarbon system is long molecules, not short.

OPEC Plus New Projects Citi’s 60 Dollar Call And Why The Curve Still Looks Heavy

Forward signals from producers and banks are broadly consistent with the present price zone. A major investment bank projects oil falling toward 60 dollars in early 2026. Brent BZ=F hovering around 61 dollars and WTI CL=F near 57 dollars already reflect that trajectory. The curve is essentially compressing toward that level now instead of waiting a full year.

OPEC is maintaining a bullish narrative on 2026 demand, but its own numbers show a world that is not particularly tight. The forecast of 860 thousand barrels per day demand growth against 2 4 million barrels per day supply growth points squarely to a surplus outcome unless there are fresh and credible cuts. At the same time, producers are not holding back. Cenovus is planning higher output. Suncor is targeting a major production lift. Equinor is spending 400 million dollars to raise flows at an Arctic project. The 44 billion dollar Alaska LNG project has secured a key regulatory approval, moving toward a final investment decision on a supply pipeline in late 2025 and the full project in 2026. Saudi Arabia is signing upstream exploration deals in Syria with the aim of eventually pushing Syrian output back toward 400 thousand barrels per day.

China has added 7 2 gigawatts of coal capacity to reinforce energy security. New energy vehicles in China still sold about 1 82 million units in the latest month, representing 53 2 percent of sales and 21 percent growth. This mix illustrates gradual structural change rather than sudden destruction of oil demand. Combined with expanding oil and gas supply, it reinforces the theme of a heavy barrel in 2026 rather than a tight one.

Geopolitics Shadow Fleet Tanker Rates And Why The Risk Premium Stays Contained

Geopolitical risk is real but insufficient to flip the market’s direction. The United States has already seized a Venezuelan VLCC and is signaling more tanker seizures for sanctioned crude. Parts of the Russian shadow fleet have been hit by explosions or operational disruptions in other regions, and several Russian cargoes have wandered for weeks as sanctions and insurance issues complicate deliveries. Tanker freight rates have surged by several hundred percent, reflecting rerouting, insurance premia and ton mile distortions.

Even with these developments, WTI CL=F remains capped under 60 dollars, and Brent BZ=F trades only marginally above 60 dollars. That tells you that positioning is built around the surplus narrative. Traders are treating disruptions as temporary and reversible events inside a structurally oversupplied system. The risk premium exists but is shallow and short lived, and it is being arbitraged away by the sheer volume of barrels chasing buyers.

Trading Stance On WTI CL=F And Brent BZ=F Tactical Bearish Structural Headwinds Verdict Sell Rallies

When prices volumes balances policy and charts are combined, the conclusion is straightforward. WTI CL=F trades near 57 30 dollars and faces strong resistance below 60 dollars with 62 dollars as a distant upper boundary. Brent BZ=F sits around 60 96 dollars and depends on the 60 dollar line to avoid a deeper leg lower. The projected 3 84 million barrels per day surplus for 2026, the mismatch between 860 thousand barrels per day demand growth and 2 4 million barrels per day supply growth, the steady expansion plans by major producers, and the trend of rallies being sold rather than extended are all aligned.

For WTI CL=F, the rational stance is to treat approaches to the 59 to 62 dollar area as opportunities to sell into strength with initial downside focus on the mid 50s and potential extension into the low 50s if macro data softens further. For Brent BZ=F, the sensible posture is underweight or short biased on moves into the 62 to 65 dollar band, with downside risk into the high 50s if the 60 dollar floor fails.

In practical terms, the tape is not pricing crude as a buy and hold opportunity at current levels. It is pricing CL=F and BZ=F as markets where the path of least resistance remains lower until either credible coordinated cuts remove millions of barrels per day from the forward balance or demand growth accelerates materially above the current 860 thousand barrels per day profile.

That’s TradingNEWS


Source link

13 12, 2025

Myanmar green tea culture poised for UNESCO intangible heritage recognition

By |2025-12-13T02:56:38+02:00December 13, 2025|Dietary Supplements News, News|0 Comments


Discussions between the Ministry of Religious Affairs and Culture, and the Myanmar Tea Association are in progress.

Myanmar’s tea culture will be inscribed on UNESCO’s Representative List of the Intangible Cultural Heritage of Humanity, according to the Ministry of Religious Affairs and Culture.
Myanmar became a State Party to the 2003 Convention for the Safeguarding of the Intangible Cultural Heritage in 2014. For an intangible cultural heritage element to be inscribed on the Representative List, it must first be included on the national list. It is also reported that the Myanmar Cultural Heritage Preservation Committee, the Myanmar Tea Association (MTA – Yangon and Mandalay), and experts from the Ministry of Religious Affairs and Culture are currently discussing the title of the green tea culture heritage element to be submitted for inscription on UNESCO’s Representative List.
The Ministry of Religious Affairs and Culture and the Myanmar Tea Association (Yangon) are jointly completing the UNESCO-specified ICH-02 form to nominate Myanmar’s tea culture for inscription on the Representative List of the Intangible Cultural Heritage of Humanity. The Myanmar Tea Association will also work to obtain the required consent letters and videos, as well as statement letters and videos.
The Myanmar Cultural Heritage Conservation Organization has designated green tea culture as the heritage element to be nominated for inscription on UNESCO’s Representative List of the Intangible Cultural Heritage of Humanity. — ASH/MKKS


Source link

13 12, 2025

XRP Price Prediction: XRP Faces Key $2.17 Resistance While $1.96 Support Holds, Could Mimic 2016 Flash Crash Setup

By |2025-12-13T02:48:25+02:00December 13, 2025|Crypto News, News|0 Comments

XRP is currently navigating a pivotal price range near $2.04, with market participants closely observing whether it can hold above $1.96 support or challenge the $2.17 resistance level.

The cryptocurrency market is paying close attention to Ripple’s XRP as short-term volatility rises amid concentrated supply zones. Glassnode’s on-chain metrics, including the URPD (UTXO Realized Price Distribution), highlight clusters where holders’ cost bases are densest. This provides insight into potential market reactions, making XRP’s current position relevant for both retail and institutional traders.

Key Resistance and Support Levels

Blockchain analytics firm Glassnode identifies three critical price levels for XRP. The $2.17 mark represents a significant resistance area where a large volume of XRP was accumulated. Conversely, $1.96 and $1.78 serve as support zones with high holder concentration.

XRP hovers between key support at $1.96–$1.78 and resistance at $2.17, highlighting critical levels for traders. Source: @alicharts via X

Ali, an on-chain analyst who regularly studies holder distributions and supply clustering, notes, “Breaking $2.17 could relieve short-term profit pressure. Conversely, a drop below $1.96 might trigger increased selling from holders who purchased at higher prices.”

These levels are meaningful because they reflect the underlying distribution of XRP holdings. Traders often watch such zones closely, as moves above resistance or below support can lead to heightened volatility.

Historical Parallels and Scenario Analysis

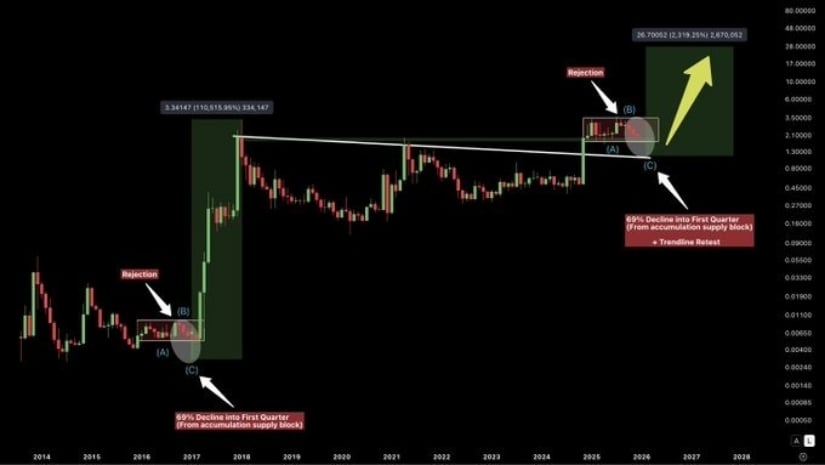
Technical analyst ChartNerd, known for comparing historical crypto cycles, draws a parallel to XRP’s 2016–2017 cycle. After rejecting an accumulation supply block in Q4 2016, XRP experienced a 69% ABC-structured flash crash before eventually surging more than 110,000%.

XRP Price Prediction: XRP Faces Key .17 Resistance While .96 Support Holds, Could Mimic 2016 Flash Crash Setup

XRP could experience a sharp pullback to the low $1 range if a historical ABC flash crash pattern repeats, potentially setting the stage for a long-term rally toward $27 by 2026. Source: @ChartNerdTA via X

ChartNerd notes, “If a similar setup occurs this year, a sharp correction could push XRP toward the low $1 range before stabilizing. This scenario is not a prediction but a historical analogy highlighting potential market behavior under concentrated supply conditions.”

It’s important to contextualize this comparison. XRP’s market today is more mature, with higher liquidity and evolving regulatory oversight, including ongoing Ripple SEC developments. This limits direct parallels with past cycles, meaning historical patterns serve as illustrative rather than predictive tools.

Market Consolidation and Technical Signals

TradingView analyst SwallowAcademy, who focuses on technical analysis of crypto price structures, observes that XRP is currently compressed between established support levels and exponential moving averages (EMAs).

Market Consolidation and Technical Signals

XRP is consolidating between key support and EMAs, creating price pressure that could lead to a stronger move once a breakout occurs, with buyers needing a clear push above EMAs to regain momentum. Source: SwallowAcademy via X

“Price compression between EMAs and support zones often precedes larger moves, as reduced liquidity amplifies volatility,” the analyst explains.

Buyers have maintained the $1.96 support, but regaining momentum may require a clear market structure break (MSB) above the EMAs. A successful breakout could push XRP toward the $2.17 resistance, whereas failure to hold support may increase near-term volatility. Historical patterns indicate that consolidation in such zones typically precedes directional decisions.

XRP Market Outlook

XRP’s current price action is attracting attention from both retail and institutional investors. On-chain data, technical signals, and volume trends suggest that short-term volatility could increase as the cryptocurrency tests its critical levels.

Analysts emphasize that observing multiple indicators together provides a more comprehensive market view. Consolidation near EMAs, coupled with dense holder clusters, often indicates reduced liquidity, which can amplify price swings. Traders should note that while historical analogs provide context, present-market differences, such as regulatory developments and liquidity depth, affect potential outcomes.

Final Thoughts

XRP remains at a key junction, balancing between critical support at $1.96 and resistance near $2.17. While historical analogs highlight potential flash-crash scenarios, current consolidation and multi-month support suggest the market retains stability.

Final Thoughts

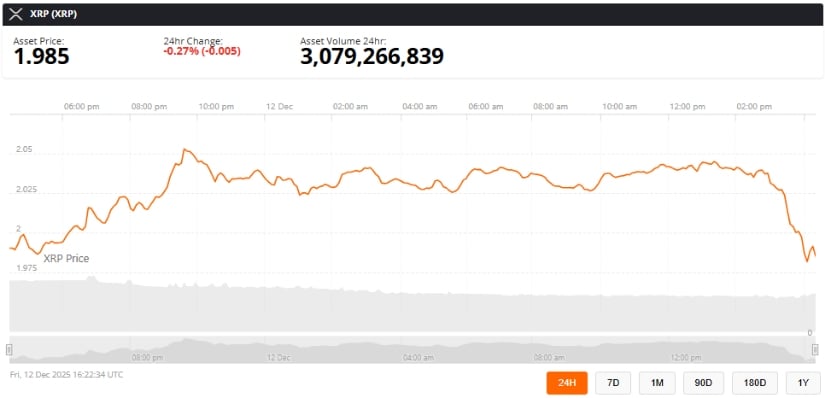
XRP was trading at around 1.98, down 0.27% in the last 24 hours at press time. Source: XRP price via Brave New Coin

Investors and traders are encouraged to monitor on-chain metrics, trading volume, and technical indicators to better understand market dynamics. Combining these insights allows for a more nuanced perspective on XRP’s short- and medium-term outlook while accounting for inherent uncertainties in the cryptocurrency market.

Source link

13 12, 2025

Natural Gas Price Forecast: Tags 50-Day Confluence – Bounce or Breakdown?

By |2025-12-13T01:36:02+02:00December 13, 2025|Forex News, News|0 Comments


Seller Control Persists

Despite arriving at this key confluence, sellers remain in clear control at writing with price pinned near session lows. This keeps today’s $4.07 low vulnerable heading into next week unless a meaningful intraday rally emerges before the close—currently showing no signs of materializing, though the significance of the 50-day line leaves room for a potential hold.

First 50-Day Test Since Reclaim

The 50-day average was decisively reclaimed in October and has not been revisited as support since. Friday marks the first touch in that span, making a defensive buyer response entirely normal and expected behavior. The low also reached the lower Bollinger Band (not shown), adding another classic oversold marker that often precedes at least short-term relief.

Deeper Downside Contingency

A decisive decline through today’s low would confirm continued weakness and target the 61.8% Fibonacci retracement near $3.89—though that level lacks strong confluence and is therefore suspect as a final floor. A clean break there quickly exposes the 200-day average at $3.58 as the next major downside objective.

Monthly Reversal Risk Rising

Since July’s $2.62 swing low, natural gas has posted three straight months of higher highs and lows, defining a clear monthly uptrend. December delivered a new higher high at $5.50 before the current sharp retracement. Friday’s brief breach of last month’s $4.09 low—now being actively tested—raises the odds of a one-month bearish reversal, with a weekly or monthly close below confirming the pattern and its bearish implications.

Outlook

Natural gas has arrived at the highest-probability bounce zone with the 50-day average, channel line, and last month’s low all converging near $4.07–$4.09. A strong defense here fits historical behavior and could spark a tradeable relief rally; failure and close below $4.09 triggers a monthly reversal and opens a fast move toward $3.89 and ultimately the 200-day at $3.58.

For a look at all of today’s economic events, check out our economic calendar.


Source link

13 12, 2025

Vegetarian and Vegan Kids Excel in Many Health Measures But Still Need Key Supplements

By |2025-12-13T00:55:08+02:00December 13, 2025|Dietary Supplements News, News|0 Comments


Parents make countless decisions to help their kids thrive. As awareness grows around the benefits and challenges of vegetarian and vegan diets in adults, many wonder whether the same applies to children and if these alternative diets help kids stay healthy or introduce risks for nutrient deficiencies.

Now, researchers from Italy, the U.S., and Australia have published the most comprehensive study to date on how vegetarian and vegan diets compare to mixed diets in children. Their meta-analysis, published in Critical Reviews in Food Science and Nutrition, paints a clear picture: plant-forward diets can offer many health benefits often missing in omnivore diets but only when critical nutrients are properly supplemented.


Read More: A Diet Discovery Reveals That Our Ancestors Were Once Vegetarian


Comparing Nutrient Profiles of Different Diets in Kids

After reviewing data from 59 studies involving children under 18 across 18 countries, the research team found that vegetarian diets (excluding meat, fish, and poultry) and even vegan diets (excluding all animal-based foods, including dairy and eggs) can support healthy development if monitored carefully.

Certain nutrients, such as protein, fat, vitamin B12, calcium, and zinc, were more likely to fall short without proper supplementation. But compared to omnivorous children, vegetarian and vegan kids scored higher in total fiber, iron, folate, vitamin C, and magnesium, while also taking in fewer calories overall.

Beyond individual nutrients, the study found that vegetarian and vegan children generally showed better cholesterol profiles, a reliable marker of cardiovascular health. When comparing physical measurements, they were on average slightly shorter and showed lower BMI, fat mass, and bone mineral content than their omnivore peers.

Kids Can Thrive on Vegetarian and Vegan Diets With the Right Support

This large-scale meta-analysis — including 7,280 vegetarians, 1,289 vegans, and 40,059 omnivores — highlights that each dietary pattern brings both advantages and potential drawbacks. The researchers also stress that evidence for vegan diets in particular isn’t as strong, simply because fewer studies included vegan children.

Still, the research team noted in a press release that parents who choose plant-based diets for ethical, environmental, or health reasons shouldn’t be discouraged. In fact, many health benefits seen in vegetarian and vegan children are often lacking in today’s typical omnivorous diets.

“Our analysis of current evidence suggests that well-planned and appropriately supplemented vegetarian and vegan diets can meet nutritional requirements and support healthy growth in children,” said lead author Monica Dinu from the Department of Experimental and Clinical Medicine at the University of Florence in Italy, in the news release.

Balanced Diets Are Key

Overall, the researchers advise families to approach vegetarian and vegan diets with a solid plan, especially during key growth periods, and to reach out to pediatricians or dietitians if they’re unsure about their child’s nutrient intake. On the research side, they emphasize the need for continued data collection to refine how plant-based diets can be made as healthy and effective as possible.

Wolfgang Marx, from the Food & Mood Centre at Deakin University in Australia, explained in the release that while we already know how well-planned vegetarian and vegan diets can work for adults, reliable data on children has been limited. He also emphasized that focusing too much on dietary labels can distract from meeting nutritional needs.

“Our findings suggest that a balanced approach is essential, with families paying close attention to certain nutrients — particularly vitamin B12, calcium, iodine, iron, and zinc — to ensure their children get everything they need to thrive,” he said.

This article is not offering medical advice and should be used for informational purposes only.


Read More: Adding More Plant-Based Proteins to Your Diet Could Increase Your Life Expectancy


Article Sources

Our writers at Discovermagazine.com use peer-reviewed studies and high-quality sources for our articles, and our editors review for scientific accuracy and editorial standards. Review the sources used below for this article:


Source link

13 12, 2025

Solana Price Prediction To $150 Amid Coinbase Backing & Sustained ETF Inflow

By |2025-12-13T00:47:44+02:00December 13, 2025|Crypto News, News|0 Comments

Key Insights

  • Solana (SOL) price prediction to $150 in focus as the crypto challenged the $140 wall today, but failed to break through the resistance.
  • Coinbase has extended support for Solana tokens, which have lifted the market sentiment.
  • The CLARITY ACT may help trigger a SOL price rally to $400.

The Solana price prediction to $150 and beyond is once again gaining traction as SOL price rallied nearly 6% today.

The crypto has challenged the key resistance at $140 again today but has failed to break through the wall, which has sparked discussions among traders.

However, the recent market trends for Solana hint at a major surge ahead for the asset.

Amid this, the analysts have highlighted the key SOL price levels to watch for cues on the potential future movement of the asset.

In addition, one expert has revealed a key condition that may validate the Solana price prediction to $150 in the near future.

These bullish developments, amid the soaring price, also came in tandem with the sustained institutional interest, as evidenced by the recent fund flow into the US Spot Solana ETF.

The sentiment was further buoyed by the latest comment of Bitwise CIO Matthew Hogan, who has hinted at buying SOL at a discounted price.

On the other hand, the leading crypto exchange, Coinbase, has also extended its support for the Solana network.

So, here we explore the latest performance of the Solana price and see what might have triggered the rally in the asset.

Top Reasons Why SOL Price is Soaring

Solana price has added around 6% today and traded at $138 at the time of writing, witnessing a slight retreat from its 24-hour high of $140.

Notably, the crypto has recovered from a daily low of $130, which was primarily caused by the broader crypto market selloff.

However, the recovery in the broader digital assets space might have helped gain in SOL price.

Besides, it has also fueled optimism over the bullish Solana price prediction to $150 or even higher in the near future.

Meanwhile, it seems that there’s more to it behind the recent surge in SOL price, apart from the random fluctuation in the broader market.

One of the major reasons for the surge is Coinbase’s decision to extend its support for Solana, making every SOL token available for instant trading to its 100 million users.

Solana News: SOL Tokens on Coinbase | Source: Solana, X

This move has increased accessibility and exposure for the cryptocurrency, likely boosting investor confidence.

Another key driver is the growing interest in the US Spot Solana ETF, with institutional investors showing sustained enthusiasm.

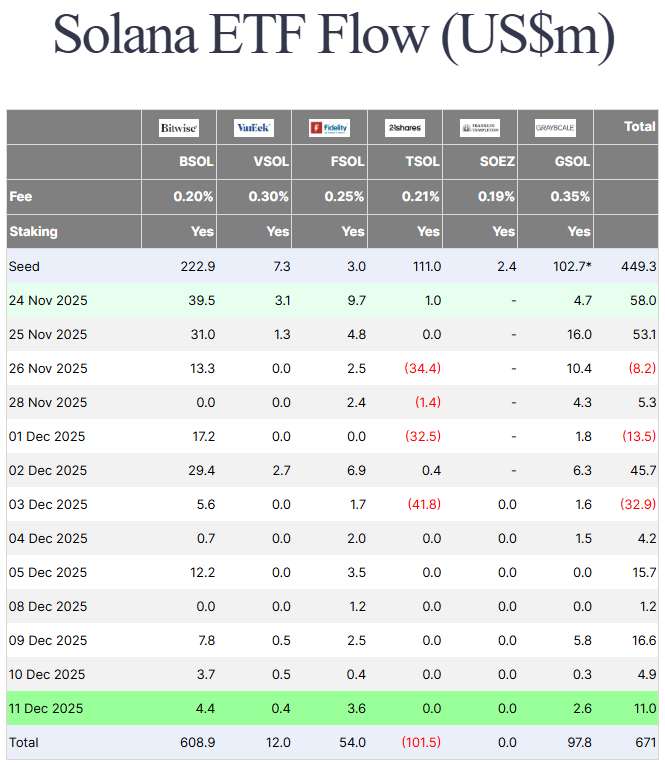
According to Farside Investors’ data, the US Spot Solana ETF has recorded an inflow of $11 million on December 11, marking its six-day inflow streak.

Besides, the total inflow into the investment instrument since launch reached $671 million through Thursday.

Solana ETF Fund Flow Data | Source: Farside Investors

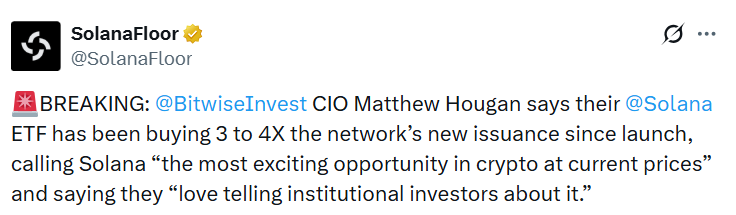
Amid this, Bitwise CIO Matt Hougan has publicly praised Solana, stating that their Solana ETF has been buying 3 to 4 times the network’s new issuance since launch.

Besides, he said that this is “the most exciting opportunity in crypto at current prices,” which has further supported the bullish Solana price prediction ahead.

Bitwise CIO Bullish on SOL Price | Source: SolanaFloor, X

Solana Price Prediction to $150, Here’s All

Amid the latest bullish developments in the market, a renowned expert has shared a bullish Solana price prediction.

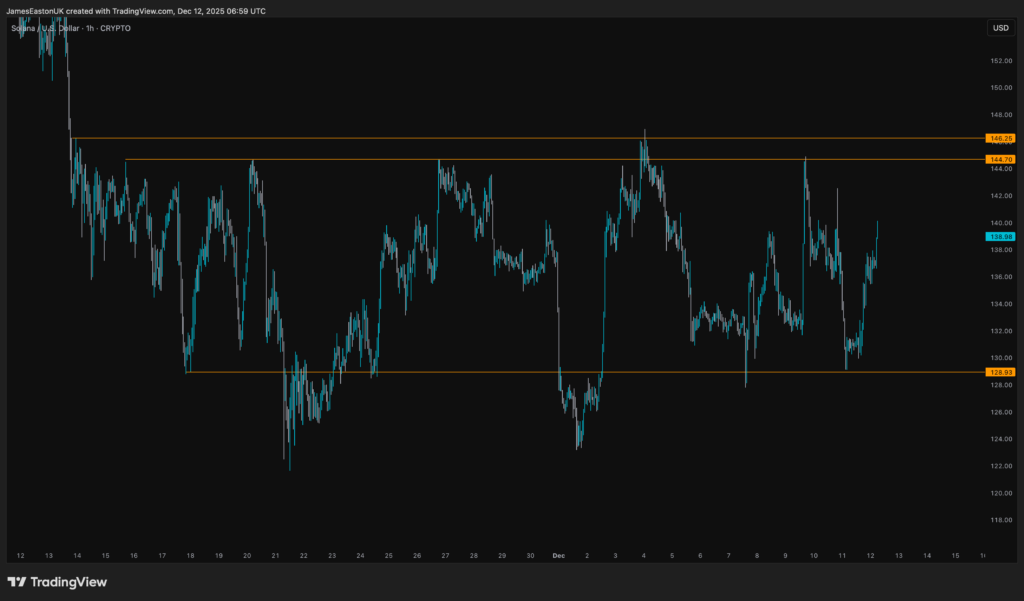
In a recent X post, analyst JamesEastonUK has shared a SOL price chart, which highlighted $139 as a major support.

Solana Price Prediction | Source: JamesEastonUK, X

The expert said that if the crypto can break through the level, the next target would be at $144, $148, or higher.

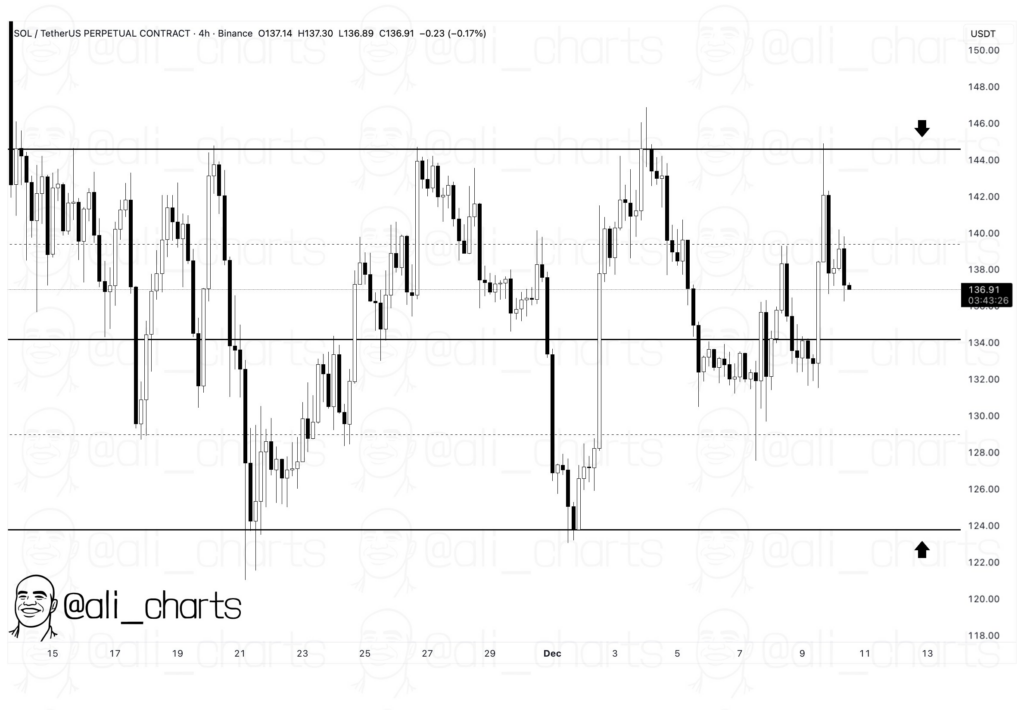
However, analyst Ali Martinez noted that Solana price is consolidating between the $124 and $145 levels, and that is stalling its much-anticipated rally.

SOL Price Prediction | Source: Ali Martinez, X

Having said that, it seems that the crypto must break through the $145 resistance first to continue its upward momentum ahead.

Adding to the sentiment, Anthony Scaramucci has reportedly said that the passing of the CLARITY ACT would trigger a SOL price surge to $400.

In addition, he has shared a Solana price prediction of $1,000 in the next five years, which has further showcased his confidence in the asset.

The post Solana Price Prediction To $150 Amid Coinbase Backing & Sustained ETF Inflow appeared first on The Coin Republic.

Source link

12 12, 2025

Why XRP Is Down Near $2 Despite Ripple’s Trust Bank Green Light, ETF Flows and New DeFi Expansion

By |2025-12-12T23:38:03+02:00December 12, 2025|News, NFT News|0 Comments


XRP price today: XRP is trading around $2.00 on Friday, December 12, 2025, down roughly 1.5% on the day in the latest aggregated feed, with an intraday range near $1.98–$2.05.

That dip is catching attention because it’s happening on a headline-heavy day for the Ripple ecosystem: U.S. regulators moved Ripple closer to a national trust bank, a new spot XRP ETF is hitting U.S. markets, and “wrapped XRP” is expanding XRP’s reach into DeFi on other major blockchains. The short version: today’s XRP weakness looks less like a single “bad XRP headline” and more like a mix of macro risk-off, profit-taking, soft on-chain/derivatives signals, and technical resistance near the $2 area—even as longer-term fundamentals get fresh catalysts.


Why is XRP down today?

XRP’s decline today is best explained as several pressures stacking at once rather than one decisive negative trigger:

1) Macro sentiment is weighing on crypto (even when individual tokens have good news)

A key backdrop is broader crypto market caution following what multiple analysts described as a hawkish rate cut and ongoing uncertainty about inflation and growth. FXStreet notes heightened volatility as investors digested the Fed decision and its implications for risk assets.  [1]

Mainstream coverage echoed the same idea: a widely expected rate move can become a “sell the news” event in crypto if it was already priced in—or if investors don’t like the forward guidance. Fast Company specifically pointed to the idea that traders had fully priced in the cut and then sold anyway, adding broader macro concerns as contributors.  [2]

2) “Good headlines” don’t always translate into immediate XRP buying

Ripple-related regulatory progress is meaningful—but it’s not a same-day demand switch for the XRP token.

For example, the U.S. Office of the Comptroller of the Currency (OCC) granted preliminary conditional approval for Ripple’s national trust bank charter (and other major crypto firms) — a major legitimacy milestone, but still conditionaland not a full bank in the traditional sense.  [3]

BeInCrypto made the point directly: the move strengthens infrastructure and institutional positioning, but may not create an immediate XRP price surge by itself.  [4]

3) On-chain and derivatives signals look “muted,” not euphoric

If a market is positioned aggressively long, big bullish headlines can trigger breakouts. But if positioning is cautious and activity is cooling, the same headlines can land with a shrug.

FXStreet reported slowing XRP Ledger activity (fewer active addresses compared with earlier November levels) and suppressed retail/derivatives demand, with XRP futures open interest stabilizing around $3.72B in its dataset.  [5]

Separately, a Bitcoinist report citing Glassnode data said XRP’s total transaction fees (a proxy for activity) fell sharply from a February peak, describing an ~89% drop to levels not seen since 2020 in that metric’s moving average.  [6]

And CryptoPotato highlighted a Santiment view that XRP looked “undervalued” on a 30‑day MVRV reading—often a contrarian setup—but it also described speculative activity as muted, reinforcing the idea of a market waiting for a stronger catalyst.  [7]

4) Large wallet transfers can spook short-term traders

Crypto markets are extremely sensitive to perceived “supply events,” especially when coins move toward exchange-linked wallets.

Coinpedia reported that 75M XRP (roughly $152M at the time of its report) was sent to a wallet tied to Binance after a broader internal shuffle involving hundreds of millions of XRP—activity flagged by Whale Alert. Whether or not it ultimately represents selling, traders often treat exchange-directed transfers as a near-term risk factor.  [8]

5) Technical levels are capping rebounds around $2

From a purely market-structure standpoint, XRP is sitting at a psychologically important zone. FXStreet described XRP holding the $2.00 area while also noting overhead pressure from short-term moving averages and nearby resistance levels (with support markers not far below).  [9]

In plain English: it doesn’t take much selling to push XRP down when it’s trapped under resistance—especially if the broader market is cautious.


XRP’s big headlines on Dec. 12, 2025 — and what they mean

Even with the dip, today’s news flow is substantial. Here are the major XRP/Ripple-linked developments dated Dec. 12, 2025:

Ripple moves closer to a U.S. national trust bank charter

Reuters reported that the OCC granted preliminary approval for several crypto firms—including Ripple—to establish or convert into national trust banks, enabling broader nationwide operations (but not traditional deposit-taking).  [10]

Axios emphasized the same core point: these charters are a significant regulatory step, but they do not allow taking deposits, offering savings accounts, or providing FDIC insurance.  [11]

The OCC’s own letter to Ripple (dated Dec. 12, 2025) confirms the approval is preliminary and conditional, with final authorization dependent on pre-opening requirements.  [12]

Why this matters for XRP:

  • Bull case: more regulatory integration can expand institutional rails for custody, settlement, and stablecoin infrastructure that Ripple builds (and potentially the ecosystem around XRP).
  • Why it may not pump price today: conditional approvals are not final approvals, and bank-charter mechanics don’t automatically create spot XRP buying pressure in the short term.

GENIUS Act stablecoin framework is now part of the regulatory backdrop

Multiple reports tied the trust-bank approvals to the post‑GENIUS Act environment. Congress.gov shows the GENIUS Act became Public Law in July 2025, establishing a U.S. framework for payment stablecoins.  [13]

Circle’s statement on its own OCC conditional approval explicitly described the charter milestone as aligned with GENIUS Act compliance, illustrating how stablecoin issuers are positioning for that regulatory regime.  [14]

Why this matters for XRP:

  • It reinforces that the industry is shifting from “legal gray zone” to “regulated infrastructure buildout.”
  • But markets can still sell off short-term if macro conditions are sour.

Ripple Payments lands a first European bank adoption with AMINA Bank

Ripple’s press release (Dec. 12, 2025) announced that AMINA Bank became the first European bank to use Ripple’s licensed end-to-end payments solution, targeting near real-time cross-border payments for AMINA’s clients and bridging fiat and stablecoin rails.  [15]

Ripple also stated Ripple Payments has broad global coverage and has processed more than $95B in volume.  [16]

Why this matters for XRP:

  • It’s a tangible “real-world adoption” narrative.
  • Still, payments partnerships can be slow-burn catalysts; traders often want immediate volume/fee impacts that show up in market data.

Wrapped XRP (wXRP) expands XRP into DeFi across other blockchains

Hex Trust’s Dec. 12 release said it will issue and custody wrapped XRP (wXRP), a 1:1-backed representation of XRP designed for DeFi and cross-chain utility, launching with over $100M in stated total value locked (TVL) and supporting trading and liquidity pairing (including with RLUSD) across multiple chains.  [17]

FinanceFeeds framed the rollout as a landmark cross-chain expansion for XRP’s liquidity and use cases beyond the XRP Ledger, using an institutional custody framework and LayerZero-based interoperability.  [18]

Why this matters for XRP:

  • Bull case: expands addressable DeFi liquidity and lets XRP participate where most DeFi activity lives.
  • Short-term ambiguity: new wrappers and cross-chain routes can also increase arbitrage flows and make it easier for some holders to deploy (or exit) positions in new venues—so initial price reactions can be choppy.

New U.S. spot XRP ETF product expands access (TOXR)

Crypto Briefing reported that 21Shares launched its XRP ETF (ticker TOXR) on Cboe BZX after the SEC declared the registration effective, and noted the fund tracks a regulated XRP benchmark with a 0.3% annual fee.  [19]

The 21Shares factsheet lists TOXR with an inception date of Dec. 11, 2025, an expense ratio of 0.30%, and shows it as a digital asset ETF trading on Cboe BZX (with the stated pricing benchmark).  [20]

Meanwhile, FXStreet reported XRP spot ETF inflows around $16M on Thursday, with cumulative inflows near $971Mand net assets around $930M in its cited dataset—suggesting ETF demand has not disappeared even as spot price softens.  [21]

Why this matters for XRP:

  • ETFs can be a structural source of demand over time.
  • But ETF inflows don’t guarantee green days—especially if macro and technical conditions drive short-term selling.

What analysts and traders are watching next

Here are the most widely referenced “next checkpoints” from today’s market analysis coverage:

Key support and resistance zones

FXStreet’s technical commentary repeatedly centers the market around the $2.00 area, with nearby downside levels flagged just beneath and overhead resistance zones that must be reclaimed for momentum to flip.  [22]

A reasonable way to frame the setup for readers:

  • If $2 holds: XRP may remain in consolidation and attempt rebounds into nearby resistance.
  • If $2 breaks cleanly: traders will look to the next support zones quickly, especially if macro risk-off returns.

The “data reality check”: are users and traders returning?

Beyond headlines, analysts are watching:

  • Active addresses / on-chain activity (FXStreet highlighted a downtrend from November levels).  [23]
  • Derivatives open interest (low or stagnant OI can signal low conviction and limited retail participation).  [24]
  • ETF flow consistency (steady inflows can cushion dips, but abrupt flow reversals can accelerate them).  [25]

Regulatory follow-through: conditional approvals are not the finish line

The trust bank story is big, but it’s also procedural. The OCC letter makes clear Ripple’s approval is preliminary, and final authorization depends on meeting conditions.  [26]

That means future “catalyst moments” could include:

  • updates on final approvals,
  • clarity on what products/services are prioritized (custody, settlement, stablecoin infrastructure),
  • and how quickly institutions actually integrate.

Bottom line: XRP is down today, but the news cycle is not “bearish”

XRP’s dip near $2 on Dec. 12, 2025 is happening despite a cluster of ecosystem-positive developments—OCC conditional trust-bank progress, new ETF access, a European banking integration, and DeFi expansion via wrapped XRP.  [27]

The more consistent explanation is that short-term market structure and sentiment (macro uncertainty, cautious derivatives positioning, on-chain softness, and technical resistance) are overpowering the immediate price impact of longer-horizon headlines.  [28]

As always in crypto: big infrastructure headlines can be the beginning of a narrative, not the moment the chart turns green.

Disclosure: This article is for informational purposes only and is not financial advice.

References

1. www.fxstreet.com, 2. www.fastcompany.com, 3. www.reuters.com, 4. beincrypto.com, 5. www.fxstreet.com, 6. bitcoinist.com, 7. cryptopotato.com, 8. coinpedia.org, 9. www.fxstreet.com, 10. www.reuters.com, 11. www.axios.com, 12. www.occ.gov, 13. www.congress.gov, 14. www.circle.com, 15. ripple.com, 16. ripple.com, 17. www.hextrust.com, 18. financefeeds.com, 19. cryptobriefing.com, 20. cdn.21shares.com, 21. www.fxstreet.com, 22. www.fxstreet.com, 23. www.fxstreet.com, 24. www.fxstreet.com, 25. www.fxstreet.com, 26. www.occ.gov, 27. www.reuters.com, 28. www.fxstreet.com


Source link

12 12, 2025

Why XAG/USD Is Down After a Record High — and What Analysts Forecast Next

By |2025-12-12T23:35:07+02:00December 12, 2025|Forex News, News|0 Comments


Silver is having a “two-speed” day on Friday, December 12, 2025: it set a fresh all-time high early in the session, then pulled back sharply as traders locked in profits and macro headwinds returned.

By early afternoon in New York, spot silver (XAG/USD) was down about 3% near $61.7–$61.9 per ounce, after printing a record around $64.64–$64.66 earlier in the day.  [1]

So if you’re asking “silver price today — why is it down?” the short answer is: a classic profit-taking reversal from record highs, helped along by a firmer U.S. dollarrising Treasury yields, and risk-off crosswinds that pushed traders to reduce exposure ahead of key U.S. data next week.  [2]

Below is a complete, publication-ready breakdown of what moved silver todaywhat today’s leading analysts are watching, and where the next key levels and scenarios sit.


Silver price today: the latest levels (spot and futures)

  • Spot silver (XAG/USD): fell about 3% to roughly $61.7 after hitting a record $64.64 earlier Friday (New York afternoon).  [3]
  • Early read (morning): at 8:15 a.m. ET, one widely followed daily pricing snapshot showed silver around $64.47, underscoring how quickly the reversal developed later in the session.  [4]
  • COMEX silver futures (reference point): the widely tracked Yahoo Finance futures series shows Dec. 12, 2025trading with a low near $61.88 and close around $62.17 (after a high above $65).  [5]

Big picture: even after today’s drop, silver is still sitting near record territory and remains up roughly 5% on the weekand well over 100% year-to-date, depending on the benchmark quoted.  [6]


Why is silver down today? The 5 main drivers behind the drop

1) Profit-taking after a historic run (the most direct catalyst)

Silver didn’t fall out of nowhere—it fell after making history.

Reuters attributed the move primarily to profit-taking, noting silver slid nearly 3% after touching a new record high.  [7]
FXStreet’s late-day analysis echoed that framing: silver “retreats from record high as investors lock in profits,” describing a drop of more than 3% after the new peak.  [8]

When an asset is up more than 100% in a year, “sell the rip” behavior becomes more common—especially into a weekend and after a string of consecutive up days.

2) The U.S. dollar stopped falling (and that matters for XAG/USD)

Silver is priced globally in dollars. When the USD firms, metals often feel pressure because they become more expensivefor non-U.S. buyers.

Reuters noted the dollar held steady after falling in recent sessions—something traders explicitly flagged as a headwind for dollar-priced metals.  [9]
In a separate Reuters FX report Friday, the dollar index rose to about 98.44, rebounding from a two‑month low even though it remained weaker on the week.  [10]

That “USD bounce” doesn’t need to be huge to trigger a metal pullback when positioning is stretched.

3) Treasury yields rose as markets digested Fed divisions and “higher-for-longer” risk

Precious metals are non-yielding assets. When bond yields rise, metals can lose some relative appeal—especially after a big rally.

Reuters’ global markets wrap reported U.S. 10‑year yields rising to around 4.186%, with investors reacting to Fed commentary and mixed signals.  [11]
And on the Fed itself, Reuters highlighted that multiple officials dissented on the most recent rate cut decision and voiced concern that inflation remains too high—reinforcing uncertainty around how quickly cuts can continue.  [12]

That combination—slightly higher yields + a less one‑way Fed outlook—often hits silver harder than gold because silver is “more volatile” and more sensitive to swings in risk appetite and macro pricing.

4) Risk-off spillover: tech/AI volatility triggered de-risking across markets

Friday wasn’t just a silver story. It was also a day where stocks dropped and investors worried about frothy AI trades.

Reuters reported major indexes falling sharply, with tech shares under pressure and yields rising.  [13]
FXStreet also tied the silver pullback to broader risk-off conditions, noting U.S. stocks declined while yields climbed and “AI-bubble” worries resurfaced.  [14]

When equities get hit, traders sometimes reduce risk across portfolios, including trimming “winner” positions like silver to raise cash or rebalance exposure.

5) Technical exhaustion: overbought signals and a textbook reversal pattern

Several Dec. 12 technical notes pointed to overstretch.

  • FXStreet warned the rally looked overbought, citing RSI signals and bearish divergence as silver struggled to hold above $64.  [15]
  • Another FXStreet update described a bearish engulfing pattern and negative RSI divergence, flagging elevated near‑term retracement risk.  [16]
  • FXStreet’s later analysis added that silver broke below its rising channel after the peak and framed a pullback toward prior breakout levels as “healthy,” unless it turns into a deeper breakdown.  [17]

In plain English: after a vertical climb, stop-losses and profit targets tend to cluster. Once selling starts, the move can accelerate fast—especially in a market known for sharp percentage swings.


Today’s news backdrop: silver is down now, but the “bull case” headlines didn’t disappear

Even with Friday’s pullback, many of the same forces that helped push silver to records are still being cited in today’s coverage:

Silver’s “critical minerals” angle is now a mainstream driver

Multiple reports today pointed to silver’s addition to a U.S. critical minerals list and the knock-on effects on supply chains and tariff expectations.  [18]

That matters because it can incentivize inventory shifts (metal moving into U.S. warehouses) and complicate global availability—both of which can amplify price moves.

Physical tightness, deficits, and inventory reshuffling remain central themes

The Silver Institute and Metals Focus have repeatedly emphasized that 2025 is on track for another structural market deficit—a key plank of the bull narrative.  [19]
ING’s recent research also described a tariff-driven flow of metal and tightness in key hubs, arguing volatility is likely to remain a defining feature into 2026.  [20]

Industrial demand is not just “solar” anymore — AI and data centers are now in the story

Business and market coverage in December has increasingly linked silver demand to the AI build‑out, data centers, and electronics—on top of EVs and solar.  [21]

This “dual-use” identity (industrial + precious metal) is one reason silver can surge dramatically—and also why it can reverse sharply on risk-off days.


Forecasts and analyst views dated Dec. 12, 2025: what’s next for silver?

Today’s published outlooks are not unanimous. But they cluster around a few consistent ideas:

Near-term: volatility and “retest” risk is front and center

FXStreet’s end-of-day note suggested silver may be headed toward a test of prior breakout zones—roughly the $59–$60region—while emphasizing that a retest can be constructive if it holds.  [22]

Key upside targets cited today: $65, then higher extensions

Earlier on Dec. 12—before the selloff—FXStreet noted that silver was consolidating above $64 and pointed to potential upside tests near $65, with higher technical extensions beyond that if momentum resumes.  [23]

Separately, Reuters (in its earlier precious-metals framing) noted that some analysts see technical momentum pointing toward $75—a level that has become a recurring “next milestone” in bullish commentary.  [24]

Support levels highlighted today (the levels traders are watching now)

Across today’s technical updates, several support areas were repeated:

  • $61.00 (near-term “line in the sand” in some technical commentary)  [25]
  • $60.09 / ~$60.00 (recent lows and psychological level)  [26]
  • ~$59.40–$59.85 (prior record/high‑turned‑support zone and channel area cited in analysis)  [27]
  • $57.75–$57.25 (deeper correction zone discussed if the pullback accelerates)  [28]

On the upside, FXStreet framed $62 as a near-term pivot to watch after the drop, with resistance returning near the mid‑$64s if bulls regain control.  [29]


What to watch next week (and why it matters for silver)

Today’s selloff happened with traders already looking ahead.

1) U.S. Nonfarm Payrolls (NFP) and delayed macro data

Reuters and FXStreet both pointed to next week’s U.S. jobs data as a key catalyst.  [30]

If jobs data comes in hot, yields can rise and the dollar can strengthen—often a headwind for silver. If it cools, rate-cut expectations can reaccelerate—often supportive for precious metals.

2) The Fed narrative: “cuts happened, but division is growing”

The Fed has cut, but dissent and inflation concern remain part of the story, according to Reuters reporting.  [31]

For silver, that means the market may swing rapidly between:

  • “More cuts are coming” (bullish metals), and
  • “The Fed may pause / inflation is sticky” (supportive for USD/yields, sometimes bearish metals).

3) Risk appetite and the AI trade

Because silver is tied to industrial growth expectations and risk positioning, sharp moves in tech and broader equity sentiment can bleed into silver—especially after a year like 2025 where silver became one of the standout momentum trades.  [32]


Bottom line: silver is down today — but the market is still in “record territory mode”

Silver’s drop on Dec. 12, 2025 is best described as a violent reset after a record high, driven by profit-taking, a firmer dollarhigher yields, and technical exhaustion[33]

At the same time, the rally’s underlying pillars—tight physical conditions, structural deficit narratives, and industrial demand tied to electrification and AI-era infrastructure—remain prominent in today’s reporting.  [34]

That tension is why many analysts expect more volatility rather than a smooth trend from here.

Note: This article is for informational purposes only and is not financial advice.

References

1. www.tradingview.com, 2. www.tradingview.com, 3. www.tradingview.com, 4. fortune.com, 5. finance.yahoo.com, 6. www.tradingview.com, 7. www.tradingview.com, 8. www.fxstreet.com, 9. www.tradingview.com, 10. www.reuters.com, 11. www.reuters.com, 12. www.reuters.com, 13. www.reuters.com, 14. www.fxstreet.com, 15. www.fxstreet.com, 16. www.fxstreet.com, 17. www.fxstreet.com, 18. www.fxstreet.com, 19. silverinstitute.org, 20. think.ing.com, 21. www.businessinsider.com, 22. www.fxstreet.com, 23. www.fxstreet.com, 24. www.reuters.com, 25. www.fxstreet.com, 26. www.fxstreet.com, 27. www.fxstreet.com, 28. www.fxstreet.com, 29. www.fxstreet.com, 30. www.tradingview.com, 31. www.reuters.com, 32. www.reuters.com, 33. www.tradingview.com, 34. silverinstitute.org


Source link

12 12, 2025

Dermatologists share what’s really going on

By |2025-12-12T22:54:09+02:00December 12, 2025|Dietary Supplements News, News|0 Comments


TikTok loves a dramatic reveal. The Green Tea Mask Blackhead Remover Deep Pore Cleansing Clay Stick shot to fame after creators posted close-up clips of what looked like blackheads popping out like confetti. The product itself reads like a dream. Smooth texture. Easy glide. Suitable for all skin types. Portable enough to swipe on in the back seat of an Uber. Fans say it makes masking on the move effortless.

Its ingredient list leans into the wholesome vibe. Green tea extract to balance oil and water, kaolin clay to mop up excess sebum, and antioxidant support to polish skin and leave it looking fresher than your morning iced matcha. The marketing is snappy. The visuals are dramatic. The results are… well, dermatologists have thoughts.

© Getty Images
Green tea extract to balance oil and water, kaolin clay to mop up excess sebum, and antioxidant support to polish skin.

What Experts Say About Those Viral Blackhead Clips

Here is where the science pulls up a chair. Board-certified dermatologist Dr. Shamsa Kanwal has treated enough skin to spot a good routine from a trendy detour. Her take on the viral videos trims away the hype. “When I watch the viral green mask blackhead videos, I see more marketing than dermatology. Often the dramatic clips of blackheads coming out are just product residue or sebaceous filaments from the very top of the pore, not deep extractions. At best, these masks can give a short term mattifying or pore blurring effect. I worry that they set very unrealistic expectations and encourage people to scrub or mask too aggressively when results are not as dramatic at home.”

Her concern is not that masks are evil. It is that people go against their skin as it has wronged them. Used gently, she explains, clay masks can absorb surface oil. Used too often, especially alongside strong actives, they can disrupt the skin’s barrier. That is your natural defense system.  When irritated, it can trigger redness, dryness, and in acne-prone skin, even more inflammation.

The moment a product swears it will pull out every blackhead in minutes, her alarm bells sing.

Dr. David Johnson Breaks Down the Biology Behind Blackheads

Dermatologist Dr. David Johnson, co-founder of RedliteX, has a similar perspective grounded in the physics of pores. “Blackheads occur because a pore becomes filled with oil, or sebum, as well as dead skin cells. A mask that can be peeled off may help clean surface dirt, but it will not be able to get into the pores and eliminate blackheads.”

He has seen patients come in genuinely thrilled, believing a miracle mask cleared their skin. What the mask actually removed were tiny hairs and loose flakes. The real blackheads were still hanging out like unbothered houseguests.

Dermatologists share what’s really going on© Getty Images
He has seen patients come in genuinely thrilled, believing a miracle mask cleared their skin.

He also confirms what many barrier-loving skincare fans already fear. Harsh peeling formulas can irritate or damage the stratum corneum, the outer layer of skin. Once that layer is compromised, moisture escapes, irritation climbs, and the skin can feel tight, itchy, and overly sensitive.

His go-to blackhead fix is refreshingly boring but scientifically sound. Salicylic acid. Retinoids. Gentle exfoliation. Consistency wins every time. As for his specialty, red light therapy, it does not yank out blackheads. It helps reduce inflammation and supports skin healing, acting like a calming reset button.

 The glowing red light targets skin rejuvenation, anti-aging, and improved blood circulation, highlighting the use of cutting-edge skincare technology for optimal results. © Getty Images
The glowing red light targets skin rejuvenation, anti-aging, and improved blood circulation, highlighting the use of cutting-edge skincare technology for optimal results.

So, Is the Green Tea Mask Stick Useless?

Not at all. It can offer a temporary smoother look thanks to clay’s oil-absorbing powers. The trouble starts when unrealistic expectations set in. No clay stick can suck out deep blackheads. No mask can erase congestion instantly. And anything promising overnight miracles usually belongs in a fantasy novel.

Treat the viral stick like a fun add-on, not a cure-all. Use it sparingly. Keep your routine gentle. Pair trendy products with tried and true ingredients that have stood the test of clinical research.

Treat the viral stick like a fun add-on, not a cure-all.© Getty Images
Treat the viral stick like a fun add-on, not a cure-all.

Both dermatologists come back to one universal truth. Healthy skin grows from consistency, patience, and barrier respect. Not internet stunts. Skin thrives when we treat it like a living organ, not a polishing challenge. The next time a product claims it can pull out every blackhead in minutes, enjoy the spectacle. Then reach for your salicylic acid.


Source link

12 12, 2025

Dogecoin struggles as institutional demand, open interest remain weak

By |2025-12-12T22:46:04+02:00December 12, 2025|Crypto News, News|0 Comments

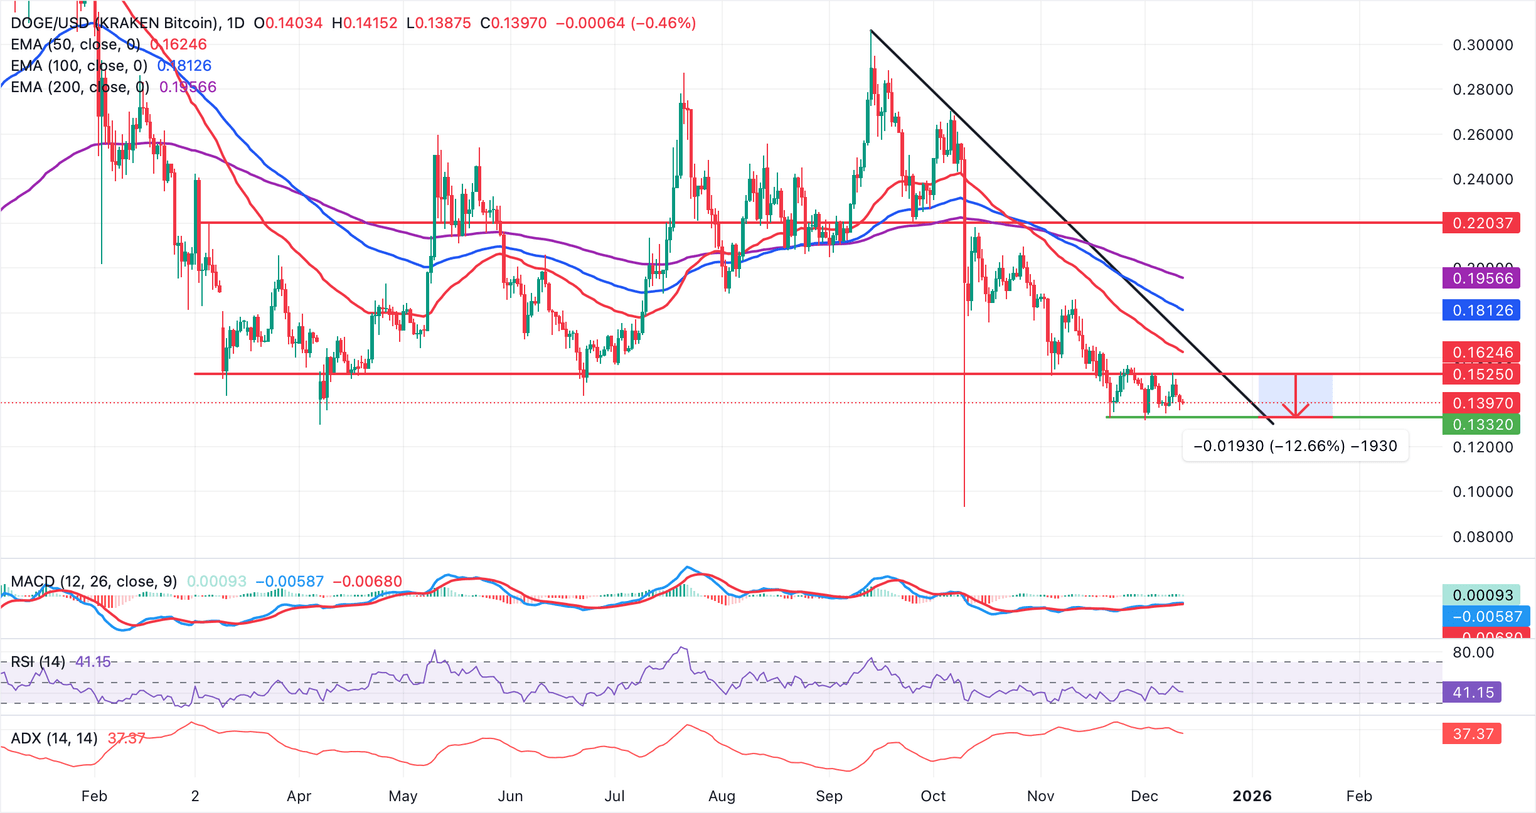
Dogecoin (DOGE) is trading marginally above its intraday open of $0.1403 at the time of writing on Friday. Support at $0.1321 has been holding steady since November 20, despite the risk-off sentiment across the cryptocurrency market.

The Federal Reserve’s (Fed) decision to cut interest rates by 25 basis points on Wednesday was characterised by a sharp rise in volatility, as investors digested the hawkish outlook likely to set the tone in 2026.

Inflation risks and a weak labor market stood out as factors that could prompt the central bank to pause its monetary easing cycle, an outlook that may continue to drive macroeconomic uncertainty.

Dogecoin faces declining institutional and retail interest 

The Dogecoin derivatives market is significantly suppressed, with futures Open Interest (OI) at $1.5 billion on Friday, down from $4.4 billion on October 10.
This sharp decline in OI, which represents the notional value of outstanding futures contracts, was triggered by macroeconomic uncertainty and the October crash, which liquidated over $19 billion in assets in a single day.
Retail interest has since then remained significantly subdued, reflecting a sticky risk-off sentiment as investors stay on the sidelines. Low OI also suggests that investors have lost confidence in the market, which may continue to cap rebounds.

Dogecoin Open Interest | Source: CoinGlass

The launch of spot Exchange Traded Funds (ETFs) in November was a major milestone for Dogecoin, being the largest meme coin by market capitalisation. However, institutional interest has remained on the back foot, characterised by mild ETF inflows.

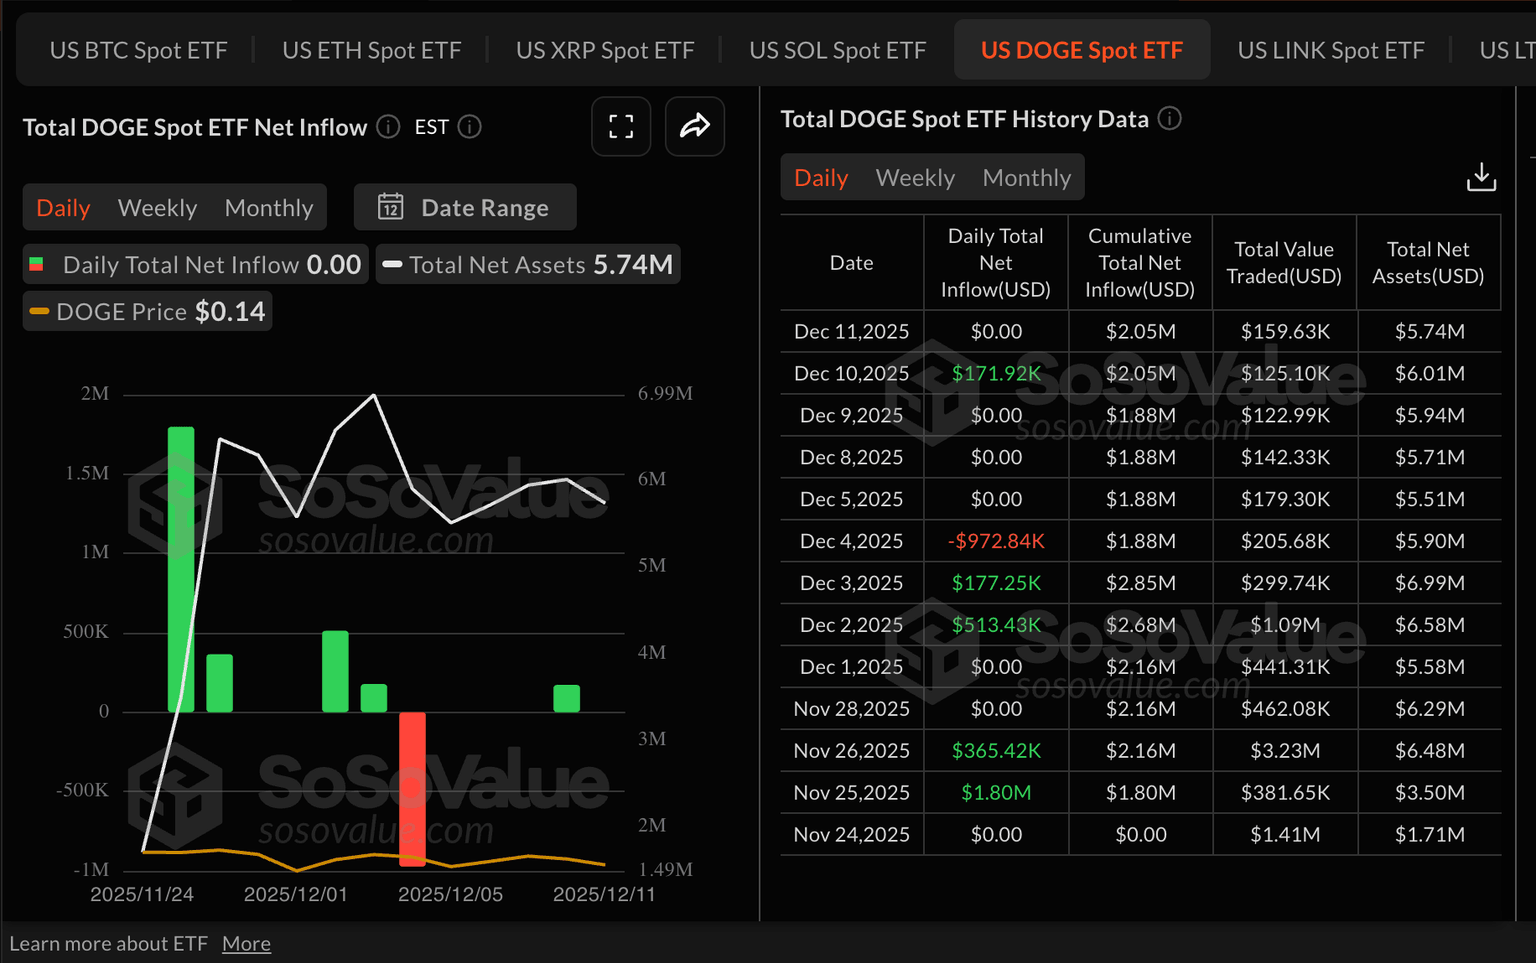
According to SoSoValue data, US-listed DOGE ETFs recorded no flows on Thursday, after posting nearly $172,000 in inflows on Wednesday. The cumulative inflow volume averages $2 million with net assets of $5.74 million. Two Dogecoin spot ETFs are operating in the US, including Grayscale’s GDOG and Bitwise’s BWOW. 

Dogecoin ETF stats | Source: SoSoValue

Technical outlook: Dogecoin extends sideways trading

XRP is trading at $0.1397 and remains below the falling 50-day Exponential Moving Average (EMA) at $0.1625, 100-day EMA at $0.1813 and 200-day EMA at $0.1957, keeping the broader bias bearish. The Moving Average Convergence Divergence (MACD) indicator holds marginally above the signal line (red), while the green histogram bars contract on the daily chart, suggesting fading bullish momentum. Dogecoin could extend the downtrend below the support at $0.1332 if the Relative Strength Index (RSI) at 41 declines further.

DOGE/USD daily chart

The descending trend line from $0.3063 limits rebounds, with resistance at $0.1688. DOGE’s trend strength remains elevated but easing, as the Average Directional Index (ADX) hovers near 37. A daily close above the initial barrier at $0.1688 would improve the tone and expose the 100-day EMA at $0.1813. Failure to reclaim the 50-day EMA would keep rallies capped and leave sellers in control.

Crypto ETF FAQs

An Exchange-Traded Fund (ETF) is an investment vehicle or an index that tracks the price of an underlying asset. ETFs can not only track a single asset, but a group of assets and sectors. For example, a Bitcoin ETF tracks Bitcoin’s price. ETF is a tool used by investors to gain exposure to a certain asset.

Yes. The first Bitcoin futures ETF in the US was approved by the US Securities & Exchange Commission in October 2021. A total of seven Bitcoin futures ETFs have been approved, with more than 20 still waiting for the regulator’s permission. The SEC says that the cryptocurrency industry is new and subject to manipulation, which is why it has been delaying crypto-related futures ETFs for the last few years.

Yes. The SEC approved in January 2024 the listing and trading of several Bitcoin spot Exchange-Traded Funds, opening the door to institutional capital and mainstream investors to trade the main crypto currency. The decision was hailed by the industry as a game changer.

The main advantage of crypto ETFs is the possibility of gaining exposure to a cryptocurrency without ownership, reducing the risk and cost of holding the asset. Other pros are a lower learning curve and higher security for investors since ETFs take charge of securing the underlying asset holdings. As for the main drawbacks, the main one is that as an investor you can’t have direct ownership of the asset, or, as they say in crypto, “not your keys, not your coins.” Other disadvantages are higher costs associated with holding crypto since ETFs charge fees for active management. Finally, even though investing in ETFs reduces the risk of holding an asset, price swings in the underlying cryptocurrency are likely to be reflected in the investment vehicle too.

(The technical analysis of this story was written with the help of an AI tool)

Source link

Go to Top