About Editorial team of BIPNs

Main team of content of bipns.com. Any type of content should be approved by us.
7 11, 2025

Cardano Price Prediction: ADA Rebounds From $0.50 Support as Bulls Target $0.85 Recovery Zone

By |2025-11-07T09:33:16+02:00November 7, 2025|Crypto News, News|0 Comments

Cardano price has rebounded from the key $0.50 support, showing renewed strength as participants anticipate whether this bounce could trigger a broader recovery towards the $0.85 resistance zone.

After weeks of steady declines, Cardano price is finally showing signs of strength as price rebounds sharply from the $0.50 zone. This renewed strength comes amid growing optimism in the ADA community, with participants eyeing whether this bounce can evolve into a full-fledged recovery towards the $0.70 to $0.85 range.

Cardano Rebounds From $0.50 Support Zone

Cardano price is showing its resilience again as price bounces from the $0.50 psychological level, a region that has acted as a major support multiple times this year. The current rebound follows a clean defense of horizontal structure and wick rejections that indicate strong dip absorption by buyers. The chart also suggests a descending channel with the lower boundary now being tested, hinting that ADA Cardano price may be forming a potential bottoming pattern.

Cardano price rebounds from the $0.50 support level, signaling renewed buying interest and potential base formation. Source: Rand via X

For participants, reclaiming $0.56 to $0.58 would be the first structural confirmation of recovery, with upside continuation likely towards $0.70 if volume expands. On the downside, losing $0.50 could reintroduce pressure towards $0.44, but for now, momentum favors cautious accumulation as long as support holds firm.

Cardano Price Prediction: Bulls Eye Recovery Towards $0.85

Ali Martinez’s chart highlights how $0.52 remains a historically reliable level that has triggered multiple rebounds since late 2024. This horizontal zone coincides with the lower range of ADA’s macro consolidation channel, making it a critical pivot point for trend direction.

Cardano Price Prediction: ADA Rebounds From alt=

Cardano continues to defend the $0.52 support zone, with bullish momentum building toward the $0.85 resistance ranges. Source: Ali Martinez via X

From a technical perspective, Cardano price continues to trade between $0.52 support and $0.85 resistance, forming a potential accumulation range. If buyers maintain control, the next rally could aim for $0.74–$0.85, aligning with the midpoint of the broader range. A break above this threshold would confirm a trend reversal structure, potentially opening the door for a retest of $1.00 resistance.

Growing Utility Strengthens Long-Term ADA Outlook

Beyond technicals, Cardano’s fundamentals continue to build momentum. A recent update shared by TapTools cites The Motley Fool’s report, which deems $1 ADA “very plausible” given Cardano’s integration of the new x402 transaction standard developed by Masumi. This standard allows AI agents to transact and pay per request using crypto.

Growing Utility Strengthens Long-Term ADA Outlook

Cardano’s integration of the x402 AI transaction standard boosts its long-term utility and adoption potential. Source: TapTools via X

Such developments position Cardano as one of the few networks bridging blockchain with emerging AI infrastructure. As this adoption narrative strengthens, investor confidence may return faster than expected, especially as Cardano price nears historically undervalued levels.

RSI Oversold: Room for Short-Covering Bounce

On the technical front, Cardano’s momentum indicators are painting a textbook setup for a short-term relief rally. The daily RSI hovers around 30, signaling oversold conditions comparable to earlier reversal phases. CryptoCeek highlights that a push above $0.62 could flip sentiment bullish again, particularly if short positions start unwinding.

RSI Oversold: Room for Short-Covering Bounce

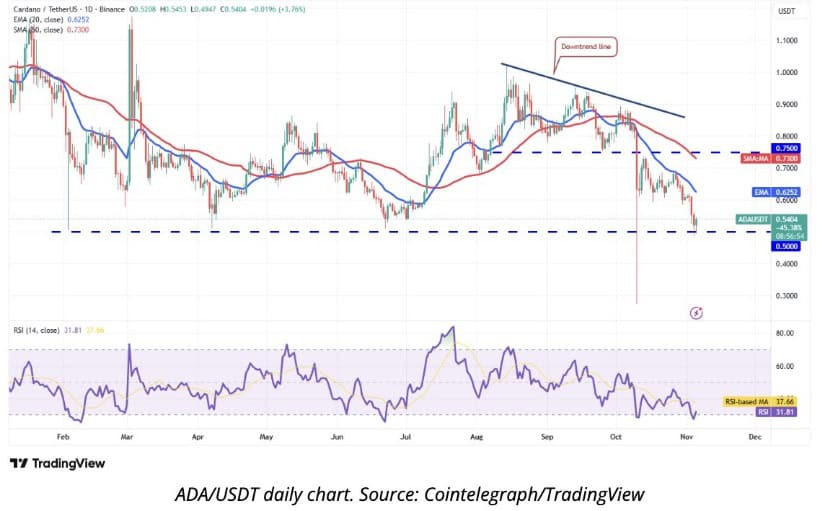
Cardano’s RSI nears oversold territory, hinting at a possible short-covering bounce if $0.62 resistance breaks. Source: CryptoCeek via X

Cardano price structure shows $0.50 acting as near-term demand, while a clean break above the descending trendline could unlock targets towards $0.74. Conversely, a breakdown below $0.50 exposes $0.40, though that remains a less likely scenario unless broader market weakness accelerates.

Final Thoughts

Cardano price is approaching an inflection point. With strong technical support at $0.50 to $0.52, oversold RSI readings, and renewed confidence from both participants and fundamental analysts, the probability of a rebound is rising.

If price reclaims $0.62 to $0.65, ADA Cardano price could enter a new short-term bullish phase targeting $0.74 and $1.00, supported by improving on-chain innovation and the AI-driven x402 transaction narrative. Overall, Cardano looks primed for a stabilization phase that could evolve into a stronger recovery if buyers sustain this critical support zone.


Source link

7 11, 2025

Does drinking Matcha increase hair loss? Experts weigh in on viral social media claims

By |2025-11-07T07:37:59+02:00November 7, 2025|Dietary Supplements News, News|0 Comments


Image credits: Getty Images, Canva

It’s a beautiful green in colour, with a soft foam on top and an earthy flavour that has millions across the world hooked to its hit. Ever since it went viral, Matcha has become the go-to morning drink for people wanting a calm energy without the caffeine jitters.While its sweet and savoury taste might soothe your soul and enhance focus, it seems one might need to whisk up on the effects of the Japanese beverage. Numerous videos going viral on the internet claim that drinking matcha increases hair loss. Is it true? If yes, how?

6 Yoga asanas that can prevent hair fall and strengthen hair

For years, American minds and bodies were powered by a steaming cup of joe. But then came matcha, its greener alternative in every sense. From a fancy recipe to better health effects, people quickly stocked up on the Japanese powdered green tea.According to Matcha.com, matcha finds its origin in China. It was introduced to Japan in the 1100s by a Zen Buddhist monk who brought the tea seeds along, after returning from studying in the country. A combination of two Japanese words, ‘Matsu’ meaning to rub or daub and ‘Cha’ meaning tea, the drink soon gained fame in the country.Made by whisking the tea powder with hot water, the beverage made the journey across global borders with the help of social media, in the recent years. People were elated to be enlightened about a caffeine-containing beverage that could replace coffee and its side effects.All was good with matcha until it wasn’t. Recently, there have been numerous reels on how it accelerates hair loss, alarming users, often women. Can drinking matcha really have you losing more hair?Mostly, people have found that matcha increases hair loss when they increase its intake. While it might be contributing to it, the tea doesn’t have a direct connection to the hair loss.“If you find that you’re losing hair after increasing your intake of matcha, it might not be the tea itself, but the tannins in the tea,” said Stephanie Schiff, a registered dietitian nutritionist at Northwell Huntington Hospital, to The Post.Tannins are plant-based compounds packed with antioxidants. Copious amounts of them can bind to the iron inside the body, and hamper its absorption. Thus, reducing the amount of an essential nutrient in the body, one that it can’t create itself and must receive from external food and supplements. According to a 2017 study published in Current Developments of Nutrition, tannins were found to impair the bioavailability of iron in the body. As a result, the iron deficiency can then lead to hair loss. But, it’s not just tannins, caffeine can still be the culprit. 1 to 2g of matcha contains up to 80mg of the stimulant. When you drink the tea in regular intervals throughout the day, the caffeine intake is increased. This raises stress hormones and can trigger temporary shedding, said Amy Shapiro, a registered dietitian and nutritionist, to the website.A 2025 Nutrients study found excessive amounts of caffeine to increase the secretion of stress hormone cortisol. According to a 2021 mouse study published in Nature, chronic stress can cause hair follicle stems to stay in an extended resting phase thus stopping hair regeneration and increasing hair loss. Since there is no specific amount of matcha that increases hair fall, Shapiro suggested limiting the servings of the drink to one to two per day.She noted that those most at risk are people who are already tackling iron deficiency, heavy menstrual losses, certain gastrointestinal conditions or vegans with less iron intake.Additionally, it is better to avoid high-dose green tea extracts or supplements as they have a higher risk of side effects than the tea alone.While matcha can still be the drink you reach out to every day, all you need to do is reduce the number of times you do so, if hair loss is a concern.Note: The information provided in this article is for educational purposes only and is not intended as medical advice. Always consult with a qualified healthcare professional before starting any new medication or treatment and before changing your diet or supplement regimen.


Source link

7 11, 2025

XRP Price Prediction: Is XRP Gearing Up for a Major Breakout as Ripple’s 2026 Roadmap and Bullish Momentum Strengthen Market Outlook?

By |2025-11-07T07:32:11+02:00November 7, 2025|Crypto News, News|0 Comments

After months of uncertainty and sideways trading, XRP is once again drawing attention as renewed optimism, bullish technical setups, and Ripple’s bold 2026 roadmap ignite market excitement.

With the crypto market showing signs of recovery, traders are closely watching XRP’s price structure near the $2 support zone, which could determine whether the token is gearing up for its next major breakout or facing another round of consolidation.

Ripple’s Price Rebounds Amid Renewed Optimism

XRP price today is showing fresh signs of strength after weeks of consolidation, with Ripple’s native token regaining momentum around the $2.30–$2.35 range. Following a 3.5% daily gain, XRP’s market cap rose by nearly $4.5 billion, driven by renewed investor confidence after Ripple unveiled its ambitious 2026 strategic roadmap during the recent Swell 2025 event.

Brad Garlinghouse, Ripple’s CEO, lightheartedly endorsed saying “on XRP” instead of “on XRPL” during a Ripple Swell 2025 discussion about casual phrasing for XRP Ledger activities. Source: Brad Garlinghouse via X

At the conference, Ripple CEO Brad Garlinghouse highlighted major developments that have positioned the company for long-term growth. These include a $500 million funding round at a $40 billion valuation, several acquisitions, and new product launches aimed at improving crypto liquidity and institutional access.

“We’re doubling down on infrastructure and global regulation clarity,” Garlinghouse said, emphasizing Ripple’s commitment to advancing enterprise-grade crypto solutions and advocating for transparent oversight.

XRP Approaches Critical Technical Zone

Technically, XRP has been trading within a downward channel for months, forming lower highs and lower lows—a typical pattern in a bearish cycle. However, analysts say the structure is now nearing a critical support confluence between $1.75 and $2.00, where strong buying pressure has historically emerged.

XRP Price Prediction: Is XRP Gearing Up for a Major Breakout as Ripple’s 2026 Roadmap and Bullish Momentum Strengthen Market Outlook?

XRP is currently trading at its most favorable buy zone in months, presenting a potential opportunity for investors. Source: 𝐊𝐚𝐦𝐫𝐚𝐧 𝐀𝐬𝐠𝐡𝐚𝐫 via X

Crypto trader Kamran Asghar (@Karman 1s) noted that XRP is at its “best buy zone in months,” pointing to neutral RSI readings around 40 that indicate the potential for a rebound. He suggested that if the current support zone holds, XRP could see a short-term bullish correction toward $2.50.

“This setup offers a clean risk-to-reward opportunity if bulls manage to defend the zone and regain momentum,” Asghar explained.

Breakout Speculation Builds Among Traders

On social platform X, Web3 analyst @X Four iv celebrated what he described as the start of XRP’s next breakout phase, writing, “The multi-month consolidation is done. Full send mode initiated.”

Breakout Speculation Builds Among Traders

XRP has broken out of its multi-month consolidation, signaling the start of strong upward momentum. Source: FOUR | Crypto Spaces via X

His analysis shows XRP testing the upper end of its consolidation range around $2.45–$2.55, a zone closely aligned with its 50-day and 200-day exponential moving averages (EMAs). Clearing this area could pave the way for a decisive move toward $2.50 resistance and potentially higher if momentum persists.

While optimism grows, analysts warn of volatility ahead. A short-term sell wall near $2.55 could temporarily stall the rally, especially if broader crypto sentiment weakens.

Ripple’s 2026 Plan Fuels Institutional Interest

Ripple’s newly revealed 2026 roadmap has also boosted investor sentiment across the Ripple XRP ecosystem. The company plans to focus on crypto infrastructure, custody services, and prime brokerage solutions, steering away from launching its own exchange.

Garlinghouse reaffirmed that XRP remains the core of Ripple’s ecosystem, emphasizing its growing utility in global payments and liquidity management. He also hinted that institutional demand could surge once the Crypto Market Structure Bill is passed and an XRP ETF approval becomes reality—something many in the community expect in the coming months.

“Once institutional products like an XRP spot ETF launch, we could see inflows similar to what Ethereum experienced after its ETF approval,” Garlinghouse added.

XRP Price Forecast and Outlook

XRP currently trades between $2.29 and $2.35, with analysts split on which direction the action will take in the near future. Although bulls expect a bounce toward $2.50–$2.55, others think a break below $1.75 support might expose XRP to deeper losses before any meaningful rebound.

Ripple’s 2026 Plan Fuels Institutional Interest

XRP was trading at around 2.30, up 2.52% in the last 24 hours at press time. Source: Brave New Coin

Still, the combination of fundamental growth, strong on-chain liquidity, and renewed institutional interest supports a constructive long-term outlook. Many experts view the price of XRP as undervalued relative to Ripple’s progress in enterprise blockchain adoption.

If the bullish momentum sustains, XRP’s next target will be the $2.50-$2.70 zone, with more gains possible into 2026 as regulatory clarity and product expansion strengthen investor confidence.

Final Thoughts

With Ripple’s roadmap for 2026 strengthening its market narrative and XRP finding firm support near $2, momentum appears to be building toward a potential breakout. Technical traders are watching the $2.50 level closely, as a confirmed close above that resistance could validate a new bullish phase for Ripple XRP.

As XRP price predictions for 2025 and beyond continue to evolve, the token’s next moves could be shaped by ETF developments, institutional adoption, and ongoing market sentiment surrounding the broader crypto economy.

Source link

7 11, 2025

An enterprise blockchain without mining

By |2025-11-07T06:10:16+02:00November 7, 2025|News, NFT News|0 Comments


Microsoft Azure has just released a Blockchain-as-a-Service product that uses Ethereum to support blockchain with a set of templates to deploy and configure your choice of blockchain network. This can be done with minimal Azure and blockchain knowledge.

The conventional blockchain in the open is based on Proof-of-Work (PoW) and requires mining as the parties do not trust each other. An enterprise blockchain does not require PoW but is based on Proof-of-Authority (PoA) where approved identities or validators on a blockchain, validate the transactions on the blockchain.

The PoA product features a decentralized application (DApp) called the Governance DApp. Blockchains in this new model can be deployed in 5-45 minutes depending on the size and complexity of the network.

The PoA network comes with security features such as identity leasing system to ensure no two nodes carry the same identity. There are also other features to achieve good performance.

  • Web assembly smart contracts: Solidity is cited as one of the pain areas when developing smart contracts on Ethereum. This feature allows developers to use familiar languages such as C, C++, and Rust.
  • Azure Monitor: Used to track node and network statistics. Developers can view the underlying blockchain to track statistics while the network admins can detect and prevent network outages.
  • Extensible governance: With this feature, customers can participate in a consortium without managing the network infrastructure. It can be optionally delegated to an operator of their choosing.
  • Governance DApp: Provides a decentralized governance in which network authority changes are administered via on-chain voting done by select administrators. It also contains validator delegation for authorities to manage their validator nodes that are set up in each PoA deployment. Users can audit change history, each change is recorded, providing transparency and auditability.
  • Unlock access to the largest independent learning library in Tech for FREE!

    Get unlimited access to 7500+ expert-authored eBooks and video courses covering every tech area you can think of.

    Renews at $19.99/month. Cancel anytime


Source: Microsoft Blog


Along with these features, the Governance DApp will also ensure each consortium member has control over their own keys. This enables secure signing on a wallet chosen by the user.

The blog mentions “In the case of a VM or regional outage, new nodes can quickly spin up and resume the previous nodes’ identities.

To know more visit the official Microsoft Blog.

Read next

Automate tasks using Azure PowerShell and Azure CLI [Tutorial]

Microsoft announces general availability of Azure SQL Data Sync

Microsoft supercharges its Azure AI platform with new features


Source link

7 11, 2025

XAG/USD steadies above 50-day SMA after sharp 16% correction

By |2025-11-07T06:03:28+02:00November 7, 2025|Forex News, News|0 Comments


Silver (XAG/USD) extends its recovery for the third consecutive session on Thursday, trading near $48.70, up nearly 2.40% on the day, as buyers return after defending the $45.00-$46.00 demand zone.

The rebound follows a sharp correction that saw the metal fall nearly 16% from its all-time high of $54.86 earlier this month to a one-month low of $45.56, before stabilizing above its 50-day Simple Moving Average (SMA).

The latest leg higher appears to be driven more by technical buying than fresh fundamental catalysts, as improved risk sentiment surrounding the US-China trade truce has, in fact, limited safe-haven demand for precious metals.

However, some support stems from the Federal Reserve’s (Fed) interest rate cut on Wednesday, though the upside remains capped after markets interpreted it as a hawkish cut following Fed Chair Jerome Powell’s signal that further policy easing is unlikely, saying that “a further reduction in the policy rate at the December meeting is not a foregone conclusion.”

From a technical perspective, the daily chart continues to show a broader uptrend despite the recent sharp correction. On the upside, immediate resistance is seen in the $49.00-$49.50 zone, which has capped gains in recent sessions and coincides with the 21-day SMA. A decisive close above this area would strengthen the case for a resumption of the uptrend.

On the downside, initial support lies at Thursday’s low of $47.26, followed by $45.56, the October 28 low, which closely aligns with the 50-day SMA, a region where dip-buying interest has recently emerged. A break below this zone would risk extending the corrective pullback toward the next key area around $44.50-$43.00.

The Relative Strength Index (RSI) has recovered to 53 after briefly dipping below the neutral 50 mark, suggesting that bearish momentum has slightly eased while buyers are beginning to regain control. Overall, Silver maintains a constructive near-term outlook, with the broader trend still intact as long as the metal holds above $45.50.

Meanwhile, the Fixed Range Volume Profile drawn from the September 18 low of $41.20 to the all-time high of $54.86 shows the Point of Control (POC) around $48.20-$48.50, indicating a critical area of volume-based support where recent consolidation has been concentrated.

Silver FAQs

Silver is a precious metal highly traded among investors. It has been historically used as a store of value and a medium of exchange. Although less popular than Gold, traders may turn to Silver to diversify their investment portfolio, for its intrinsic value or as a potential hedge during high-inflation periods. Investors can buy physical Silver, in coins or in bars, or trade it through vehicles such as Exchange Traded Funds, which track its price on international markets.

Silver prices can move due to a wide range of factors. Geopolitical instability or fears of a deep recession can make Silver price escalate due to its safe-haven status, although to a lesser extent than Gold’s. As a yieldless asset, Silver tends to rise with lower interest rates. Its moves also depend on how the US Dollar (USD) behaves as the asset is priced in dollars (XAG/USD). A strong Dollar tends to keep the price of Silver at bay, whereas a weaker Dollar is likely to propel prices up. Other factors such as investment demand, mining supply – Silver is much more abundant than Gold – and recycling rates can also affect prices.

Silver is widely used in industry, particularly in sectors such as electronics or solar energy, as it has one of the highest electric conductivity of all metals – more than Copper and Gold. A surge in demand can increase prices, while a decline tends to lower them. Dynamics in the US, Chinese and Indian economies can also contribute to price swings: for the US and particularly China, their big industrial sectors use Silver in various processes; in India, consumers’ demand for the precious metal for jewellery also plays a key role in setting prices.

Silver prices tend to follow Gold’s moves. When Gold prices rise, Silver typically follows suit, as their status as safe-haven assets is similar. The Gold/Silver ratio, which shows the number of ounces of Silver needed to equal the value of one ounce of Gold, may help to determine the relative valuation between both metals. Some investors may consider a high ratio as an indicator that Silver is undervalued, or Gold is overvalued. On the contrary, a low ratio might suggest that Gold is undervalued relative to Silver.


Source link

7 11, 2025

Japanese Yen Forecast: USD/JPY Rises as Weak Spending Tempers BoJ Hike Bets

By |2025-11-07T05:50:08+02:00November 7, 2025|Forex News, News|0 Comments

FX Empire – Survey of Consumers – University of Michigan

Waning consumer confidence and elevated inflation expectations could signal a pullback in consumer spending. Softer spending trends could dampen inflation and the US economy, given that private consumption accounts for roughly 65% of GDP.

A cooling inflation outlook and potential loss of economic momentum may raise expectations of a December Fed rate cut. A more dovish Fed rate path could push USD/JPY toward the 50-day Exponential Moving Average (EMA).

On the other hand, a pickup in consumer sentiment and easing inflation expectations could signal an upswing in consumer spending, supporting a less hawkish Fed policy stance. Fading bets on a December Fed rate cut could send USD/JPY toward the November 4 high of 154.483.

Fed Speakers in Focus as Labor Market Data Flashes Red

Beyond the data, FOMC members’ speeches will require consideration, given growing concerns about the US labor market. According to Challenger, Gray, & Christmas data, job cuts soared from 54.064k in September to 153.074k in October, raising bets on a December Fed rate cut.

According to the CME FedWatch Tool, the chances of a December policy adjustment rose from 62.0% to 70.6% on Thursday, November 6.

Growing Fed support for a rate cut in December could weigh on the US dollar, supporting a USD/JPY fall toward 151 and the 50-day EMA. Conversely, continued concerns about elevated inflation, despite a cooling labor market, may send the pair toward 154.483.

Given the US labor market data and potential impact on wage growth and spending, the near-term outlook looks bearish for USD/JPY.

USD/JPY Scenarios: Diverging Monetary Policies

  • Bearish USD/JPY Scenario: Hawkish BoJ rhetoric, intervention threats, weak US data, and dovish Fed cues could push USD/JPY toward 151.
  • Bullish USD/JPY Scenario: Dovish BoJ commentary, strong US data, and hawkish Fed policy signals could send USD/JPY toward 154.483.

Source link

7 11, 2025

FDA recalls a popular supplement after a salmonella outbreak

By |2025-11-07T05:36:18+02:00November 7, 2025|Dietary Supplements News, News|0 Comments


A recall has been issued for Member’s Mark Super Greens dietary supplement powder after 11 people in seven states got sick from salmonella. Three were hospitalized, and the product was sold nationwide at Sam’s Club stores and online.

Investigators linked the illnesses to moringa leaf powder used in the product. Officials report that contamination likely traces to a single lot that moved through several distributors.

About the salmonella recall

This investigation is being led by the U.S. Food and Drug Administration (FDA), the federal agency that oversees food safety. Its team focuses on tracing foodborne hazards and coordinating recalls during outbreaks.

FDA’s investigation points to a single lot of organic moringa leaf powder and, as a result, all versions of Member’s Mark Super Greens were recalled, the agency said in its advisory.

Cases span Florida, Kansas, Michigan, New York, North Carolina, South Carolina, and Virginia, with illnesses reported between May and September 2025.

State laboratories in Virginia and Michigan found Salmonella in leftover powders collected from patients’ homes, and the bacteria matched the outbreak strain. Those results support the FDA traceback to a supplier in Jodhpur, India.

Moringa is a botanical, a plant used for food or supplements, that is often sold as a dried leaf powder. In many blends, that powder is consumed without cooking.

The implicated lot was identified as VFD/ORG/MORP/L/24 with a best by date in November 2027. FDA notes the product was distributed in stores and online across the United States.

How dry powder can cause illness

Salmonella can persist in low-moisture foods, foods with little available water, far longer than many people realize, according to a scientific review.

Survival under dry conditions can also increase heat tolerance, which complicates control during processing.

Powders that are not cooked before use pose a particular risk. If harmful bacteria are present, they can ride along in a smoothie, shake, or drink.

Spice and herb ingredients have a documented recall history with Salmonella, as the FDA’s risk shows. Blends may combine inputs from many sources, which can spread a contaminated lot across wide markets.

This is not the first time a powdered nutrition product has been tied to illness in the United States. A published outbreak investigation linked Salmonella Virchow infections to a raw powdered meal replacement, reinforcing the hazard.

What you should do

“Do not eat any Member’s Mark Super Greens powdered supplements containing moringa leaf powder,” CDC said in a public alert. Throw them away or return them to the store.

If the powder touched counters, scoops, blenders, or storage containers, wash them with hot, soapy water or run them through a dishwasher. If you have symptoms such as diarrhea, fever, or stomach cramps, contact a clinician for guidance.

Illness usually develops within 12 to 72 hours and often lasts 4 to 7 days. Children, older adults, and immunocompromised, people whose immune system is lowered by illness or treatment, are more likely to need medical care.

CDC notes it may add other products containing moringa leaf powder from this importer as the investigation proceeds. Check agency pages for updates and follow local health department advice.

Salmonella recall investigation

Outbreak teams use traceback, step by step review of supply chain records, to follow ingredients from retail shelves to importers.

In this event, records from multiple points of sale converged on a single importer, which narrowed the search.

Officials then used whole genome sequencing, a method that reads all DNA in a sample, to compare bacteria from people and leftover powder. The genetic matches supported a common source and strengthened the case for recall.

The FDA reports the last known illness onset was September 4, 2025, which helps bracket exposure. Timing guides interviews and sampling while the recall proceeds.

The agency also noted that Sam’s Club has stopped distribution and contacted customers about the recall. If investigators find other products that used the implicated lot, the FDA and CDC will add them to public notices.

The FDA has also posted a separate warning about imported aluminum and brass cookware that can leach lead into food.

They explain that lead is toxic to humans and can affect people of any age or health status, and there is no known safe level of exposure to lead.

The agency added six additional products to its list on October 15, 2025, and testing continues. People who own listed items should throw them away rather than donate them.

Children and pregnant people face greater risk from lead exposure because their bodies absorb more per pound. If you are concerned about exposure, ask a clinician about a simple blood test.

Food safety is about ingredients and tools, so it pays to watch both the supplements you use and the cookware you cook with. Updates will post to FDA and CDC pages as the investigation moves forward.

—–

Like what you read? Subscribe to our newsletter for engaging articles, exclusive content, and the latest updates. 

Check us out on EarthSnap, a free app brought to you by Eric Ralls and Earth.com.

—–


Source link

7 11, 2025

Solana Price Prediction: SOL Eyes Major Reversal as Bulls Defend Key $150 Support Zone

By |2025-11-07T05:30:20+02:00November 7, 2025|Crypto News, News|0 Comments

Solana price has entered a key demand zone between $150 and $160, with participants watching closely for signs of a potential bullish reversal after weeks of consolidation.

After fading momentum, Solana is finally showing a bullish perspective ahead. Solana price has dipped into a familiar demand zone where past rallies have often begun, sparking renewed optimism among participants.

Reversal Attempts Emerge in Solana’s Demand Zone

After an extended consolidation phase, Solana has now dipped into a major demand zone between $150 and $160, a region that has repeatedly acted as a springboard in previous cycles. BitGuru’s structure indicates that buyers are beginning to re-accumulate, with early signs of a potential reversal visible in the intraday chart.

Solana’s price tests a key demand zone between $150 and $160, where early reversal signs hint at renewed buyer strength. Source: BitGuru via X

If this base continues to hold, a short-term rebound towards $175 to $185 appears likely, matching prior resistance clusters. The presence of bullish divergence on lower timeframes adds further weight to the possibility that Solana price may be entering a bottoming accumulation stage following weeks of corrective pressure.

Potential Double Bottom Structure Forming

CryptoBusy’s latest SOL chart showcases a developing double-bottom formation near the $146 to $150 range, a pattern often signaling trend exhaustion and reversal. The neckline for confirmation sits around $170, and a breakout above this could trigger the next impulse wave.

Solana Price Prediction: SOL Eyes Major Reversal as Bulls Defend Key 0 Support Zone

Solana forms a potential double-bottom pattern near $146 to $150, signaling possible trend reversal ahead. Source: CryptoBusy via X

This setup gains credibility as volume has shown mild expansion on recent upticks, while RSI is stabilizing near oversold territory. As long as Solana price maintains structural integrity above $145, the risk-reward remains favorable for an eventual breakout attempt.

Institutional Outlook Supports Long-Term Bull Case

A latest statement from Bitwise CIO has emerged in which its believed that Solana price could 5× its market share in the coming cycles. This view reinforces the broader thesis that current price levels significantly undervalue Solana’s network strength and scalability.

Institutional optimism aligns with on-chain growth and increasing adoption. Despite short-term volatility, long-term fundamentals position Solana as one of the most promising large-cap networks heading into 2026.

Solana Price Analysis

Solana’s break below $180 has pushed it towards a key weekly demand block between $120 and $130, a region that historically triggered large reversals. Despite recent weakness, SOL’s broader higher-timeframe structure remains bullish as long as this block holds firm.

Institutional Outlook Supports Long-Term Bull Case

Solana tests its weekly demand block between $120 and $130, with buyers aiming to defend the zone for a potential rebound. Source: ShangoTrades via X

ShangoTrades believes that if SOL buyers can defend this range, a relief bounce towards $180–$200 becomes the likely scenario. A clean weekly close below $120, however, would invalidate the mid-term bullish bias and expose deeper retracement levels near $100. Until that point, the Solana price still represents a higher-low formation zone within the macro uptrend.

Solana Price Prediction: Bullish Structure Points Towards $320

Robo’s analysis on the Solana weekly chart reveals a large ascending triangle pattern that has been forming since early 2023. The support trendline has held firm through multiple tests, while resistance near $280 to $300 continues to compress price action into a tightening apex.

Solana Price Prediction: Bullish Structure Points Towards $320

Solana’s long-term structure forms a massive ascending triangle, hinting at a breakout target toward $320. Source: Robo via X

The measured move from this structure suggests a breakout target around $320, which would align with Solana’s next major Fibonacci extension zone. Momentum indicators also remain constructive, with MACD flattening and long-term EMAs aligning for a potential crossover. As Robo puts it, “good things take time”, and the weekly outlook indeed signals brewing strength beneath the surface.

Final Thoughts

Solana’s multi-timeframe picture paints a story of gradual recovery after deep corrective pressure. From the $150 to $160 demand zone to the potential double-bottom and ascending-triangle formation, technical confluence continues to build in favor of accumulation.

Institutional support, led by comments from Bitwise and sustained network activity, reinforces Solana’s standing as a top contender for the next market expansion phase. If short-term supports hold and $180 is reclaimed, the stage could be set for a steady climb towards $250 to $320 in the coming months.

In essence, while volatility persists, Solana’s structural resilience and growing ecosystem point to renewed upside potential as 2025 unfolds.


Source link

7 11, 2025

Gold (XAU/USD) Price Forecast: Bear Flag Reasserts Control Below 10-Day MA

By |2025-11-07T04:02:19+02:00November 7, 2025|Forex News, News|0 Comments


Bear Flag Status

Tuesday’s initial bear-flag breakdown has produced almost no follow-through yet, but today’s rejection at the flag’s top (10-day MA) keeps bears in control. A drop below today’s $3,964 low triggers a second breakdown signal; confirmation arrives beneath Tuesday’s $3,929 low, with the $3,886 swing low as the next domino.

Primary Support Zone

The 50-day average ($3,867 and rising) converges with the 50% retracement at $3,846, forming the highest-probability bounce zone. Given the sluggish bearish momentum, the 50-day line may climb above the $3,886 swing low before price ever reaches it, tightening the support pocket further.

Deeper Targets if Support Fails

Should $3,846–$3,867 crack, the 61.8% Fibonacci at $3,720 enters play alongside the rising channel centerline—both logical destinations after mid-October’s false bullish breakout above the same channel.

Upside Validation

Bulls reclaim near-term momentum only with a rally back above the 10-day average and today’s $4,020 high. That would open a retest of the 20-day line at $4,083 (last week’s bounce stalled at $4,046, well short of target).

Weekly Inside Week Setup

With two trading days remaining, gold is on track to close as an inside week. Inside weeks following extreme moves routinely precede sharp directional breaks; next week’s resolution above or below this week’s $3,929–$4,020 range will dictate the next swing.

Outlook

Continued chop is expected until the 50-day average and 50% retracement provide support near $3,846–$3,867. That confluence, combined with the false bullish channel breakout in mid-October and the rising channel centerline, marks a high-probability area for a bullish reversal. Failure there targets the 61.8% level at $3,720. On the weekly chart, an inside week setup positions gold for a potential breakout next week. Hold above the recent swing low at $3,886 maintains the broader uptrend; a decisive rally above the 10-day average and $4,020 high targets the 20-day line at $4,083.


Source link

7 11, 2025

Rallies After BoE Pause (Chart)

By |2025-11-07T03:49:18+02:00November 7, 2025|Forex News, News|0 Comments

  • The British pound rallied early Thursday following the Bank of England’s decision to hold rates, but the overall trend remains bearish.
  • Resistance sits near 1.32, with downside risks below 1.30 potentially extending toward 1.2750.

The British pound has rallied significantly during the early hours on Thursday as the market reacts to the Bank of England and its interest rate decision, which was to keep things as they were. However, it’s also worth noting that the Bank of England is narrowly maintaining its stance. With that being the case, I believe we are still very much in a downtrend, and I’ll be watching the 1.32 level for potential resistance. That area had previously acted as support, and the 200-day EMA moving toward that zone also adds to the resistance that we could see on any attempt to break higher.

Ultimately, this move looks like a rebound from the 1.30 level, a large round number with psychological significance that attracts plenty of market attention. If and when we break down below 1.30, the British pound will likely target the 1.2750 level. Conversely, a break above the 200-day EMA, currently at 1.3265, might signal a recovery, though it’s important to remember that we remain well below that moving average, and this is what some people will look at to determine the longer-term trend in a market.

The 50-day EMA is now dropping sharply toward the 200-day EMA, setting up the possibility of a “death cross.” The prior uptrend line has been broken, retested, and then followed by another sell-off. All things considered, this is a market where traders are likely watching for signs of exhaustion to start selling into. While the pound’s reprieve for the day may draw attention, it doesn’t change the overall downward trajectory of this currency pair.

Ready to trade the Forex GBP/USD analysis and predictions? Here are the best forex trading platforms UK to choose from.

Christopher Lewis has been trading Forex and has over 20 years experience in financial markets. Chris has been a regular contributor to Daily Forex since the early days of the site. He writes about Forex for several online publications, including FX Empire, Investing.com, and his own site, aptly named The Trader Guy. Chris favours technical analysis methods to identify his trades and likes to trade equity indices and commodities as well as Forex. He favours a longer-term trading style, and his trades often last for days or weeks.

Source link

Go to Top