A DeFi legislative initiative proposed by Senate Democrats burns hot against Republicans and crypto supporters due to a possible crypto crackdown.
A new decentralized finance (DeFi) legislative proposal brought forward by Senate Democrats has elicited controversial reactions among Republican members of parliament and cryptocurrency supporters.
The initiative, which is aimed at deterring illicit activity in DeFi, is already facing criticism because it could potentially cut innovation and cause crypto developers to flee to other countries.
The three-page proposal submitted to Republicans by the Senate Banking Committee Democrats gives the Treasury Department and other regulators considerable power to make judgments as to whether an entity is exerting control over DeFi protocols.
It makes any person engaged in the design, deployment, or control of front-end services of DeFi protocols intermediaries subject to financial regulation.
These broad definitions might be useful in making significant operations in a decentralized network criminal.
DeFi Innovation vs. Regulation: Who Wins?
The leaders of the crypto industry were quick to criticize the move as unfeasible to adhere to. CEO of the Blockchain Association, Summer Mersinger, cautioned that the bill would amount to banning decentralized finance, wallet development, and other applications, and would drive responsible developers out of the US market.
Law specialists also criticized the bill. Jake Chervinsky, the chief legal officer at Variant Fund, described it as deeply unserious and compared it to a virtual crypto ban, which endangers the advancement of bipartisan crypto legislation.
The knowledge of your customer (KYC) procedures on all DeFi frontends in the proposal was explained as unrealistic to numerous decentralized initiatives.
The Republicans in the committee reacted negatively. According to a spokesperson of the GOP, the draft of the Democrats was not an offer to legislate and contained several incoherent policy concepts, representing a failure of the Democrats to negotiate in good faith.
Although the republicans are willing to liaise on the market structure, arguments on the proposal by the democrats have been at a standstill.
The Future of DeFi and Regulatory Tug of War.
The legislative text represents an opportune point in crypto regulation in the partisan stalemate.
The Senate still does not balance its variant of crypto market regulation with the CLARITY Act introduced in the House. The current debate is on the most appropriate way to regulate DeFi protocols, between the objective of fostering innovation and the anti-money laundering and investor protection objectives.
The plan by the democrats focuses on sealing regulatory loopholes and minimizing risks of illegal financing, and it seeks to place a tight rein on the decentralized systems.
Nevertheless, other people working in the crypto industry contend that these limitations may suffocate the expansion of DeFi to the detriment of the US blockchain competitive advantage.
The question of whether DeFi will be regulated in the Senate is unresolved, as the bipartisan cooperation stands at a full stop, and the industry resistance is increasing.
The result will have a massive effect on the growth and implementation of decentralized finance in the United States.
It may be time to call the vet. Because Dogecoin is not doing that well, man.
Today’s historic market crash caused nearly all digital assets to lose a substantial amount of value. Bitcoin itself saw a 10% drop throughout this Friday, while altcoins took an even harder hit. While the total market capitalization of crypto lost nearly 10% in value, the capitalization of digital assets excluding BTC bled by over 12% in that same timeframe.
And for DOGE, the memecoin was among the hardest hit. Dogecoin dropped by over 26% in a single day, making it one of the worst-performing large-cap assets in the entire market. Today’s drop drove DOGE to reach one of its lowest values in the year, kickstarting a wave of panic selling and forced liquidations across retail-heavy platforms.
What to Make of Dogecoin’s Drop
A couple of days ago, we talked about how Dogecoin was reaching a make-or-break zone, as an uptrend approached the $0.25 resistance level, forming what looked like an ascending triangle pattern. Well, so much for that! In this pivotal moment for Dogecoin’s price action, it’s clear that it broke — rather than made.
Dogecoin didn’t just fail a breakout at $0.25, however. During its path downward, bears completely broke through several resistances, causing a full structural collapse in DOGE’s short-term price action.
There is a silver lining, though.
$DOGE dropped as low as $0.15 this Friday, but bulls quickly worked to bring the price back closer to $0.20. What that move also did was give the bulls a better fighting chance, as it brought the currency back above its 3-year uptrend line.
However, price action will ultimately have little weight against the massive financial repercussions of a new trade war between the U.S. and China. In the short term, Dogecoin may find temporary relief above its long-term trendline, but relief doesn’t mean recovery. In all likelihood, crypto’s recovery will depend on how geopolitical developments unfold over the coming weeks.
The cryptocurrency market was rocked today as XRP, Ripple’s native token, plunged from around $3 to $2.38 within minutes, erasing much of its recent gains and shaking investor confidence. The sudden crash — a steep 20% decline from its weekly peak — unfolded rapidly during mid-day trading and underscores the ongoing volatility gripping digital assets.
At the time of writing, XRP is trading near $2.36, down roughly 0.16% over the past 24 hours, with intraday lows touching $1.89 — the steepest hourly slide seen in weeks. The dramatic move left traders scrambling and reignited debate over Ripple’s short-term outlook.
Massive XRP Sell-Off Amid Wider Crypto Weakness
The price collapse was not an isolated event. Bitcoin and Ethereum also fell sharply in the same window, driven by a stronger U.S. dollar, rising Treasury yields, and a shift toward risk-off sentiment across global markets. Analysts point to a confluence of macroeconomic factors and internal crypto dynamics fueling the XRP drop.
On-chain data shows that major holders — commonly known as “whales” — initiated large sell-offs during XRP’s recent rally above $3. This triggered a cascade of automated stop-loss orders and liquidations, accelerating the sell pressure. “XRP’s run to $3 looked strong, but underlying sell pressure was building for days,” one analyst said. “When whale movements coincided with macro headwinds, the result was a sharp and sudden reversal.”
Despite the turbulence, some traders note that accumulation among long-term holders has quietly increased, hinting that confidence in Ripple’s fundamentals may still be intact despite short-term volatility.
Ripple Developments and Market Reaction
The crash follows a string of major announcements from Ripple Labs in recent weeks. The U.S. Securities and Exchange Commission (SEC) concluded its multi-year lawsuit against the company in August, with Ripple agreeing to pay a $125 million settlement — a resolution widely seen as clearing a key legal overhang. More recently, Ripple revealed plans to acquire prime broker Hidden Road for $1.3 billion, a move aimed at expanding its footprint in institutional crypto services.
While these developments strengthen Ripple’s strategic position, the near-term price action highlights how quickly sentiment can shift in the crypto market. XRP’s sharp drop also coincided with broader concerns over global economic policy, including new tariff tensions and monetary tightening, further spooking risk-asset investors.
What’s Next for XRP After the Sudden Plunge?
Market analysts are now watching whether XRP can hold key support around $2.30. If that level breaks, a slide toward $2.00 is possible. Conversely, a decisive push back above $2.70 could reignite bullish momentum and restore confidence among retail investors.
For now, traders are bracing for continued volatility. With whale movements, macroeconomic pressures, and sentiment swings all influencing prices, rapid and unpredictable shifts remain the norm. XRP’s fall from $3 to $2.38 in minutes is a stark reminder of how quickly fortunes can change in the crypto market.
The bottom line: XRP’s fundamentals remain strong following its legal victory and strategic expansion plans, but short-term price action is dominated by macro headwinds and large-scale profit-taking. Extreme volatility remains the defining feature of this market — and traders should prepare for more sharp moves ahead.
FYI (keeping you in the loop)-
Q1: Why did XRP crash today?
XRP crashed due to a combination of whale sell-offs, macroeconomic headwinds, and automated liquidations triggered as support levels broke.
Q2: What is XRP’s current price?
As of the latest update, XRP is trading near $2.36 with intraday lows around $1.89 after falling sharply from $3.
Q3: Can XRP recover from this drop?
Analysts say recovery depends on holding support near $2.30 and reclaiming $2.70 resistance. Macro conditions and Bitcoin’s direction will also be key.
Q4: What recent news is affecting Ripple?
Ripple recently settled its SEC lawsuit with a $125 million payment and announced a $1.3 billion acquisition of prime broker Hidden Road.
Q5: What are analysts watching next?
Traders are closely monitoring whale activity, macroeconomic trends, and whether XRP can maintain support above $2.30.
References
Barron’s. (2025). “Bitcoin, Ethereum, XRP Fall. Why Cryptos Are Struggling Today.” October 11, 2025.
Reuters. (2025). “SEC ends lawsuit against Ripple, company to pay $125 million fine.” August 8, 2025.
Barron’s. (2025). “Crypto Firm Ripple To Buy Broker Hidden Road For $1.3 Billion. What It Means For XRP.” October 2025.
⚠️ Disclaimer
The information provided in this article is for informational and educational purposes only and does not constitute financial advice, investment guidance, or a recommendation to buy or sell any cryptocurrency or digital asset. Cryptocurrency markets are highly volatile and subject to rapid price fluctuations. Always conduct your own research and consult with a licensed financial advisor before making any investment decisions. The author and publisher assume no responsibility for any financial losses incurred based on the information presented here.
The growth is being driven by rising liquidity on DeFi protocols like Suilend and Momentum.
Sui, a layer 1 (L1) blockchain, reached a new all-time high in total value locked (TVL) of $2.6 billion on Thursday, according to data from DeFiLlama.
The figure marks a 37% increase from one month ago and a 160% jump from a year earlier, when TVL stood at around $1 billion. Sui recently surpassed $156 billion in decentralized exchange (DEX) volume, and is the sixth-largest chain by 24-hour trading volume, per CoinGecko
Meanwhile, the blockchain’s native token is changing hands at $3.39 with a market capitalization of over $12.2 billion, an 80% increase over the past year, according to CoinGecko.
The milestone reflects Sui’s expanding presence in the decentralized finance (DeFi) sector as newer L1 networks continue competing for liquidity and on-chain activity. The increase has been fueled by growing liquidity across DeFi protocols such as Suilend, Navi, and Momentum, which have drawn more users and deposits in recent weeks.
Suilend currently ranks as the largest protocol on Sui, with $745 million in TVL, up 11% over the past month. Navi follows with $723 million, a 14% monthly increase. Momentum takes third place with $551 million, marking a 249% rise over the same period.
This comes amid broader growth across the DeFi ecosystem, fueled by rising activity in lending, borrowing, and token trading. Total DeFi TVL has more than doubled over the past year, climbing 104% from $85 billion in October 2024 to $175 billion today, according to DeFiLlama.
Sui has also announced several partnerships this year that have attracted users to its ecosystem. In March, the blockchain revealed a strategic collaboration with World Liberty Financial (WLFI), a DeFi project linked to President Donald Trump. WLFI issues the USD1 stablecoin, which currently ranks as the seventh-largest stablecoin by circulating supply.
Earlier today, news broke that EVE Frontier, one of Web3 gaming’s largest projects, is set to migrate to Sui.
Using natural supplements to treat attention deficit hyperactivity disorder (ADHD) might help to manage symptoms. That said, the research evidence to support this use is limited.
1. Omega-3 Fatty Acids
Omega-3 fatty acids are essential nutrients that you must get from your diet since your body doesn’t produce them. Dietary sources include fatty fish like salmon and tuna, seeds such as flax and chia, and nuts such as walnuts.
According to some preliminary research, fish oil supplements may be more beneficial than docosahexaenoic acid (DHA). However, people with seafood allergies should be cautious taking omega-3s as it is unclear if it is safe for them to take fish oil supplements. It also may interact with blood thinner medications.
Overall, it is unclear if omega-3 supplementation is helpful for ADHD symptoms, but it may be worth looking into if the person has a deficiency.
2. Iron Supplements
Studies suggest that people diagnosed with ADHD have lower blood levels of iron, used by the body to make hemoglobin in red blood cells. Hemoglobin transports oxygen to nourish your tissues. Dietary sources of iron include meat (especially red meat), tuna, and dark leafy greens.
It’s not clear that boosting iron levels, either through diet or supplement use, can improve ADHD symptoms. There may be benefits in addressing some symptoms, like inattention or emotional control, but not in impulsivity or other behaviors.
Get Advice Before Starting Iron Supplements
Do not start taking iron supplements without first talking to a healthcare provider to see if it is necessary and safe. If a person is not deficient in iron, too much iron can cause significant problems.
3. Magnesium
Magnesium is a dietary mineral found in foods like leafy greens, nuts and seeds, whole grains, and beans and legumes. Among other things, it plays a role in regulating blood pressure and nerve and muscle function.
Some studies suggest low levels of magnesium in people with ADHD, and more severe ADHD symptoms the lower the levels appear. Research also suggests symptom improvement when magnesium supplements are added, but more data is needed to confirm these effects.
4. Zinc
Zinc is an important mineral found in certain kinds of seafood, red meat, poultry, and dairy products. You can also get dietary zinc from whole grains, beans, nuts, and fortified cereal.
There is some evidence that children with ADHD may be deficient in zinc, and that symptoms may improve when zinc levels are boosted, but results are mixed.
Side effects of zinc supplements include digestive symptoms such as nausea and diarrhea, and zinc can interact with other medications and supplements. The amount of zinc to take is highly variable depending on the person.
5. Vitamins
Vitamins have not been conclusively shown to directly affect ADHD, but researchers continue to explore their impacts. Some of the study findings include:
The potential for high-dose B6 to reduce sensory reactivity in people with ADHD
Low levels of B9 and B12 in children with ADHD, which may contribute to symptoms
Low levels of vitamin D that may be associated with ADHD
Some researchers caution that a low level of vitamin D and other nutrients might be influenced by additional factors like smoking, and that more research is needed.
Before Adding Vitamin Supplements
Recommended doses vary with the type of vitamin, age, sex, and other factors. Talk with your healthcare provider about adding vitamin supplements to your diet or how they might fit into an ADHD treatment plan.
6. Melatonin
Melatonin is a hormone secreted primarily by the pineal gland (located deep in the brain). It regulates your sleep-wake cycles. People with ADHD commonly experience sleep problems. The medications used to treat ADHD can also affect sleep.
While melatonin hasn’t been shown to improve ADHD symptoms directly, it may help people with ADHD improve their sleep. Short-term use is safe, and no significant side effects are reported. Side effects do occur, including headache, nausea, and drowsiness. Dosage depends on body weight.
7. St. John’s Wort
St. John’s wort, a flowering herb, has been best studied as an ADHD treatment. So far, there’s limited evidence of its benefits, and more research is needed.
Additionally, St. John’s wort could interact with certain ADHD medications, putting you at greater risk for serotonin syndrome, a rare but dangerous complication. Side effects can include headache, dry mouth, anxiety, and light sensitivity.
Talk with your healthcare provider about St. John’s wort dosage and any potential risks.
8. Gingko Biloba
Ginkgo biloba is an extract of a tree that grows in China. It is rich in antioxidants and is thought by some to improve symptoms in people with ADHD. The research into its effectiveness, however, is limited, and there is little evidence of its benefit in treating ADHD.
When taken as directed, Ginkgo biloba is likely safe. Reported side effects are mild and may include:
Nausea
Headache
Dizziness
Rash
A typical dose of Ginkgo biloba is 120 to 240 mg per day. Larger doses may cause vomiting and diarrhea.
Before Taking Ginkgo Biloba
Ginkgo biloba may act as a blood thinner, so if you have a bleeding disorder or are taking a blood thinner such as warfarin or aspirin, you should avoid taking Gingko biloba. Interactions with other drugs haven’t been well-studied, so ask your healthcare provider before you start taking Ginkgo biloba.
9. Ginseng
Ginseng is a plant native to eastern Asia and North America. It has been studied in combination with omega-3 fatty acids in children with ADHD.
A small study published in 2020 found that children taking a combination of 3 mg of Korean red ginseng extract and 500 mg of omega-3 had improvements in ADHD symptoms and cognitive function including attention, memory, and executive function.
However, it’s not clear how much of a role ginseng played in the reported improvements. The authors also noted that larger studies are needed to confirm the results.
Before Taking Ginseng
Ginseng may also affect blood sugar levels and can act like estrogen in the body. Do not take ginseng if you are taking a blood thinner such as warfarin. Always consult your healthcare provider before taking a new supplement.
10. Caffeine
While stimulant medications like Ritalin (methylphenidate) are used to treat ADHD, the research results on caffeine as a stimulant option are mixed. Some studies in animals suggest that caffeine may offer benefits.
Other studies have found improved focus and concentration in adults who consumed caffeine, though there’s less evidence of benefit in children. However, experts have also focused on whether caffeine is used by adults to self-medicate symptoms and traits related to ADHD.
A survey-based study of more than 2,200 people found no real evidence that caffeine was effective self-care, and there may be a higher risk of caffeine use disorder with ADHD.
What to Look For
The organization Children and Adults with Attention-Deficit/Hyperactivity Disorder (CHADD) offers some advice and questions for vetting the supplement options for ADHD:
Have clinical trials been conducted to prove this treatment works?
Is information about this treatment available from a trusted source?
Is there a respected national organization of people who practice this therapy?
Does the person administering the treatment need a state license?
Does my health insurance cover this treatment? (Insurance carriers usually won’t cover unproven treatments.)
CHADD suggests some red flags to look for that indicate the treatment is suspicious and should be avoided, including if:
They claim that the treatment works for everyone with ADHD, even though no single treatment is effective for everyone.
There is a lack of credible research and studies, and only anecdotal evidence (derived from stories people tell).
No directions are given for using it properly or the contents are not listed on medication containers.
There is no information about side effects.
They claim that the product is natural without acknowledging that “natural” does not necessarily mean safe.
There are bold claims such as the treatment is “a secret formula,” “astonishing,” “miraculous,” “an amazing breakthrough” or a “cure.”
You learn about it through infomercials or a book an author is trying to sell.
The “medication” comes by mail order instead of through a healthcare professional.
They claim that doctors unfairly talk down the treatment or won’t tell the public about it.
In the United States, the Food and Drug Administration (FDA) does not regulate supplements the way it regulates prescription drugs. That means some supplement products may not contain what the label says. When choosing a supplement, look for third-party tested products and consult a healthcare provider, registered dietitian nutritionist (RD or RDN), or pharmacist.
Solana price is testing a key bullish trendline, with participants watching closely to see if support holds or a deeper correction takes shape.
Solana is back in the spotlight as participants weigh whether its long-term bullish trendline can hold firm against growing pressure. After weeks of choppy movement, the price now sits at a key decision point where technical levels and regulatory headlines could shape the next big move.
Solana Price Testing the Bullish Trendline
Solana’s latest dip is dragging the price closer to its bullish fair value gap and long-term trendline support. This zone has repeatedly served as a launchpad, and a clean reaction here could set the tone for a rebound.
Solana price tests its bullish trendline as the market watches for a rebound or deeper move into the $210–$205 support zone. Source: BATMAN via X
If buyers defend this area again, momentum could carry the price back towards the $230 to $235 range. Holding the ascending trendline keeps the broader bullish case intact, and every successful defense strengthens confidence in higher targets. But if support gives way, Solana price could extend lower into the $210 to $205 band, where the next key demand zone sits. That area now stands as the last strong line of defense before opening the door to a deeper correction.
Bearish Daily Structure Raises Risk
On the flip side, ChiefraT says Solana continues to struggle at the $235 ceiling, with rejection signaling weakness in the short-term structure. Multiple failed retests of this level suggest sellers still hold control.
Solana faces repeated rejections at the $235 ceiling, with downside risks pointing towards $200 and below if buyers fail to step in. Source: ChiefraT via X
A move back below $200 remains possible if buyers don’t step in soon. Losing this round of support could turn the focus to $190 to $185, where demand clusters sit. For now, Solana bulls need to quickly reclaim $225 to $228 to avoid letting the bearish setup extend further, as sustained weakness here risks flipping the trend into a deeper correction.
Can SOL React Negatively to SEC ETF Delay?
Markets are also bracing for regulatory headlines, with delays around ETF approvals casting uncertainty. Solana, often more volatile than peers, tends to react strongly to such narratives.
If momentum falters while negative headlines surface, participants may push for a retest of sub-$200 zones. That would not erase the higher-timeframe bullish cycle but could shake confidence in the short term. A confirmed delay could also drain liquidity from altcoins, leaving SOL more exposed than Bitcoin. In that scenario, sentiment-driven selling could exaggerate moves lower, even beyond technical levels.
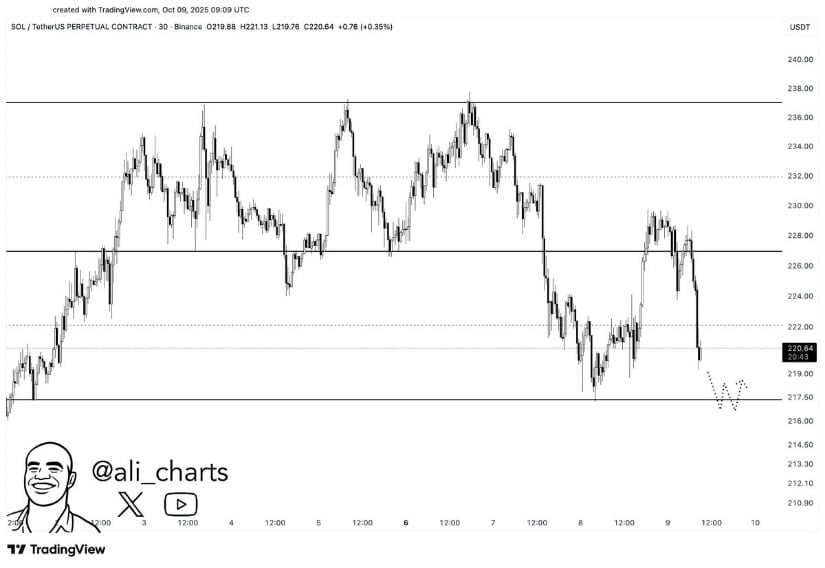
Key Levels Around $217 in Focus
The $217 mark is becoming the line in the sand for Solana price. It has acted as both resistance and support in recent sessions, meaning the next test here could decide short-term direction.
Solana price eye $217 as the pivotal level, with momentum hinging on whether price rebounds towards $230 or slides towards $210. Source: Ali Martinez via X
A clean rebound sets up a return to $230+, but if this level folds, a slide towards $210 to $208 could follow quickly. Below that, $202 to $200 become the critical zone buyers must hold. For now, traders are treating $217 as the pivot level that will determine momentum in the coming days, with volume around this region likely to show which side has the upper hand.
Final Thoughts: Larger Structure Still Intact
Despite the mixed signals, Solana’s broader structure remains intact. Higher lows continue to form across the chart, leaving the bullish trendline unbroken. This suggests the current weakness could simply be part of a larger consolidation.
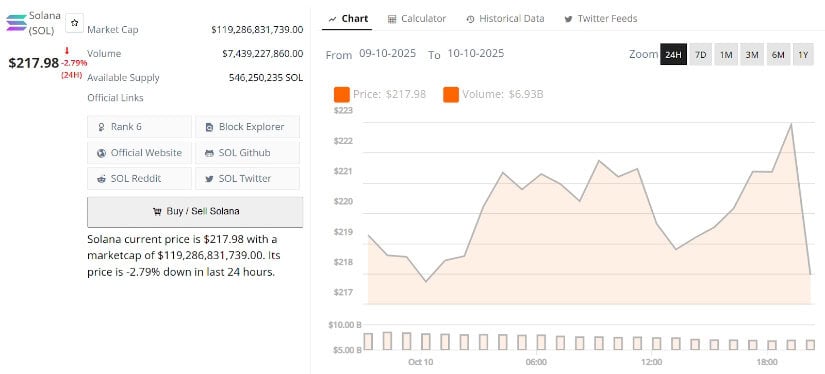
Solana current price is $217.98, down -2.79% in the last 24 hours. Source: Brave New Coin
If momentum holds steady, the next Solana leg higher still targets $240 and above. Stronger confirmation would come with a weekly close over $235, which flips resistance back into support. Until then, participants see this pullback as a key test of whether Solana is building fuel for another expansion phase. As long as the higher timeframe structure is respected, the broader cycle remains aligned with bullish expectations into Q4.
Bitcoin has pulled below $116,000, but select analysts expect buyers to step in at lower levels and arrest the decline.
Select altcoins have reached critical support levels where the buyers are expected to mount a strong defense.
Bitcoin BTCUSD attempted a recovery on Friday, but higher levels attracted selling. That has pulled the price under $116,000 as short-term traders are rushing to the exit.
Analyst Stockmoney Lizards said in an X post that BTC is witnessing a shakeout in both directions. Despite the correction, the analyst remains bullish, expecting BTC to find support around $118,000 to $119,000.
Trader Peter Brandt told Cointelegraph that “BTC could hit a bull market high any day now,” if it follows its historical cycle pattern. However, he added that cycles could change, and there is a 50/50 possibility of that happening. In case of counter-cyclicality, Brandt expects BTC to rally to as high as $185,000.
What are the critical support and resistance levels to watch out for in BTC and the major altcoins? Let’s analyze the charts of the top 10 cryptocurrencies to find out.
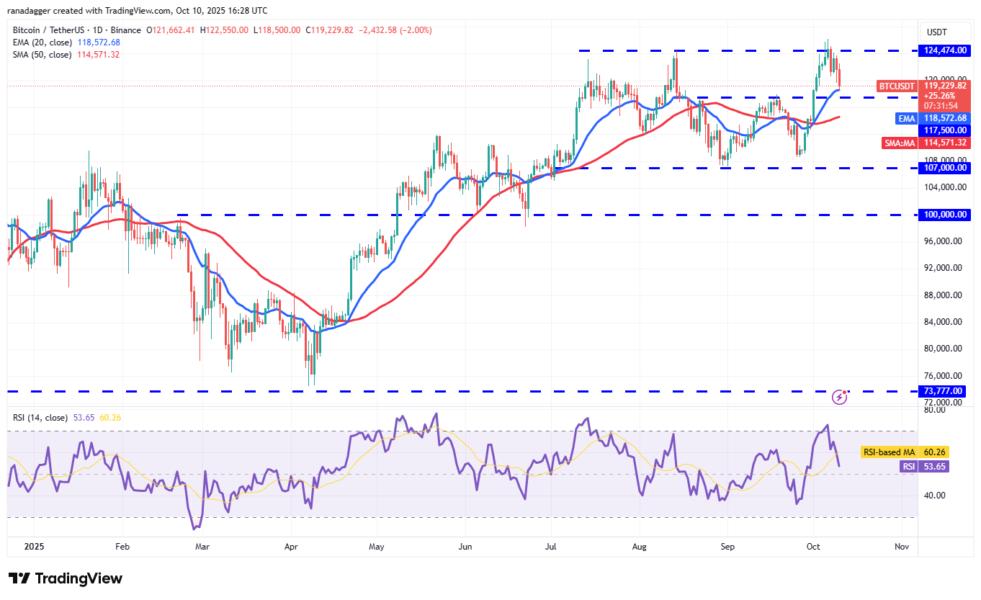
Bitcoin price prediction
BTC has pulled back under the 20-day exponential moving average (EMA) ($118,807), which is a vital near-term support for the bulls to defend.
If the price rebounds off the 20-day EMA with force, the bulls will attempt to push the BTCUSDT pair to the all-time high of $126,199. A break above the resistance could clear the path for a rally toward $141,948.
On the contrary, a close below the 20-day EMA suggests that the bulls are losing their grip. The pair could then slump to the 50-day simple moving average (SMA) ($114,571). That indicates the Bitcoin price could extend its stay inside the $107,000 to $126,199 range for a while longer. Sellers will seize control on a close below $107,000.
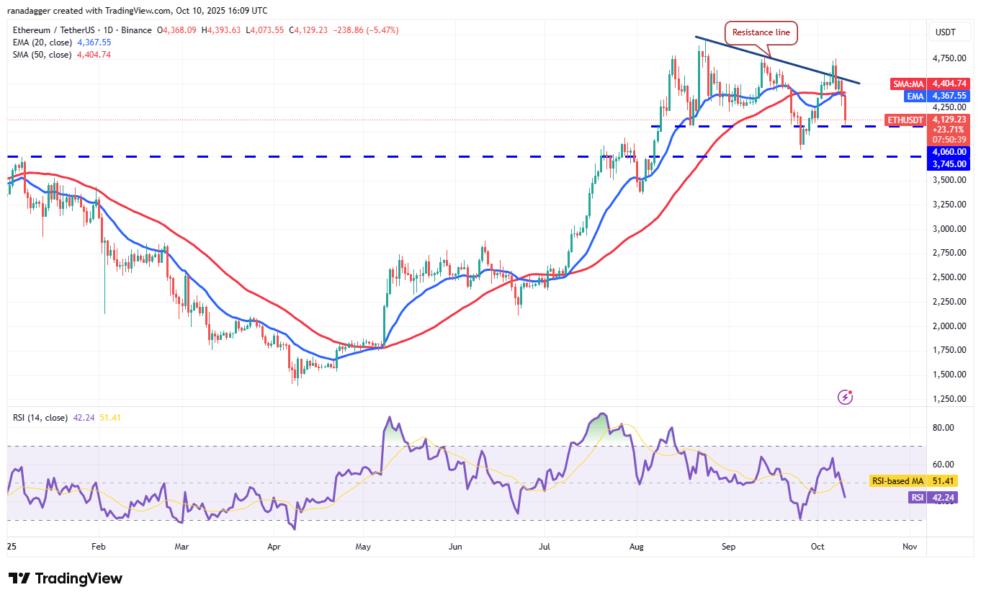
Ether price prediction
The failure of the bulls to push Ether ETHUSD above the resistance line on Wednesday attracted solid selling by the bears.
The Ether price turned down and has reached solid support at $4,060. Buyers are expected to defend the $4,060 to $3,745 support zone with all their might because a drop below it signals a possible short-term top. The ETHUSDT pair could then start a new downtrend toward $3,350.
Buyers will have to push the price above the resistance line to gain strength. The upside momentum is likely to pick up on a close above the $4,750 resistance.
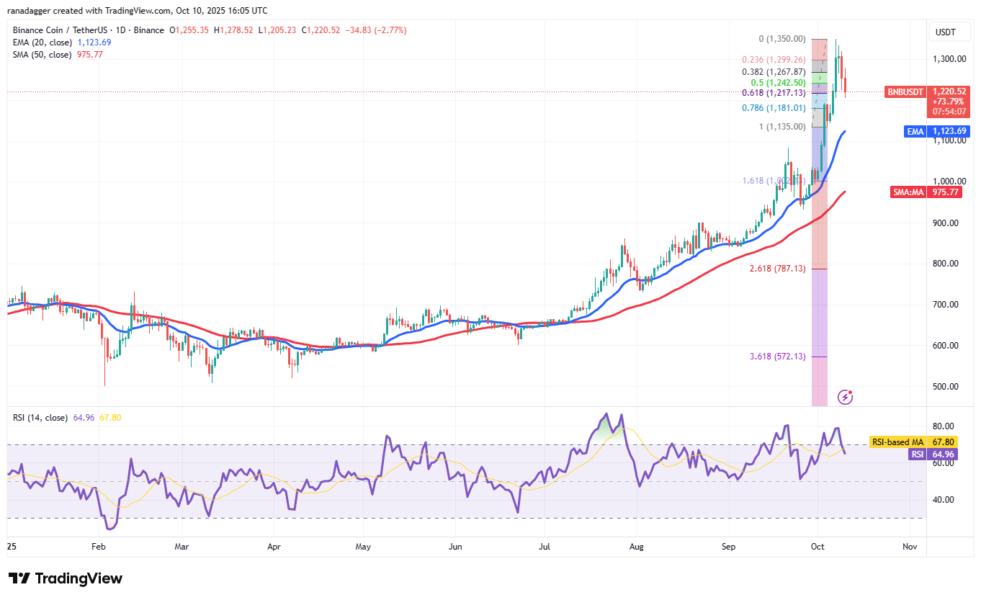
BNB price prediction
BNB BNBUSD has pulled back after a strong rally, but the dip is finding support near the 61.8% Fibonacci retracement level of $1,217.
If the price turns up from the current level, the bulls will attempt to push the price above the overhead resistance of $1,350. If they can pull it off, the BNBUSDT pair could resume the uptrend toward the next target objective of $1,440 and then $1,642.
The bears are likely to have other plans. They will sell the rallies and pull the price below $1,217. If they do that, the BNB price could slip to the 20-day EMA ($1,123), where the bulls are expected to resume their purchases.
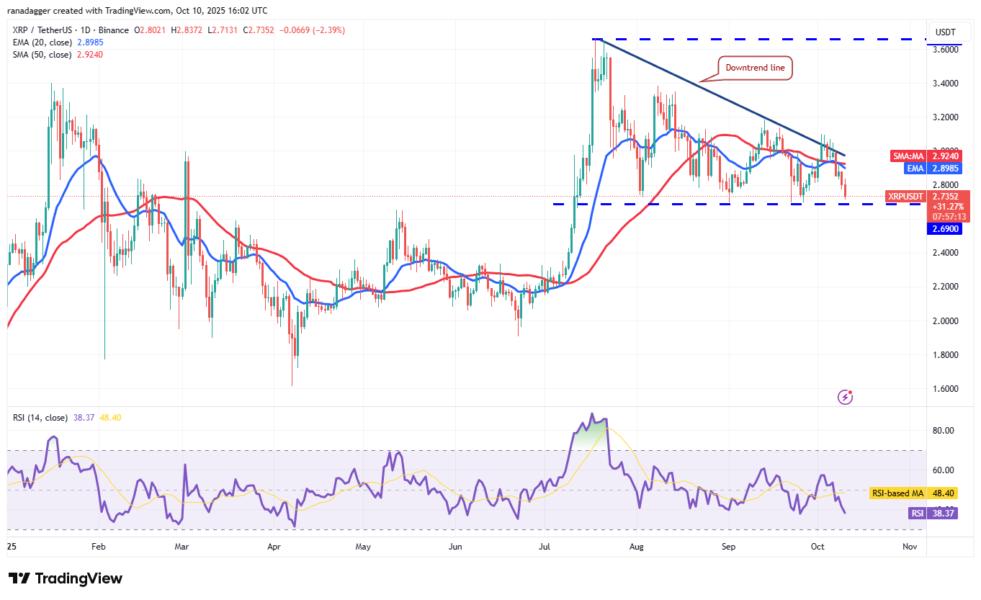
XRP price prediction
XRP XRPUSD has plunged close to the $2.69 support line, which is a critical level for the bulls to defend.
If the price breaks and closes below $2.69, the XRPUSDT pair will complete a descending channel pattern. That could accelerate selling and pull the XRP price to $2.33 and eventually to $2.20.
Buyers will have to push and sustain the price above the downtrend line to prevent the fall. The failure of a bearish pattern is a bullish sign as it traps the aggressive bears, resulting in a short squeeze.
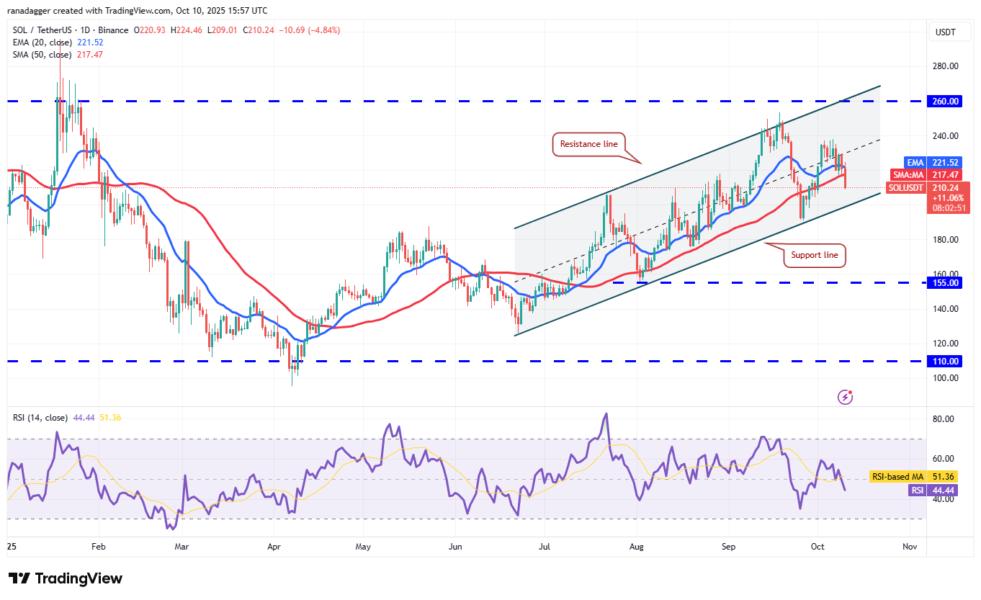
Solana price prediction
Solana SOLUSD bounced off the 50-day SMA ($217) on Wednesday, but the recovery was short-lived as the bears pulled the price below the moving averages on Friday.
The Solana price could drop to the support line, which is a crucial level for the bulls to defend. If the price turns up from the support line and breaks above the moving averages, it signals that the SOLUSDT pair could remain inside the ascending channel pattern for some more time.
Alternatively, a break below the support line suggests that the bulls have given up. That opens the doors for a fall to $175.
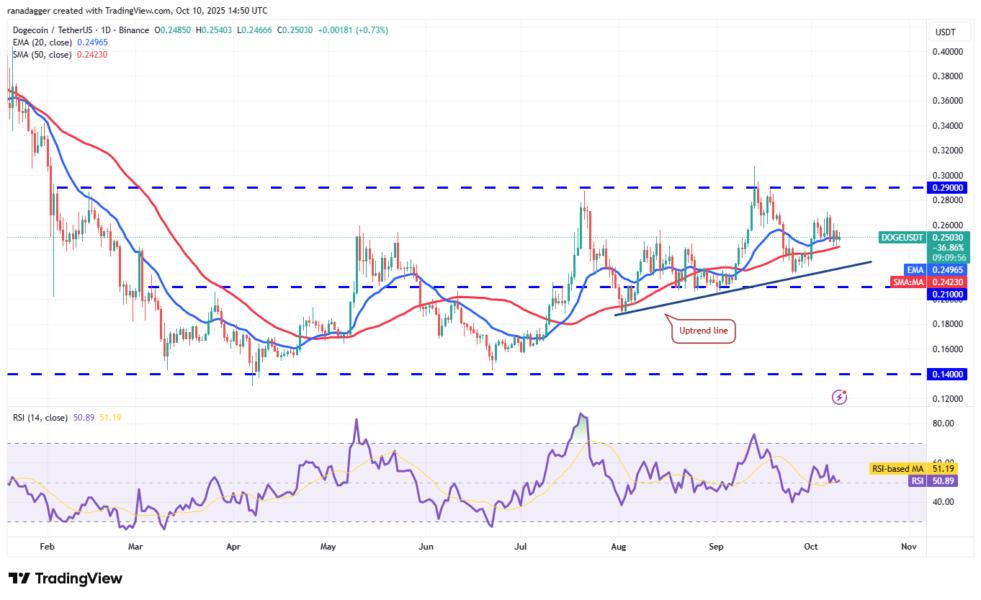
Dogecoin price prediction
Dogecoin DOGEUSD has been taking support at the 50-day SMA ($0.24), but the failure to start a solid bounce signals a lack of demand at higher levels.
The bears will try to sink the price to the uptrend line, which is a crucial support to keep an eye on. If the price rebounds off the uptrend line and breaks above the moving averages, it suggests that the ascending triangle pattern remains intact. The DOGEUSDT pair may then climb to $0.27 and later to $0.29.
Conversely, a break and close below the uptrend line invalidates the bullish setup. That suggests the Dogecoin price may continue to oscillate between $0.14 and $0.29 for a few more days.
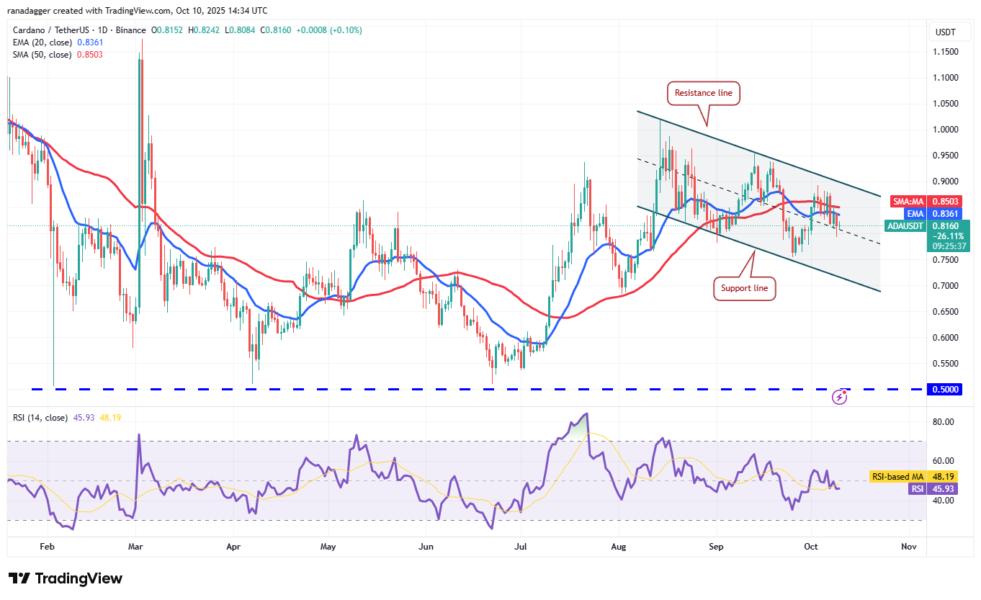
Cardano price prediction
Buyers tried to push Cardano (ADA) above the moving averages on Wednesday, but the bears held their ground.
Sellers will try to pull the price to the support line of the descending channel pattern, where the buyers are expected to step in.
Contrarily, if the Cardano price turns up from the current level and breaks above the moving averages, it signals buying on dips. That enhances the prospects of a rally above the resistance line. If that happens, the ADAUSDT pair could start an upward move to $0.95 and later to $1.02.
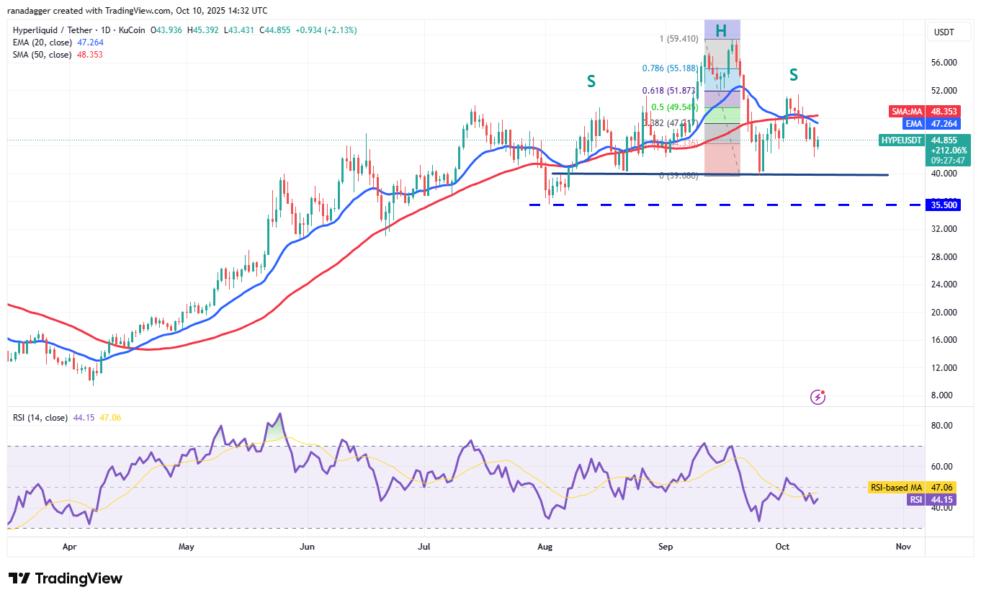
Hyperliquid price prediction
Hyperliquid (HYPE) turned down from the 20-day EMA ($47.26) on Thursday and fell below the $43 support, signaling a negative sentiment.
If the price maintains below $43, the HYPE/USDT pair could drop to the $39.68 level. This is a critical level to watch out for because a close below $39.68 will complete a bearish head-and-shoulders pattern. That may start a downward move to $35.50 and then to $32.
Buyers will have to drive the Hyperliquid price above the moving averages to signal a comeback. The upside momentum could pick up after buyers thrust the price above the $51.87 resistance.
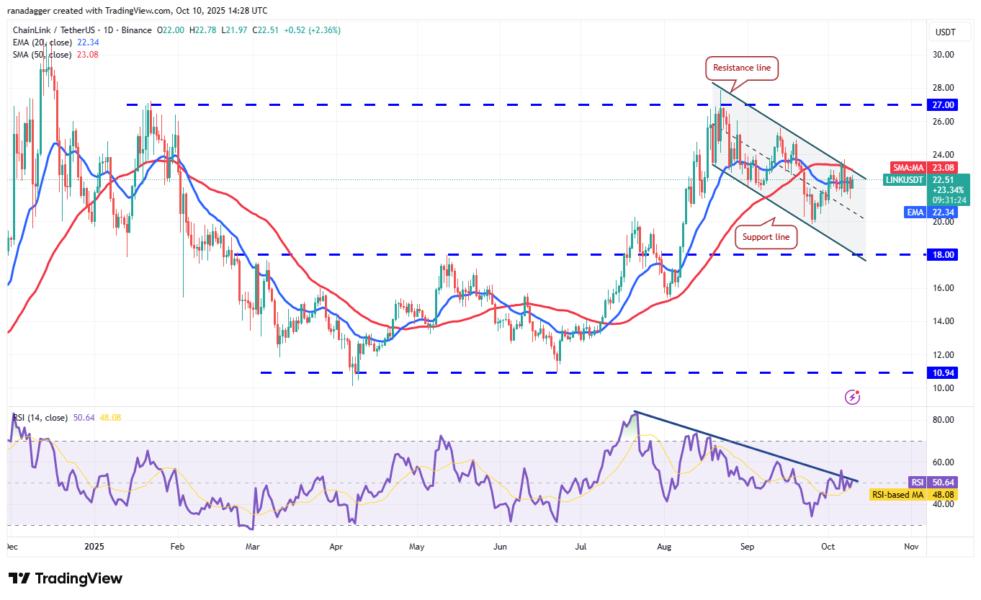
Chainlink price prediction
Chainlink (LINK) is struggling to rise above the resistance line, but a positive sign is that the bulls have not ceded much ground to the bears.
The bulls will again attempt to clear the overhead barrier. If they manage to do that, it signals that the corrective phase may be over. The Chainlink price could rally to $25.64 and subsequently to $27.
This positive view will be invalidated in the near term if the price turns down and breaks below $21. That could keep the LINKUSDT pair inside the descending channel for some more time.
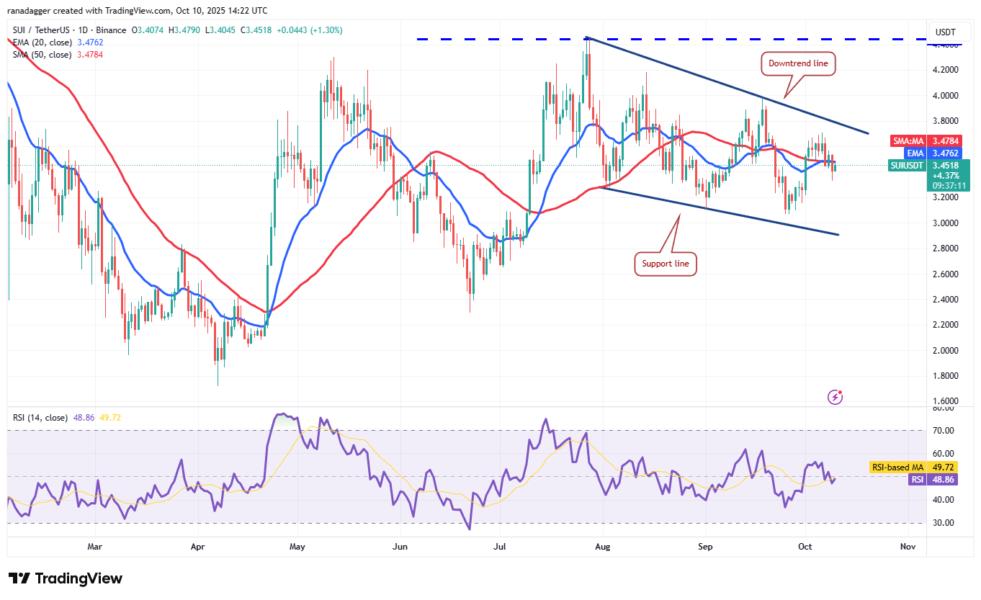
Sui price prediction
Sui (SUI) has been trading inside a falling wedge pattern, which is typically considered a bullish setup if the breakout happens to the upside.
The bulls and the bears are engaged in a tough battle near the moving averages. If buyers push and maintain the price above the moving averages, the SUIUSDT pair could reach the downtrend line. Sellers are expected to aggressively defend the downtrend line because a break above it opens the doors for a rally to $4 and then to $4.44.
On the contrary, if the price turns down and breaks below $3.30, it suggests that the bears are trying to take charge. The Sui price may then slump to the support line.
This article does not contain investment advice or recommendations. Every investment and trading move involves risk, and readers should conduct their own research when making a decision.
The 10-day moving average at $3,926, steadily rising, marks the nearest support. Given its proximity to yesterday’s low of $3,944, gold could test this level with minimal downside. This average has been reliable dynamic support since the uptrend began at the $3,311 swing low in August, anchoring the rally.
If it holds, the short-term bias remains upward. However, a decisive break below $3,926, confirmed by a daily close below, would shift focus to the 20-day moving average at $3,818, a more robust support given its longer scope. This week’s low of $3,884 sits above the 20-day line, so a breach below it would signal increased selling pressure.
Deeper Support and Correction Potential
Should the 20-day average fail, a deeper support zone between $3,707 and $3,619 comes into view, defined by prior consolidation and a measured move matching the prior 10.8% correction. At the lower end, an 18.8% decline—mirroring the last bearish pullback—would align with the 50-day moving average, expected to enter this range soon. This convergence enhances the zone’s significance as a potential floor. A drop to this level would indicate strong supply but remain within the bounds of a healthy correction in the broader uptrend.
Outlook and Key Triggers
Gold’s bullish bias holds as long as the 10-day average at $3,926 supports prices. A weekly close above $4,001 reinforces the uptrend, while a break below $3,884 flags weakness. Traders should watch today’s close for confirmation and monitor $3,818 for signs of deeper selling or a bullish rebound.
For a look at all of today’s economic events, check out our economic calendar.
By Emily Field ( October 10, 2025, 6:59 PM EDT) — The Ninth Circuit has upheld the dismissal of a proposed class action alleging Golo LLC falsely marketed its supplements as weight loss aids, ruling the claims are barred by federal law….
Law360 is on it, so you are, too.
A Law360 subscription puts you at the center of fast-moving legal issues, trends and developments so you can act with speed and confidence. Over 200 articles are published daily across more than 60 topics, industries, practice areas and jurisdictions.
The Bitcoin price has shown remarkable strength at the start of Q4, trading around $121,302 with a market cap of $2.42 trillion. Following a massive $1.2 billion ETF inflow on October 6th, the same day BTC hit a new all-time high (ATH) of $126,296, investor optimism continues to grow. However, people are still curious to know whether it can reach $145K or not.
After Q3’s last month, September was marked by significant ETF outflows, and October’s turnaround has been nothing short of impressive.
All trading sessions so far have recorded positive net inflows, led by a single day largest $1.205 billion surge into spot Bitcoin ETFs. This shift marks a strong transition toward net accumulation, suggesting a broader recovery in investor appetite.
However, this inflow is not evenly distributed. Data indicate that out of eleven, only one dominant ETF provider is currently absorbing much of the market’s selling pressure, and that is BlackRock.
It is effectively stabilizing the Bitcoin price chart and supporting the bullish structure. Such accumulation behavior has preceded major breakouts, and the recent ATH marked on October 6th was proof of that, while other players are playing cautiously, but what if they join BlackRock soon? Then will BTC still remain slow? No, not a chance; it will explode, and many experts are betting on that to happen. Even Michael Saylor’s orange dots rising build enough optimism for the market.
At present, Bitcoin price today is holding steady around $120K, consolidating after its early-October rally. Technical patterns show BTC continuing to trade within an upward channel that has been intact for the past two years.
Historically, each bounce from the channel’s lower border has led to an eventual test of its upper limit. Now, a move like that, if repeated, could push toward the projected BTC price forecast of $145K.
Before reaching that target, however, the market must first conquer the psychological barrier at $130K. Sustained accumulation and strong on-chain trends suggest that a breakout beyond this level could trigger renewed momentum, potentially leading to new record highs before the end of Q4.
Lower Exchange Reserves Signal Long-Term Bullish Outlook
In addition to technical alignment, BTC’s volume profile also supports an optimistic outlook. The FRVP POC-based support that proved critical in Q3 has once again emerged as a key area for Q4. BTC is currently testing this support level, which, if held, could set the stage for the next leg higher toward $145K.
Meanwhile, Bitcoin price USD dynamics are benefiting from continuous declines in exchange reserves. Since Q3, reserves have dropped significantly, signaling that investors are moving coins off exchanges, which is a clear sign of long-term holding intentions.
With fewer coins available for sale, supply scarcity continues which is further strengthening the case for a bullish BTC price prediction narrative.
The current market conditions also suggest that it’s a matter of time before bear pressure fades, then bulls will shine even brighter.
FAQs
How much will 1 Bitcoin cost in 2025?
As per Coinpedia’s BTC price prediction, the Bitcoin price could peak at $168k this year if the bullish sentiment sustains.
How much will 1 Bitcoin be worth in 2030?
With increased adoption, the price of Bitcoin could reach a height of $901,383.47 in 2030.
How much will the price of Bitcoin be in 2040?
As per our latest BTC price analysis, Bitcoin could reach a maximum price of $13,532,059.98
How high will Bitcoin go in 2050?
By 2050, a single BTC price could go as high as $377,949,106.84


:max_bytes(150000):strip_icc()/GettyImages-2210457640-069a226d749e45dfb770a9e1bf2d0931.jpg "10 Natural Supplements That May Help Manage ADHD Symptoms")

 Price Forecast: Bulls Defend Near Record Highs")

