EUR/JPY extends its gains for the third successive day, trading around 179.40 during the Asian hours on Monday. The currency cross is extending a bearish near-term tone as price holds beneath both the nine-period and 50-period Exponential Moving Averages (EMAs).
The short-term EMA remains below the longer 50-period EMA, reinforcing downside pressure, while the 14-day Relative Strength Index (RSI) indicator at 27.71 slips into oversold territory, hinting that while sellers are in control, the pace of the decline could soon moderate.
The EUR/JPY cross may retest the initial support at the eight-month low of 179.37, reached on August 3. Further support lies at the nine-month low of 175.70.
On the upside, the EUR/JPY cross rises toward the nine-day EMA at 184.07, followed by 185.02. A break above these moving averages would cause a bullish shift and support the currency cross to explore the region around the all-time high of 187.95, which was recorded on April 17.
EUR/JPY: Daily Chart
(The technical analysis of this story was written with the help of an AI tool. Know more.)
Euro Price Today
The table below shows the percentage change of Euro (EUR) against listed major currencies today. Euro was the weakest against the Japanese Yen.
USD
EUR
GBP
JPY
CAD
AUD
NZD
CHF
USD
-0.08%
0.06%
-0.63%
0.09%
-0.13%
-0.08%
0.15%
EUR
0.08%
0.13%
-0.61%
0.16%
-0.07%
0.04%
0.18%
GBP
-0.06%
-0.13%
-0.70%
0.00%
-0.20%
-0.09%
0.08%
JPY
0.63%
0.61%
0.70%
0.66%
0.42%
0.54%
0.67%
CAD
-0.09%
-0.16%
-0.00%
-0.66%
-0.23%
-0.12%
0.00%
AUD
0.13%
0.07%
0.20%
-0.42%
0.23%
0.10%
0.29%
NZD
0.08%
-0.04%
0.09%
-0.54%
0.12%
-0.10%
0.19%
CHF
-0.15%
-0.18%
-0.08%
-0.67%
-0.01%
-0.29%
-0.19%
The heat map shows percentage changes of major currencies against each other. The base currency is picked from the left column, while the quote currency is picked from the top row. For example, if you pick the Euro from the left column and move along the horizontal line to the US Dollar, the percentage change displayed in the box will represent EUR (base)/USD (quote).
Register now to be able to add articles to your reading list.
” aria-hidden=”true”>
Quick overview
Gold (XAU/USD) is trading near $4,064 as traders await key U.S. economic data, including the ISM Manufacturing PMI and Non-Farm Payrolls.
The upcoming economic reports are expected to influence Federal Reserve expectations, Treasury yields, and the U.S. dollar, impacting Gold prices.
Despite recent consolidation, the long-term outlook for Gold remains positive, supported by strong central bank buying and limited supply growth.
A break above the resistance level of $4,112 could signal a bullish trend for Gold, with targets set at $4,148 and $4,187.
Gold (XAU/USD) is trading close to $4,064 ahead of the U.S. ISM Manufacturing PMI, the first significant economic data of the week. Focus will also be on the Non-Farm Payrolls on Friday, which are poised to alter the case for the Federal Reserve, the Treasury yields and the U.S. dollar. According to Reuters, the labor-market data are anticipated to be the key data for the week as traders are focusing on the data after central bank communications last week. (Link Reuters article)
The week for Gold starts with prices consolidating as traders are ready for various impactful U.S. economic releases. While central bank purchasing continues to add support in the long-term; for the Gold price, the fixture in the short term is if the data will be supportive or detrimental to the Fed expectations.
Gold’s Critical Week: ISM PMI
The ISM Manufacturing PMI that will be released today is the first major data point of the week with the potential to impact Gold prices. This manufacturing survey will be the first of many, with job openings JOLTS, ADP, ISM Services PMI, initial jobless claims, and the Non-Farm Payrolls on Friday.
A PMI result that shows Gold in a more positive light would be a negative result for PMI, which would signal a negative result for Treasury yields and a stronger dollar. Stronger PMI data would most likely lead to a stronger dollar and lower demand for Gold.
Reuters has reported that the Gold market is reacting to U.S. macro data, especially after the Fed’s decision to keep rates on hold.
Gold Market’s Positive Long-term Outlook Despite Recent Consolidation
As per the Gold Demand Trends Report Q2 2026, published by the World Gold Council, total gold demand was 1,269 tonnes for the quarter. Total first-half demand was 2,522 tonnes, and first-half demand was estimated at a record high of $380 billion.
Buying by the official sector was the strongest market pillar. Central banks bought 289 tonnes, up 62% year on year. Poland bought 51 tonnes, and China purchased 33 tonnes.
As Western ETF flows are sensitive to interest-rate expectations, the World Gold Council also expects that investment demand, especially through the OTC markets and in Asia, will be the more significant demand driver in the second half of 2026.
Supply Growth Remains Limited
Supply conditions in the market continue to be supportive. For the second quarter, mine production rose by just under 2%, reaching 966 tonnes. In contrast, an observed reduction in selling, due to a consolidation in prices, saw a 6% decline in recycling.
Due to the extended development times of new mining projects, the World Gold Council projects only limited supply growth for the rest of the year.
While there are periodic changes in investment demand, supply for gold remains relatively tight and provides structural underpinning for the metal.
Gold Bullish Breakout Target: $4,112
Since the previous report, Gold has established another higher low and has left bullish signs. Gold is still holding above $4,061, the 50-day MA, and buyers are holding above the $4,057 support. The upper boundary of the triangle is $4,112 and sellers are present at this resistance.
GOLD Price Chart – Source: Tradingview
Currently we see a neutral RSI at 51. Typically this indicates price consolidation. A break above $4,112 will bring new targets, as the next resistance would be $4,148, followed by $4,187. If the buyers do not hold the $4,057 support, the $4,022, $4,996 and $4,968 support zones will be the new targets. Resistance levels are currently at $4,112, $4,148, and $4,187; while support is at $4,057, $4,022, $3,996, and $3,968.
Buy Setup
A break and hold above $4,112 will create a buy signal. A target of $4,148 and a second target of $4,187 will be set, while placing a stop loss for this trade below $4,057. The outlook for Gold is cautiously bullish until it breaks below $4,057; however, a break above $4,112 is required to validate this bullish leg.
FAQs
Why is Gold consolidating currently?
Gold is in consolidation until the ISM Manufacturing PMI today and the Non-Farm Payrolls on Friday. These upcoming reports will likely affect the Fed and the US Dollar, all of which affect the price of Gold.
Why are central banks buying more Gold?
As a hedge against inflation, central banks are still diversifying their reserves. The World Gold Council noted 289 tonnes were purchased in Q2 2026. (Attach WGC report here)
What are the most important levels for Gold?
Target resistance is $4,112, $4,148, and $4,187. Supports are $4,057, $4,022, and $3,996.
Arslan Ali Butt
Lead Markets Analyst – Multi-Asset (FX, Commodities, Crypto)
Arslan Ali Butt serves as the Lead Commodities and Indices Analyst, bringing a wealth of expertise to the field. With an MBA in Behavioral Finance and active progress towards a Ph.D., Arslan possesses a deep understanding of market dynamics.
His professional journey includes a significant role as a senior analyst at a leading brokerage firm, complementing his extensive experience as a market analyst and day trader. Adept in educating others, Arslan has a commendable track record as an instructor and public speaker.
His incisive analyses, particularly within the realms of cryptocurrency and forex markets, are showcased across esteemed financial publications such as ForexCrunch, InsideBitcoins, and EconomyWatch, solidifying his reputation in the financial community.
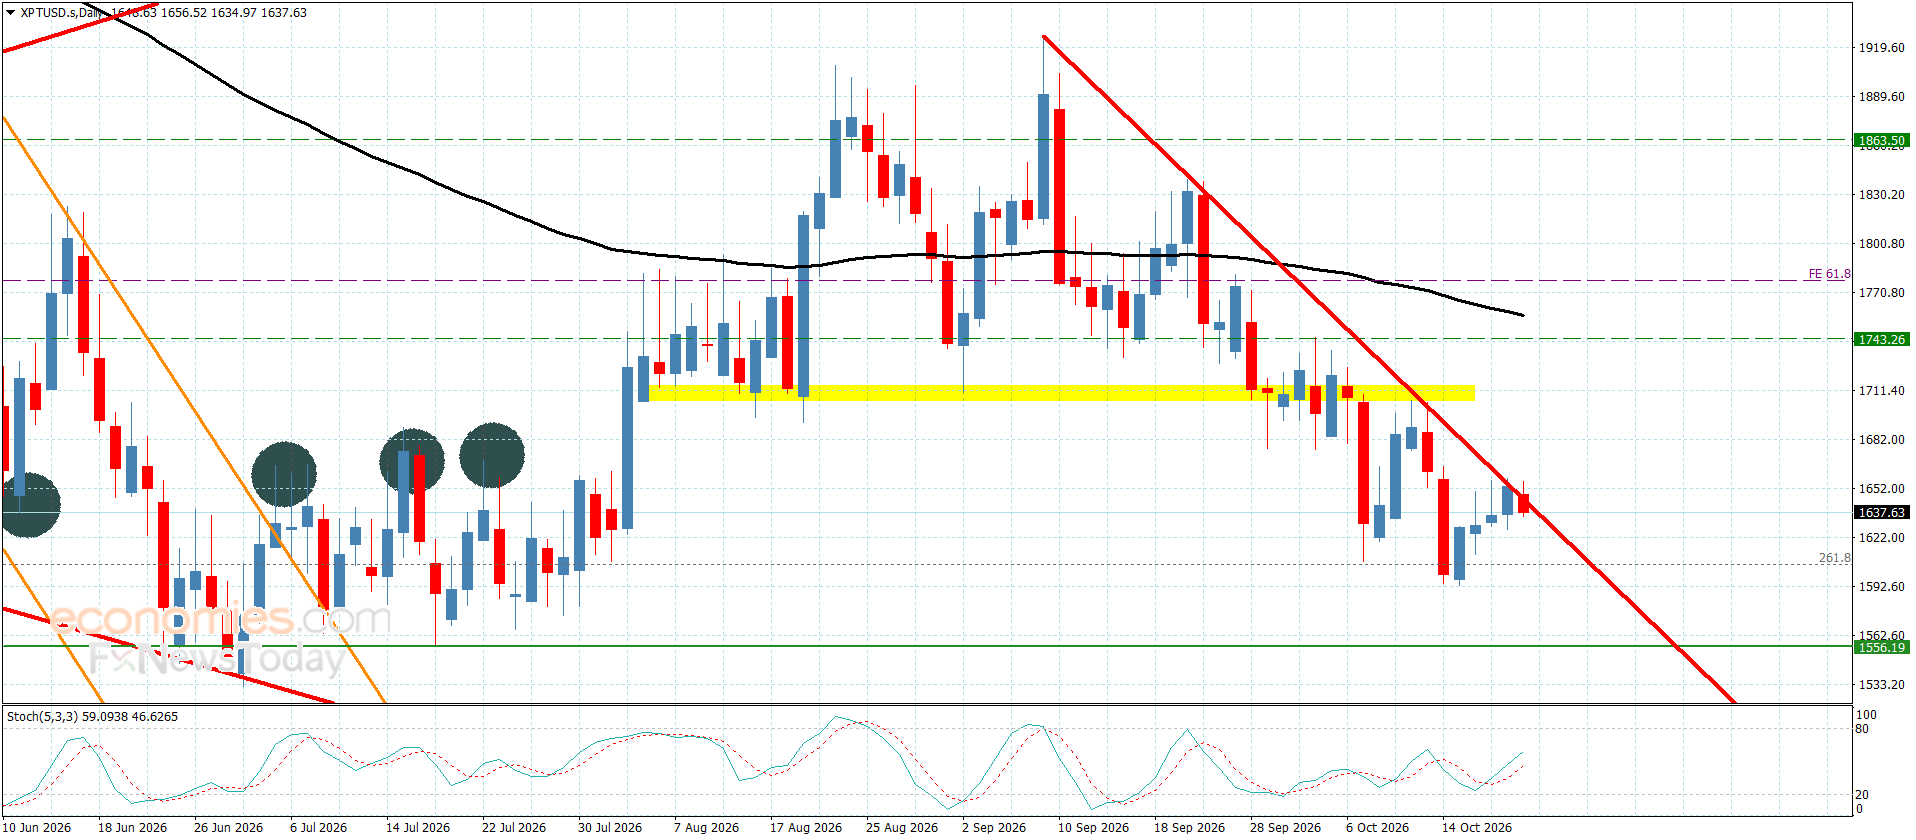
Platinum price formed a bullish wave during yesterday’s trading, targeting the $1,670.00 level, while maintaining its negative stability below the additional resistance barrier at $1,690.00. This confirms the price’s adherence to the bearish corrective scenario. Therefore, we emphasize the importance of gathering negative momentum during the current trading sessions, which would facilitate the move toward the initial corrective targets at $1,550.00 and $1,515.00, respectively.
However, if the price comes under renewed positive pressure and breaks above the $1,690.00 level, it would force the bearish attack to be postponed, giving the price an opportunity to achieve further intraday gains by moving toward $1,730.00, followed by the key resistance barrier near $1,790.00.
The expected trading range for today is between $1550.00 and $1680.00
ING expects EUR/USD to remain supported around 1.1500 following the sharp Dollar selloff, although a sustained move above 1.1600 would require a further dovish repricing of US interest rates.
The Euro to US Dollar exchange rate (EUR/USD) gained just over 1% in July, recovering from a monthly low near 1.1354 and reaching a high around 1.1547.
EUR/USD pair remains 1.7% lower for 2026, having fallen from January’s peak at 1.2075 to a year-to-date low of 1.1325 in June.
Image: EUR/USD exchange rate performance over 48h chart
The latest 48-hour chart above shows the pair rising from below 1.1440 to above 1.1530, leaving it close to the upper end of its recent range. The daily chart also shows EUR/USD moving back above its 20-day moving average, although it remains close to the declining 50-day average.
ING believes the sharp change in Dollar momentum leaves the Euro better supported in the near term.
The Greenback came under pressure after the Federal Reserve delivered a more dovish message than markets had expected. Investors were left questioning whether policymakers would follow through on their inflation-fighting rhetoric with actual rate increases.
ING estimates that speculative long-Dollar exposure against other major currencies was at its most stretched since January 2025, while leveraged funds held their largest EUR/USD short positions since 2021.
According to the bank, “there may still be room for further USD long-squeezing”, making it too early to call a firm bottom in the Dollar selloff.
Analysts at ING note EUR/USD broke through 1.1500 “with little resistance” and expects the level to attract buyers for a while longer.
The bank sees near-term risks tilted towards further Euro gains, although it is cautious about chasing a sustained move above 1.1600.
Such a break would probably require another material repricing lower in US rates, together with an easing in Middle East tensions.
Image: EUR/USD Year-to-Date historical chart
For now, ING expects buyers to continue emerging around 1.1500, with 1.1600 marking the more difficult test for the recovery.
Exchange Rates UK Research
Our currency coverage draws on live market data, official economic releases and published bank research.
Exchange Rates UK Research’s latest August 2026 survey of major investment banks suggests the Pound to Euro exchange rate is trading above where most institutions believe it will settle over the medium term.
With GBP/EUR currently at 1.1694, close to its highest level in more than a year, the majority of banks expect the exchange rate to drift back towards 1.14-1.16 through 2027.
Only a handful of institutions forecast sterling strengthening beyond 1.19.
View full sizeImage: GBP/EUR exchange rate forecasts chart – survey results August 2026
Latest Survey Suggests Sterling’s Outperformance May Moderate
The latest Exchange Rates UK Research poll reveals a more balanced outlook than recent price action would suggest.
Bullish forecasts from Bank of America, UBS and Credit Agricole see GBP/EUR holding between 1.18 and 1.20, implying Pound Sterling can maintain most of its recent gains.
However, the majority of banks – including Citi, CIBC, Goldman Sachs, HSBC, ING, MUFG, Natixis, Nomura, Rabobank, SEB and Scotiabank – expect the pair to ease back into the 1.12-1.16 region over the next 12 to 24 months.
Overall, the survey average points to modest Pound Sterling weakness from current levels rather than another sustained leg higher.
That outlook follows a strong rally.
Image: GBP to EUR exchange rate performance over last six months
GBP/EUR has climbed steadily over the past four months, rising from around 1.14 in March to almost 1.17, with July marking a third consecutive monthly gain.
The pair is now trading at its strongest levels since mid-2025 after advancing around 2.5% over the period.
Image: GBP/EUR 5-year chart
BoE Advantage Narrowing as ECB Turns More Hawkish
A recurring theme across the latest forecasts is that the interest-rate advantage which has underpinned sterling may begin to narrow.
The Bank of England kept Bank Rate unchanged at 3.75% this week, but the decision was accompanied by a three-way split on the Monetary Policy Committee and fresh warnings that energy-driven inflation risks remain elevated.
Meanwhile, the European Central Bank has also paused, but policymakers continue to signal that another interest-rate increase remains possible if higher energy prices feed through into broader inflation pressures.
Eurozone inflation unexpectedly accelerated to 2.9% in July, reinforcing expectations that the ECB could tighten policy again later this year.
This has reduced expectations that UK interest rates will remain significantly above those in the Eurozone for an extended period.
GBP/EUR Outlook: Consensus Favours Gradual Retreat Rather Than Sharp Reversal
The latest Exchange Rates UK Research survey suggests the pound remains fundamentally well supported, but that much of the recent good news may already be reflected in current exchange rates.
Rather than forecasting a sharp reversal, most banks expect GBP/EUR to gradually move back towards the mid-1.10s as monetary policy differences become less pronounced and Eurozone fundamentals improve.
For businesses and holidaymakers buying euros, today’s exchange rate remains close to the strongest seen for more than a year.
Sending money abroad?
Compare specialist TorFX exchange rates for larger international transfers.
If the latest survey proves accurate, these levels could represent some of the most favourable buying opportunities before GBP/EUR settles back towards longer-term equilibrium.
However, if the pair continues to drop below the 157 level, it will open the door for a continued decline toward the 152 area. This level is marked by the red dotted support line.
But the RSI indicator shows an extremely oversold condition in the short term and indicates a rebound before the next drop. A recovery above 161.50 will suggest that the bottom has formed. This bottom may allow the pair to continue upside.
In Closing
The BOJ has opened the door to another interest rate hike. Rising producer prices, strong wage growth and higher inflation expectations support the tighter policy. The weak yen also increases imported inflation. In my view, the BOJ may raise the policy rate to 1.25% in September or October. It could delay the move if inflation eases or the yen continues to recover.
The higher Japanese interest rates could place further pressure on USDJPY. A continued decline below 157 may push the pair toward the 150-152 area. But the oversold conditions could trigger the short term rebound first. A recovery above 161.50 would indicate that the bottom is confirmed and the pair is ready to move higher again.
In the past week, world gasoline and oil prices turned down. WTI crude oil from 85.15 USD/barrel at the end of last week fell to 84.67 USD/barrel at the end of this week. Overall last week, WTI oil prices decreased by 0.48 USD/barrel, equivalent to a decrease of 0.56% compared to the end of last week.
Brent oil fell from 96.78 USD/barrel at the end of last week to 90.12 USD/barrel at the end of this week. Over the past week, Brent oil prices fell 6.66 USD/barrel, equivalent to a decrease of about 6.88% compared to the end of last week.
World oil prices this week fluctuated sharply amid new developments related to tensions in the Middle East. In the first sessions of the week, oil prices fell sharply to their lowest level in more than a week after the US temporarily suspended airstrikes against Iran, raising expectations for a diplomatic solution that could help resume oil transportation across the Strait of Hormuz soon.
However, the decline is not long-lasting as risks to supply are still present. The flow of ships through the Strait of Hormuz continues to be low, while Houthi attacks in the Red Sea still disrupt maritime operations.
In addition, the risk of unsafety in the Bab el-Mandeb Strait – a strategic transport route connecting the Red Sea with the Gulf of Aden – continues to increase, threatening Saudi Arabia’s oil exports and international trade flows.
Oil prices also received support from information that OPEC+ is likely to temporarily suspend its production increase plan for three months, starting from October 2026, after completing the roadmap to restore previously voluntarily cut production.
Domestic gasoline prices today
On August 2nd, retail gasoline and oil prices according to the price list announced by Petrolimex in region 1 and region 2 are as follows:
Domestic retail gasoline and oil prices on August 2, 2026, according to the price list announced by Petrolimex.
The above domestic retail gasoline and oil prices are adjusted by Petrolimex according to the inter-ministry of Industry and Trade – Finance’s management period from 3:00 PM on July 30th.
Gasoline and oil discount today
– Tu Luc Petroleum Joint Stock Company 1:
+ Diesel oil 0.05S – II: 50 VND/liter;
+ E10 RON 95-III gasoline: 200 VND/liter
– MIPEC Petroleum Trading and Trading Co., Ltd. – MIPEC Petro (applied to the Northern region):
+ E10 gasoline: 100 VND/liter.
+ Diesel oil 0.05S-II: 100 VND/liter.
Domestic gasoline and oil price forecast for the next period
According to a representative of a gasoline and oil business, it is predicted that in the next price adjustment period, retail gasoline and oil prices may increase slightly.
In which:
– E10 gasoline increases by about 0-50 VND/liter
– E5 RON 92 – II gasoline increased by about 100 VND/liter;
– Diesel oil increased by about 300 VND/liter.
Today’s gasoline and oil prices are for reference only and may change according to market developments.
Refer to more articles about gasoline and oil prices HERE.
Coffee prices today in the domestic market continue to linger around the 97,000 VND/kg range. According to the latest updated table of giacaphe. com, the average coffee price is at 96,800 VND/kg, an increase of 200 VND/kg compared to the previous session; the highest level in key regions of the Central Highlands is 97,000 VND/kg.
In Lam Dong, coffee prices were recorded at 96,200 VND/kg, an increase of 200 VND/kg compared to the previous session. This is the lowest level among regions with detailed price lists.
In Gia Lai, coffee prices reached 96,700 VND/kg, an increase of 200 VND/kg.
The old Dak Nong area recorded a level of 97,000 VND/kg, an increase of 200 VND/kg. This is the region with the highest price in the survey table.
In Dak Lak, coffee prices are recorded by many market summary tables at around 96,700 VND/kg, in the high price group in the Central Highlands. In general, domestic coffee prices are fluctuating in the range of 96,200-97,000 VND/kg.
World coffee prices
In the world market, coffee prices increased in the last session of the week, but the increase was more concentrated in Arabica.
According to Barchart, the September 2026 Arabica futures contract closed up 9.05 US cents/lb, equivalent to 2.80%. Arabica prices were supported by the diễn biến of standard inventory on ICE falling to a low of about 2.5 years.
Meanwhile, Robusta London futures for September 2026 only increased by 2 USD/ton, equivalent to 0.05%, to 3,782 USD/ton. The very narrow increase range shows that the pulling force from Robusta is not strong.
Coffee price assessment
Domestic coffee prices are holding around 97,000 VND/kg after a slight recovery. The increase of 200 VND/kg in the latest updated table helps prices increase slightly compared to the previous session, but has not brought the level back to the area close to 99,000 VND/kg like the period at the end of July.
In the world, Arabica increased more strongly than Robusta. Arabica inventory certified on ICE has continuously decreased for about 4.5 months and down to a 2.5-year low. This is a factor that supports Arabica more clearly in the last session of the week.
For the Vietnamese market, Robusta is still a variable that needs to be closely monitored. When London Robusta only increases very slightly, domestic prices may continue to remain high but are difficult to rebound strongly if there is no additional buying force from export businesses or new fluctuations from the London exchange.
Regarding the weather, according to the National Center for Hydro-Meteorological Forecasting, on the day and night of August 2nd, the Central Highlands area will have showers and thunderstorms in some places; especially in the late afternoon and evening, there will be scattered showers and thunderstorms in some places. The lowest temperature is 20-23 degrees Celsius, the highest is 28-31 degrees Celsius. In thunderstorms, there is a possibility of tornadoes, lightning and strong gusts of wind.
This season’s thunderstorms need to be monitored in terms of garden care, pest and disease prevention, and goods preservation.
In the coming sessions, the diễn biến of Robusta London, Arabica New York, the USD/VND exchange rate and the demand for export purchases will continue to dominate domestic coffee prices.
Fuel prices today, July 31st: World oil prices fall, domestic gasoline prices rise.
Today, July 31, 2026, fuel prices show both WTI and Brent crude oil prices decreasing; domestically, diesel prices in Region 2 continue to remain above 30,000 VND/liter.
Illustration.
World oil prices rose again today, August 1, 2026.
The global crude oil market saw an upward trend on August 1, 2026, with WTI oil rising more sharply than Brent oil.
WTI crude oil prices were updated to $86.80 per barrel. Compared to $84.03 per barrel on July 31st, this type of oil increased by $2.77 per barrel, equivalent to approximately 3.30%.
During the day, WTI oil fluctuated between $81.21 and $86.87 per barrel. The current price is only $0.07 per barrel lower than the day’s high, indicating a fairly clear recovery at the time of this update.
Brent crude oil reached $87.93 per barrel, up $0.92 per barrel from $87.01 per barrel on July 31. This represents an increase of approximately 1.06%.
Brent crude oil traded within a fairly wide range, from $84.62 to $91.36 per barrel. The current price is significantly lower than the day’s high but still higher than the previous day’s level.
Comparison table of world oil prices from July 31 to August 1, 2026
Type of oil
July 31st
August 1st
Change
Proportion
WTI oil
$84.03 per barrel
$86.80 per barrel
An increase of $2.77
An increase of 3.30%
Brent crude oil
$87.01 per barrel
$87.93 per barrel
An increase of $0.92
An increase of 1.06%
Oil price range on August 1, 2026
Type of oil
Lowest
Highest
Amplitude difference
WTI oil
$81.21 per barrel
$86.87 per barrel
$5.66
Brent crude oil
$84.62 per barrel
$91.36 per barrel
$6.74
The gap between Brent and WTI crude oil prices at the time of this update has narrowed to just $1.13 per barrel, a significant reduction from the $2.98 per barrel mark on July 31st. This reflects the fact that WTI crude oil is rising faster than Brent crude oil.
Despite the upward trend, the wide trading range indicates that the crude oil market remains highly volatile. The price on August 1st is data at the time of update and is not necessarily the official closing price of the session.
Note the increase in WTI oil prices.
The source data table shows WTI oil prices rising by $3.21, or 3.84%. However, compared directly to the $84.03/barrel price on July 31st used in the previous report, the day-to-day increase is $2.77, or 3.30%.
The discrepancies may arise from the data platform using a different reference price, closing date, or contract term. This article uses a direct comparison between the prices on July 31st and August 1st to ensure consistency.
Domestic fuel prices today, August 1, 2026
In the domestic market, retail gasoline and diesel prices at Petrolimex’s system on August 1st remained unchanged according to the price list effective from 3 PM on July 30th, 2026.
Petrolimex confirms that the prices announced on July 30th will be applied from 3 PM on the same day until the next price adjustment period, at the company’s distribution system nationwide.
Among gasoline products, E5 RON 92-II has the lowest price, at 22,380 VND/liter in Zone 1 and 22,820 VND/liter in Zone 2.
E10 RON 95-III gasoline is sold at 22,850 VND/liter in Zone 1 and 23,300 VND/liter in Zone 2. E10 RON 95-V gasoline has the highest price in the group, ranging from 24,250–24,730 VND/liter.
For the oil group, DO 0.001SV diesel has the highest price in the table. This product is sold at 29,720 VND/liter in Region 1 and 30,310 VND/liter in Region 2.
Diesel fuel DO 0.05S-II is priced at 27,620–28,170 VND/liter, while kerosene 2-K is listed at 27,400–27,940 VND/liter.
Prices in Zone 2 are 440–590 VND/liter higher than in Zone 1. Petrolimex applies the Zone 2 price framework in areas far from ports, main depots, or petroleum production facilities; the actual selling price must not exceed the announced Zone 2 price.
Domestic prices are currently high following the increase on July 30th.
Compared to the price adjustment on July 23rd, the prices of all types of gasoline at Petrolimex have increased by 1,420–1,530 VND/liter.
The two types of diesel fuel saw sharper increases, rising by 1,860 VND/liter in Zone 1 and 1,900 VND/liter in Zone 2. Kerosene increased by 750–760 VND/liter.
The increase compared to the period of July 23rd.
Product
Increase in Zone 1
Increase in Region 2
E10 RON 95-V gasoline
1,420 VND/liter
1,450 VND/liter
E10 RON 95-III gasoline
1,420 VND/liter
1,450 VND/liter
E5 RON 92-II gasoline
1,500 VND/liter
1,530 VND/liter
DO 0.001SV
1,860 VND/liter
1,900 VND/liter
DO 0.05S-II
1,860 VND/liter
1,900 VND/liter
2-K kerosene
750 VND/liter
760 VND/liter
Notably, DO 0.001SV diesel fuel in Region 2 currently exceeds 30,000 VND/liter. This is also the product with the highest selling price and absolute increase in Petrolimex’s price list.
Forecast for the next fuel price adjustment period.
According to the usual price adjustment schedule, fuel prices are announced every Thursday. Following the July 30th adjustment, the next one is expected to take place on Thursday, August 6th, 2026.
If the same timeframe as the most recent period continues to apply, the new price could take effect from 3 PM on August 6th. The official timing and amount of the adjustment still need to be announced by the regulatory authority and the leading businesses.
The more than 3% increase in WTI oil and the continued rise in Brent oil on the first day of August could put further pressure on domestic gasoline prices if this trend continues.
However, it is not possible to conclude from a single day’s developments that retail prices will continue to rise in the next period. The base price is calculated based on the average price of petroleum products in the world market between two price adjustment periods, along with exchange rates, taxes, fees, and other constituent costs.
WTI and Brent crude oil prices primarily serve as trend indicators. Domestic prices for E5 RON 92 and E10 RON 95 gasoline, diesel fuel, and kerosene also depend on the specific developments of each refined product in the international market.
Notable scenarios ahead of August 6th
If global oil and refined product prices continue to rise in the coming sessions, domestic retail prices could face further upward pressure.
Conversely, if the current upward trend is short-lived and international prices quickly cool down, the adjustment may be narrowed or some items may remain unchanged.
Following the sharp increase on July 30th, the likelihood of a correction in the next cycle needs to be assessed across the entire cycle, rather than based on a single oil price at a single point in time.
2026.07.31 2026.07.31 Short-Term Analysis for Oil, Gold, and EURUSD for 31.07.2026
Alex Rodionovhttps://www.litefinance.org/blog/authors/alex-rodionov/
Welcome, my fellow traders! I have prepared a price forecast for the USCrude, XAUUSD, and EURUSD using a combination of the margin zones method and technical analysis. Based on the market analysis, I suggest entry signals for intraday traders.
Yesterday, the euro reversed upward in the short term.
The article covers the following subjects:
Major Takeaways
USCrude: oil has reached the first bearish target of 80.34.
XAUUSD: Gold continues to trade under bearish pressure.
EURUSD: The euro’s short-term downtrend has reversed.
Oil Price Forecast for Today: USCrude Analysis
Yesterday, the oil price failed to break through the key resistance zone of 83.57–82.99. As a result, the asset began to decline today, reaching the first bearish target of 80.34. If the price settles below this level, it may fall further to 77.14.
If oil starts to rise and pierces the resistance B of 83.57–82.99, the short-term trend will turn upward. In that case, one may consider long trades on the next trading day.
USCrude Trading Ideas for Today:
Hold part of short trades opened at resistance B of 83.57–82.99. TakeProfit: 77.14. StopLoss: at breakeven.
Gold Forecast for Today: XAUUSD Analysis
Yesterday, the gold price once again attempted to break above the resistance B of 4,128–4,113 but failed to do so. Therefore, the short-term trend remains bearish. The main bearish target is the July low of 3,959.
If the metal breaks above the resistance B today, the short-term trend will turn bullish. In that case, consider long trades on the next trading day, with a target in the upper Target Zone of 4,298–4,267.
XAUUSD Trading Ideas for Today:
Sell near resistance B of 4,128–4,113. TakeProfit: 4,044, 3,959. StopLoss: 4,157.
Euro/Dollar Forecast for Today: EURUSD Analysis
Yesterday, the euro reversed upward in the short term and breached the key resistance of 1.1482–1.1468. The bullish target is now the upper Target Zone of 1.1601–1.1576. Consider long trades during a correction.
If a correction develops, the EURUSD pair may decline to support A of 1.1453–1.1444. Once this zone is tested, consider long trades, with the first target at 1.1491 and the second one around 1.1537.
Should the euro exceed yesterday’s high, the support zones will need to be adjusted.
EURUSD Trading Ideas for Today:
Buy near support A of 1.1453–1.1444. TakeProfit: 1.1491, 1.1537. StopLoss: 1.1423.
Would you like to learn more about technical analysis methods and principles? Explore our comprehensive guide.
P.S. Did you like my article? Share it in social networks: it will be the best “thank you” 🙂
Useful links:
I recommend trying to trade with a reliable broker here. The system allows you to trade by yourself or copy successful traders from all across the globe.
Use my promo code BLOG to get a 50% deposit bonus on the LiteFinance platform. Simply enter this code in the appropriate field when funding your trading account.
Telegram channel with high-quality analytics, Forex reviews, training articles, and other useful things for traders https://t.me/litefinance
Price chart of EURUSD in real time mode
The content of this article reflects the author’s opinion and does not necessarily reflect the official position of LiteFinance broker. The material published on this page is provided for informational purposes only and should not be considered as the provision of investment advice for the purposes of Directive 2014/65/EU.
According to copyright law, this article is considered intellectual property, which includes a prohibition on copying and distributing it without consent.