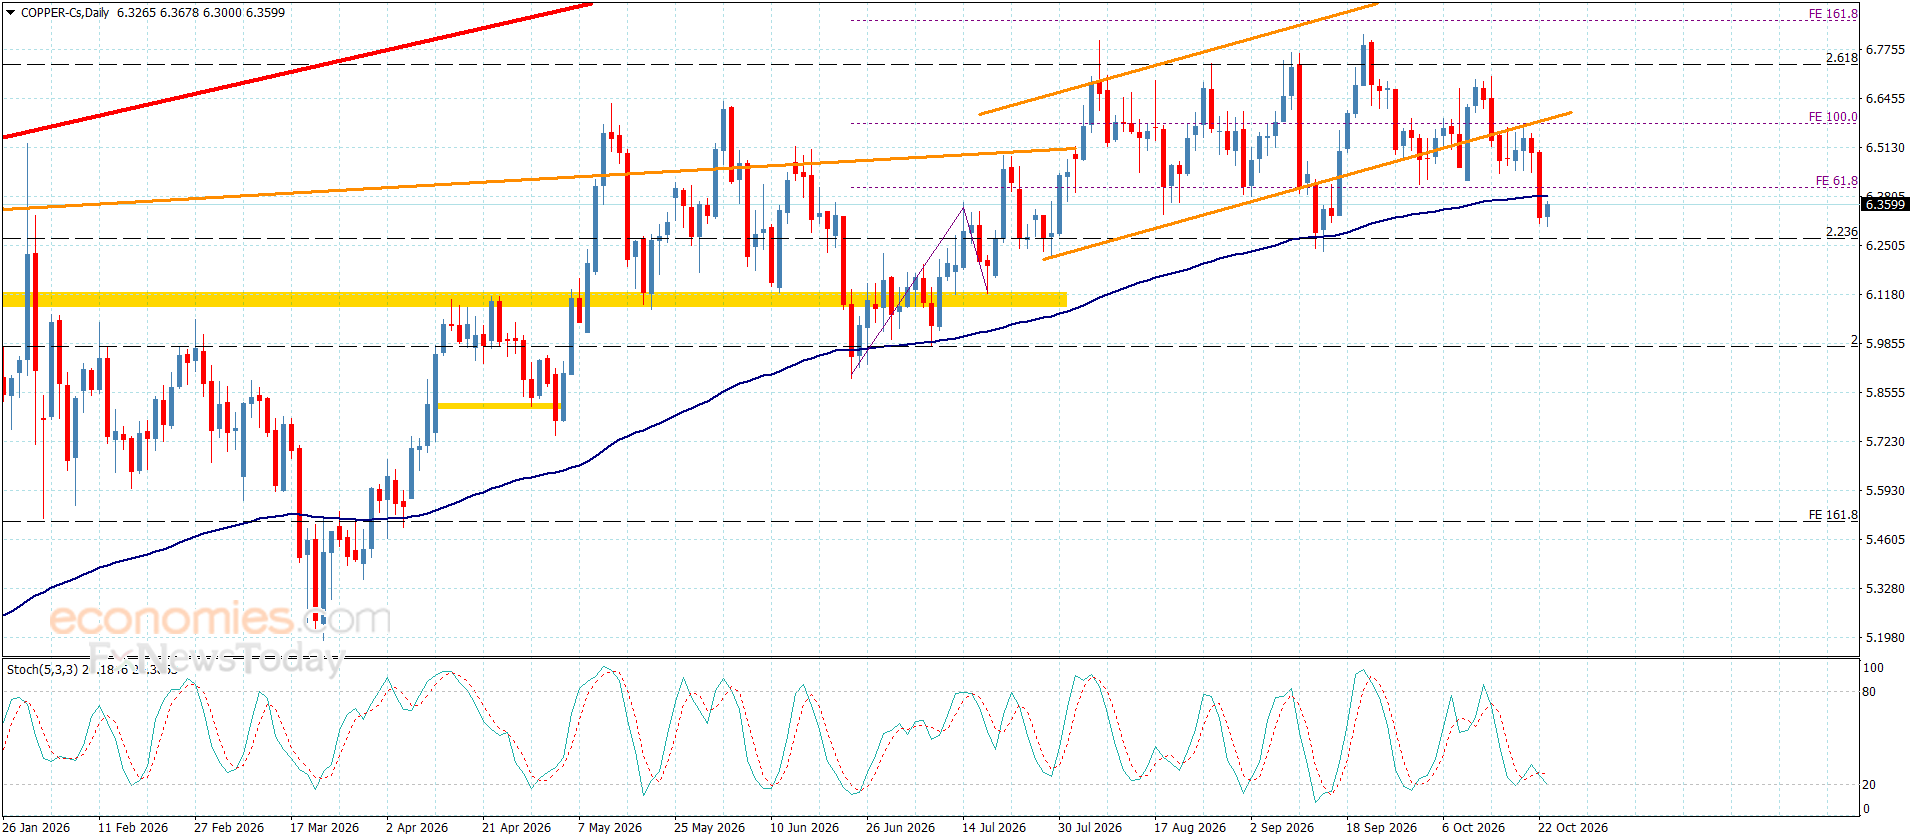
Copper price ended yesterday’s trading by forming bullish waves, to settle near the initial barrier at $6.3000 level, affected by the positivity of the main indicators, specifically by stochastic reach to 80 level as appears in the above image.
The suggested scenario depends on the upcoming four hours’ close, the stability below the barrier will reinforce the chances of forming bearish corrective trading, to target $6.1200 reaching $5.9500, while breaching the barrier and holding above it will provide a chance for recording some extra gains by its rally towards $6.4800.
The expected trading range for today is between $6.1200 and $6.3800
Copper price ended yesterday’s trading by forming bullish waves, to settle near the initial barrier at $6.3000 level, affected by the positivity of the main indicators, specifically by stochastic reach to 80 level as appears in the above image.
The suggested scenario depends on the upcoming four hours’ close, the stability below the barrier will reinforce the chances of forming bearish corrective trading, to target $6.1200 reaching $5.9500, while breaching the barrier and holding above it will provide a chance for recording some extra gains by its rally towards $6.4800.
The expected trading range for today is between $6.1200 and $6.3800
Copper price ended yesterday’s trading by forming bullish waves, to settle near the initial barrier at $6.3000 level, affected by the positivity of the main indicators, specifically by stochastic reach to 80 level as appears in the above image.
The suggested scenario depends on the upcoming four hours’ close, the stability below the barrier will reinforce the chances of forming bearish corrective trading, to target $6.1200 reaching $5.9500, while breaching the barrier and holding above it will provide a chance for recording some extra gains by its rally towards $6.4800.
The expected trading range for today is between $6.1200 and $6.3800
GBP/USD gained ground, supported by U.S. CPI report. Traders bet that Fed will be less hawkish as inflation has started to calm down. Traders also focus on comments from Fed Chair Warsh. He said that CPI decline did not mean that Fed accomplished its mission.
In case GBP/USD pulls back below the 50 MA at 1.3376, it will head towards the nearest support level at 1.3335 – 1.3350. A successful test of of this level will open the way to the test of the next support at 1.3250 – 1.3265.
On the upside, GBP/USD needs to settle above the resistance at 1.3450 – 1.3465 to have a chance to gain additional upside momentum in the near term.
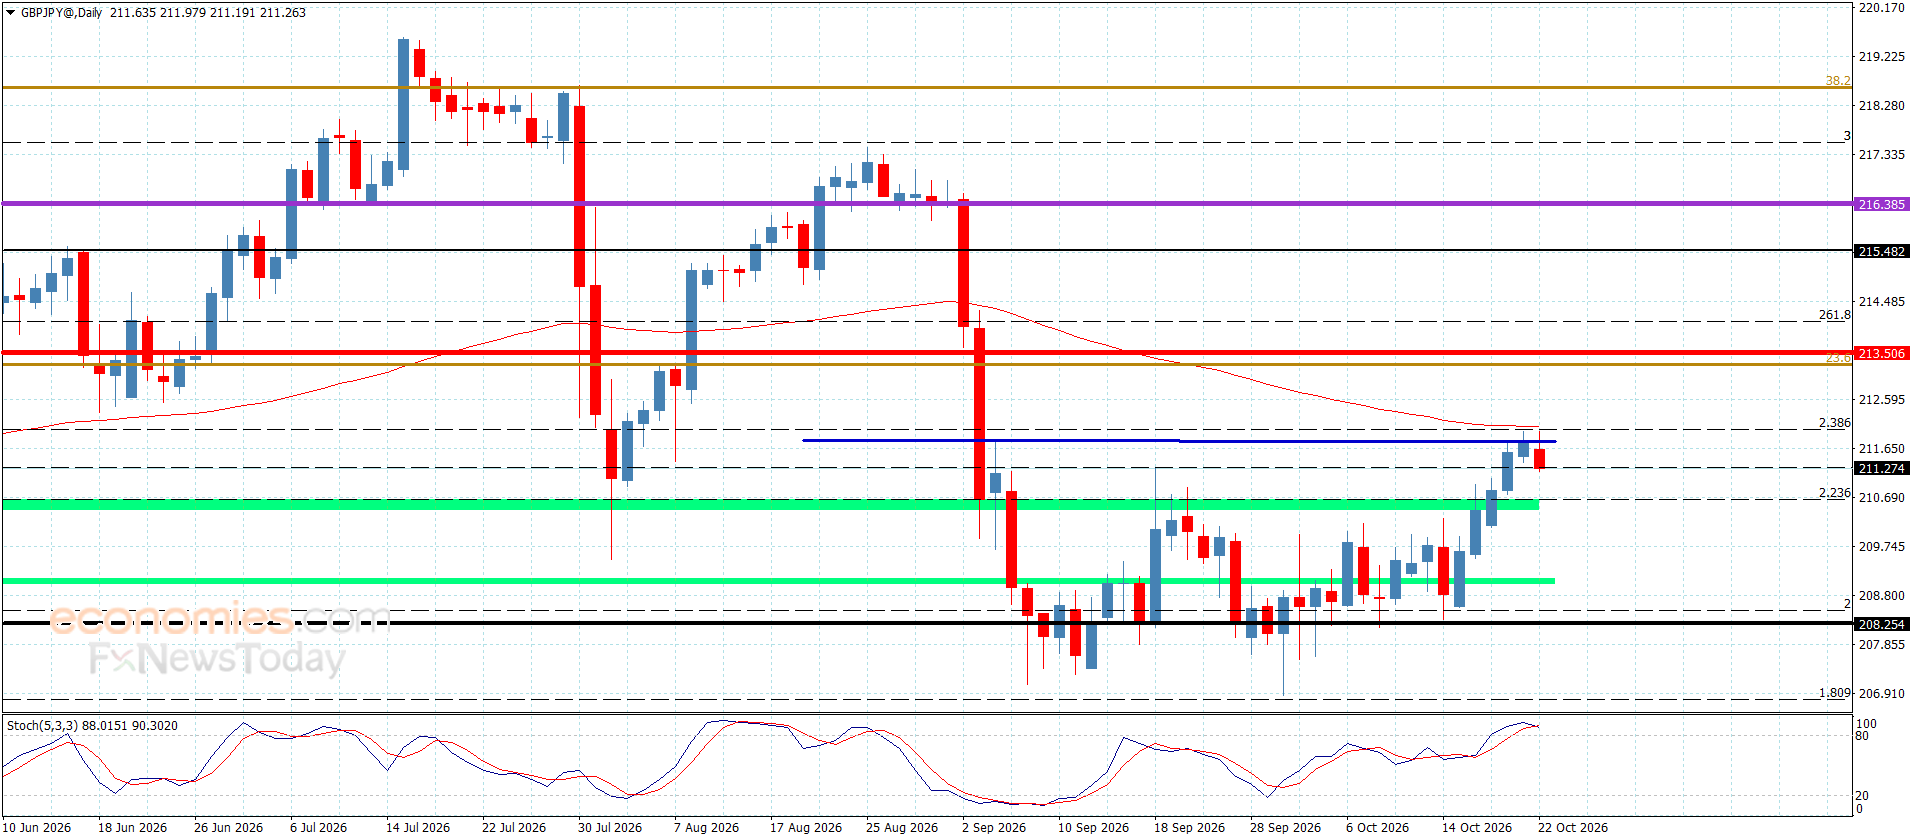
GBP/JPY trades in a narrow range on Tuesday as market sentiment remains fragile amid escalating tensions between the US and Iran, which are driving Oil prices higher once again. At the time of writing, the cross trades around 217.10 as the Japanese Yen (JPY) remains broadly weak.
Higher Oil prices are weighing on the Yen as Japan relies heavily on imported energy. At the same time, the inflationary impact of rising energy costs is reinforcing expectations that major central banks, including the Bank of England (BoE), may need to raise interest rates.
The BoJ remains on a tightening path but continues to lag behind its global peers, with wide interest rate gaps giving the British Pound (GBP) an advantage over the Yen and keeping GBP/JPY tilted to the upside.
Still, traders remain cautious about chasing GBP/JPY higher amid the growing risk of intervention by Japanese authorities as USD/JPY hovers near 40-year highs above 160.
Technical analysis: 4-hour chart
On the four-hour chart, GBP/JPY is retesting immediate resistance at the Bollinger Bands’ middle band near 217.09 while holding comfortably above the lower band at 216.41.
Momentum is moderating from recent overbought extremes, with the Relative Strength Index (RSI) near 54, while the Moving Average Convergence Divergence (MACD) indicator stays slightly negative, hinting at a slower but still constructive upside phase rather than a strongly impulsive rally.
On the upside, a clear break above the Bollinger Bands’ middle band would expose the upper band at 217.77. On the downside, initial support lies at the lower band at 216.41. A deeper pullback could expose the horizontal support levels at 215.50, 214.50, 213.50 and 212.50.
Technical analysis: Daily chart
On the daily chart, GBP/JPY maintains a bullish structure, forming a series of higher highs and higher lows. The cross trades above the Bollinger Bands’ middle band at 215.19 and holds above the nearby horizontal support at 216.50, keeping the broader upside bias intact.
The Relative Strength Index (RSI) stands at 61, reflecting firm positive momentum without entering overbought territory, while the Moving Average Convergence Divergence (MACD) remains positive, suggesting that buyers retain control.
On the upside, immediate resistance is seen at the upper Bollinger Band near 218.43, where gains could face some resistance. On the downside, initial support lies at 216.50, followed by the middle Bollinger Band at 215.19. A break below these levels could expose the lower Bollinger Band at 211.94, ahead of the horizontal support at 210.
(The technical analysis of this story was written with the help of an AI tool. Know more.)
Japanese Yen Price Today
The table below shows the percentage change of Japanese Yen (JPY) against listed major currencies today. Japanese Yen was the strongest against the US Dollar.
USD
EUR
GBP
JPY
CAD
AUD
NZD
CHF
USD
-0.21%
-0.28%
-0.16%
-0.34%
-0.36%
-0.88%
-0.40%
EUR
0.21%
-0.07%
0.06%
-0.13%
-0.15%
-0.66%
-0.18%
GBP
0.28%
0.07%
0.13%
-0.05%
-0.06%
-0.59%
-0.12%
JPY
0.16%
-0.06%
-0.13%
-0.18%
-0.22%
-0.74%
-0.27%
CAD
0.34%
0.13%
0.05%
0.18%
-0.04%
-0.54%
-0.07%
AUD
0.36%
0.15%
0.06%
0.22%
0.04%
-0.52%
-0.04%
NZD
0.88%
0.66%
0.59%
0.74%
0.54%
0.52%
0.48%
CHF
0.40%
0.18%
0.12%
0.27%
0.07%
0.04%
-0.48%
The heat map shows percentage changes of major currencies against each other. The base currency is picked from the left column, while the quote currency is picked from the top row. For example, if you pick the Japanese Yen from the left column and move along the horizontal line to the US Dollar, the percentage change displayed in the box will represent JPY (base)/USD (quote).
Silver (XAG/USD) trades on the front foot on Tuesday as softer-than-expected US inflation data tempers expectations of a near-term Federal Reserve (Fed) interest rate hike and pushes the US Dollar (USD) lower. At the time of writing, XAG/USD trades around $58.50, up nearly 2% on the day.
Following the data, the probability of a July hike fell to 12% from 40%, while the odds of a September increase eased to 59% from 74%, according to the CME FedWatch Tool.
Hovever, Silver lacks stronger upside momentum. Oil-driven inflation risks are back in focus amid escalating tensions in the Middle East, leaving the door open to a Fed rate hike later this year.
Meanwhile, the technical outlook remains bearish as XAG/USD trades well below its key moving averages, even though momentum indicators are showing early signs that selling pressure is easing.
Technical analysis
In the daily chart, XAG/USD keeps a bearish tone as price holds firmly below the 50-day, 100-day and 200-day Simple Moving Averages (SMAs). The pair remains inside a downward parallel channel, trading just under the upper boundary at $60, while the Relative Strength Index (RSI) at 39 stays in mildly bearish territory.
The Moving Average Convergence Divergence (MACD) indicator, with the line marginally above zero at 0.32, hints at some loss of downside momentum but does not yet challenge the prevailing downside bias given the heavy overhead structure.
On the topside, initial resistance is located at the channel’s upper boundary around $60, followed by the horizontal barrier at $62.50, ahead of a denser cap formed by the 50-day SMA at $69.35 and the 200-day SMA at $70.42, with the 100-day SMA higher up at $73.56 reinforcing the broader bearish backdrop.
On the downside, immediate support emerges at $55.50, with the lower edge of the descending channel near $48.50 acting as a more distant structural floor should selling pressure accelerate.
(The technical analysis of this story was written with the help of an AI tool. Know more.)
Silver FAQs
Silver is a precious metal highly traded among investors. It has been historically used as a store of value and a medium of exchange. Although less popular than Gold, traders may turn to Silver to diversify their investment portfolio, for its intrinsic value or as a potential hedge during high-inflation periods. Investors can buy physical Silver, in coins or in bars, or trade it through vehicles such as Exchange Traded Funds, which track its price on international markets.
Silver prices can move due to a wide range of factors. Geopolitical instability or fears of a deep recession can make Silver price escalate due to its safe-haven status, although to a lesser extent than Gold’s. As a yieldless asset, Silver tends to rise with lower interest rates. Its moves also depend on how the US Dollar (USD) behaves as the asset is priced in dollars (XAG/USD). A strong Dollar tends to keep the price of Silver at bay, whereas a weaker Dollar is likely to propel prices up. Other factors such as investment demand, mining supply – Silver is much more abundant than Gold – and recycling rates can also affect prices.
Silver is widely used in industry, particularly in sectors such as electronics or solar energy, as it has one of the highest electric conductivity of all metals – more than Copper and Gold. A surge in demand can increase prices, while a decline tends to lower them. Dynamics in the US, Chinese and Indian economies can also contribute to price swings: for the US and particularly China, their big industrial sectors use Silver in various processes; in India, consumers’ demand for the precious metal for jewellery also plays a key role in setting prices.
Silver prices tend to follow Gold’s moves. When Gold prices rise, Silver typically follows suit, as their status as safe-haven assets is similar. The Gold/Silver ratio, which shows the number of ounces of Silver needed to equal the value of one ounce of Gold, may help to determine the relative valuation between both metals. Some investors may consider a high ratio as an indicator that Silver is undervalued, or Gold is overvalued. On the contrary, a low ratio might suggest that Gold is undervalued relative to Silver.
The Pound to US Dollar (GBP/USD) exchange rate advanced strongly on Tuesday after softer US inflation figures prompted investors to scale back expectations for further Federal Reserve interest rate hikes.
At the time of writing, GBP/USD was trading around $1.3416, up approximately 0.5% from the opening levels of Tuesday’s session.
The US Dollar (USD) came under broad selling pressure on Tuesday following the publication of the latest US consumer price index, which indicated price pressures eased by more than markets had anticipated in June.
Headline inflation slowed from 4.2% to 3.5% year-on-year, beating expectations for a more modest decline to 3.8%. Core inflation also surprised to the downside, with the annual rate easing to 2.6%.
The weaker inflation print prompted investors to reassess the outlook for US monetary policy, with market pricing for a September Federal Reserve interest rate increase falling from roughly 70% to around 50%.
The Pound (GBP) also attracted buyers on Tuesday as investors continued to anticipate that the Bank of England (BoE) may yet be forced to tighten monetary policy again.
Those expectations have been reinforced by the latest surge in global energy prices. Renewed conflict in the Gulf has resulted in the closure of the Strait of Hormuz, fuelling concerns over higher import costs and the potential for another inflationary shock that could keep pressure on the BoE to raise borrowing costs before the end of 2026.
Save on Your GBP/USD Transfer
Get better rates and lower fees on your next international money transfer.
Compare TorFX with top UK banks in seconds and see how much you could save.
However, Sterling’s advance was capped by measured remarks from Bank of England Governor Andrew Bailey.
Appearing before the Treasury Select Committee, Bailey warned that escalating tensions in the Middle East present significant risks to financial stability, while also highlighting that weak domestic growth continues to weigh on the UK’s economic outlook.
Near-Term GBP/USD Forecast: US Producer Prices Awaited
Looking to the midweek session, attention will turn to the publication of the latest US producer price index, which is expected to provide the next major catalyst for the Pound to US Dollar (GBP/USD) exchange rate.
If producer price inflation also points to easing price pressures, investors may further unwind expectations for additional Federal Reserve tightening, potentially placing renewed pressure on the US Dollar.
Meanwhile, the Pound may struggle to establish a clear direction on Wednesday as the UK economic calendar remains quiet ahead of Thursday’s closely watched GDP release.
Like this piece? Please share with your friends and colleagues:
International Money Transfer? Ask our resident FX expert a money transfer question or try John’s new, free, no-obligation personal service! ,where he helps every step of the way,
ensuring you get the best exchange rates on your currency requirements.
Copper price suffered new positive pressures due to the continuation of forming extra support by moving average 55 stability near $5.9500, besides stochastic rally to 80 level, forcing it to delay the previously waited corrective attempts by its rally towards $6.2850, approaching the initial barrier.
The continuation of the positive pressure might push it to surpass the current barrier, to record some gains by its rally towards $6.3800 and $6.4500, while the failure of the breach will force it to provide mixed trading with a new chance to target $6.1000 level, reaching the mentioned support to find an exit for activating the corrective trend again.
The expected trading range for today is between $6.1500 and $6.3800
The USD/JPY pair remains on the back foot through the first half of the European session on Tuesday. Intervention risks support the Japanese Yen (JPY) and act as a headwind for spot prices amid a softer US Dollar (USD). Spot prices, however, remain close to a four-decade high, touched earlier this month, as traders await US consumer inflation figures and Federal Reserve’s (Fed) Kevin Warsh’s inaugural congressional testimony.
In the meantime, the persistently wide interest rate gap between Japan and other major economies, including the US, continues to undermine the JPY amid economic concerns stemming from the Middle East crisis. Furthermore, escalating US-Iran tensions and firming Fed hike expectations, amid renewed inflation fears due to the closure of the Strait of Hormuz, help limit the USD losses and warrant some caution before placing bearish bets on the USD/JPY pair.
From a technical perspective, spot prices remain confined between two converging trend lines, forming a symmetrical triangle on the 4-hour chart. Against the backdrop of a strong rally from the May monthly swing low, the said triangle might be categorized as a bullish consolidation phase before the next leg up. Furthermore, a corrective pullback earlier this month showed resilience below the 200-period Exponential Moving Average (EMA) on the 4-hour chart.
Meanwhile, momentum indicators are relatively muted. In fact, the Relative Strength Index (RSI) is hovering near a neutral 52, and the Moving Average Convergence Divergence (MACD) is fractionally positive near the zero line, hinting at a cautious upside tone rather than an impulsive rally. Hence, it will be prudent to wait for a breakout through the triangle resistance, near 162.55-162.60, before positioning for any further appreciation for the USD/JPY pair.
On the downside, the latest close at 162.10-162.00 forms initial intraday support, ahead of the rising trend-line floor at 161.60 and the 200-period EMA clustered near 161.15. A convincing break and acceptance below the latter would be needed to signal a deeper corrective phase in the USD/JPY pair. Nevertheless, the broader technical setup suggests that the uptrend is still intact despite the latest consolidation.
(The technical analysis of this story was written with the help of an AI tool. Know more.)
USD/JPY 4-hour chart
Japanese Yen Price Today
The table below shows the percentage change of Japanese Yen (JPY) against listed major currencies today. Japanese Yen was the strongest against the US Dollar.
USD
EUR
GBP
JPY
CAD
AUD
NZD
CHF
USD
-0.16%
-0.20%
-0.15%
-0.45%
-0.35%
-0.83%
-0.27%
EUR
0.16%
-0.03%
0.04%
-0.29%
-0.18%
-0.66%
-0.10%
GBP
0.20%
0.03%
0.07%
-0.24%
-0.13%
-0.63%
-0.06%
JPY
0.15%
-0.04%
-0.07%
-0.31%
-0.23%
-0.71%
-0.16%
CAD
0.45%
0.29%
0.24%
0.31%
0.09%
-0.38%
0.17%
AUD
0.35%
0.18%
0.13%
0.23%
-0.09%
-0.48%
0.10%
NZD
0.83%
0.66%
0.63%
0.71%
0.38%
0.48%
0.56%
CHF
0.27%
0.10%
0.06%
0.16%
-0.17%
-0.10%
-0.56%
The heat map shows percentage changes of major currencies against each other. The base currency is picked from the left column, while the quote currency is picked from the top row. For example, if you pick the Japanese Yen from the left column and move along the horizontal line to the US Dollar, the percentage change displayed in the box will represent JPY (base)/USD (quote).
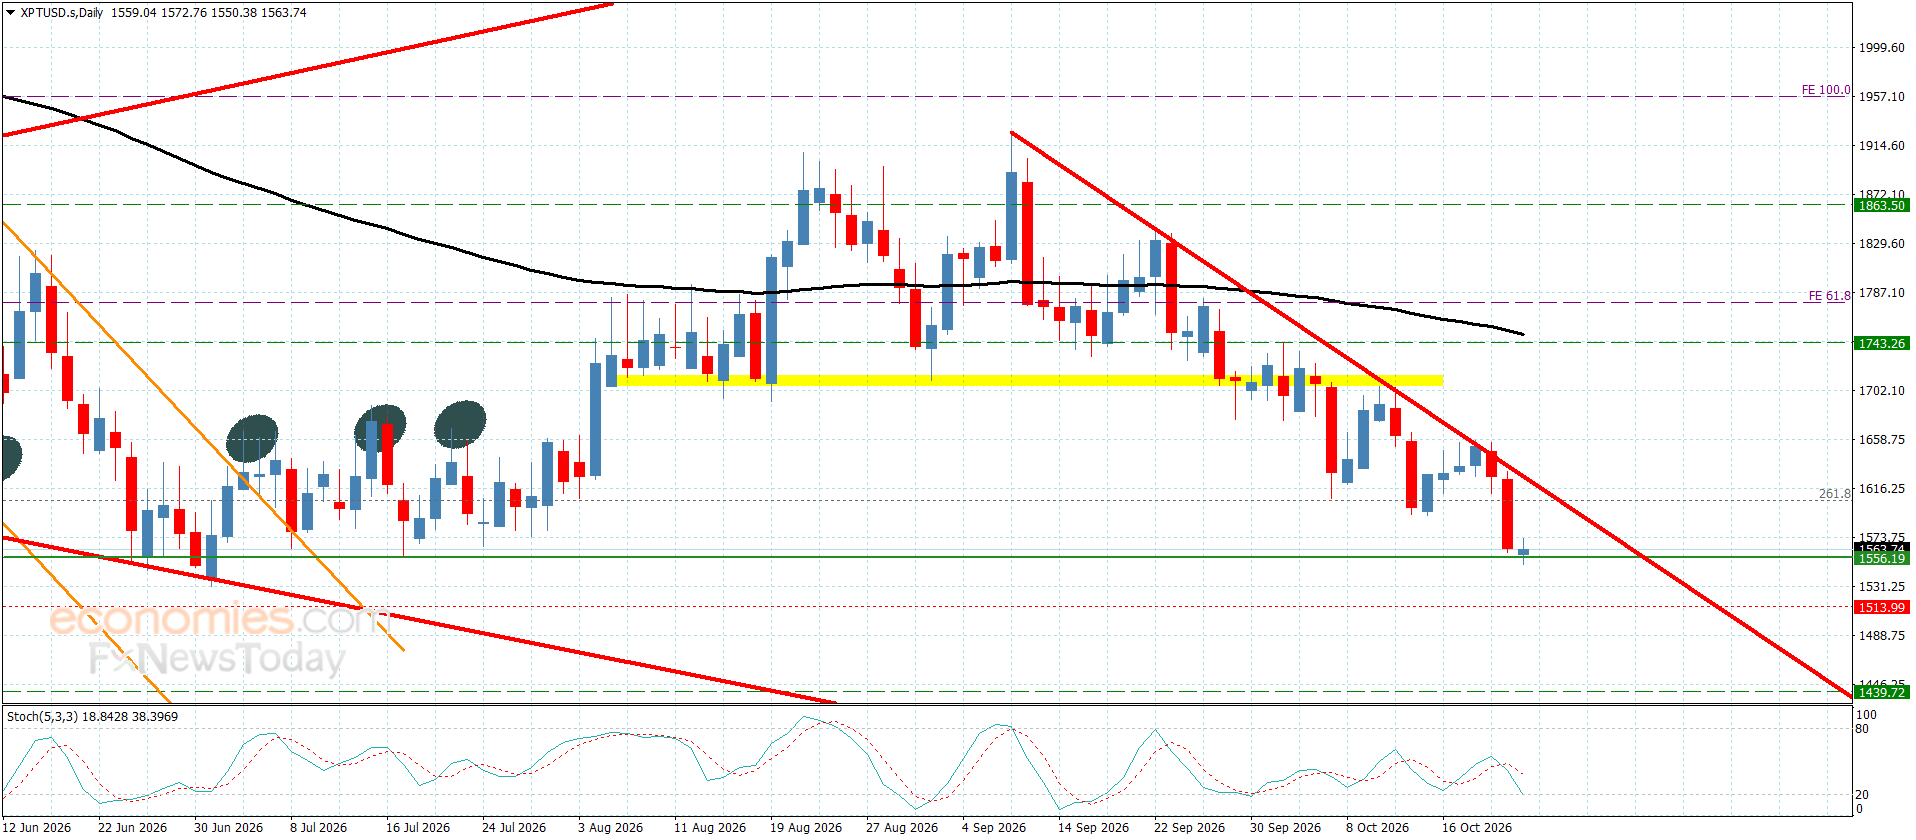
Platinum price kept providing weak sideways trading by its stability near $1605.00 level, affected by the contradiction of the main indicators, obstructing the attempts of activating the suggested negative trend.
The price needs a new negative momentum, which allow it to reach $1510.00 support, while breaking it will confirm its move to a new negative station, to target $1440.00 level, reaching $1310.00, while holding above this support might provide a chance for recording some gains by target $1690.00 level, reaching the barrier near $1785.00
The expected trading range for today is between $1555.00 and $1680.00