About Editorial team of BIPNs

Main team of content of bipns.com. Any type of content should be approved by us.
20 11, 2025

Cardano Price Prediction: ADA Hits Key Support as On-Chain Metrics Flash Rare Buy Signal

By |2025-11-20T12:15:29+02:00November 20, 2025|Crypto News, News|0 Comments

Cardano price has slipped into a key long-term support zone, drawing attention as participants assess whether this deep pullback sets the stage for its next major recovery move.

Cardano price has dropped into fresh 90-day lows, and the market is finally starting to treat this move as a full capitulation phase. What makes this moment interesting is that these deep pullbacks have historically marked the same zones where Cardano begins building its strongest recoveries. With sentiment washed out and positioning heavily reset, ADA is entering one of those rare periods where long-term opportunity and short-term pressure are converging.

Cardano price is trading around $0.48, up 2.87% in the last 24 hours. Source: Brave New Coin

Sentiment Reset as ADA Hits 90-Day Lows

Market sentiment around ADA has slipped into full capitulation territory, with price sitting at fresh 90-day lows while Alex expresses clear despair. These conditions often appear late in a downtrend, and historically, ADA has shown its strongest rebounds from similar exhaustion phases. The broader conversation across the ADA community hints that many retail participants have already exited, leaving repositioning opportunities for patient buyers who understand Cardano’s long-cycle behavior.

Cardano Price Prediction: ADA Hits Key Support as On-Chain Metrics Flash Rare Buy Signal

Cardano price has now slipped into a deep capitulation zone at 90-day lows, a level where past cycles have often sparked sharp recovery phases. Source: Alex via X

The tone across social platforms reflects a classic oversold environment: fear is high, conviction is low, and short-term emotions are overshadowing fundamentals. These phases rarely last long, but they do create conditions where accumulation becomes more favorable for long-term participants.

On-Chain Metrics Place ADA Deep in the Buy Zone

Santiment’s 30-Day MVRV metric shows ADA sliding into the “Extreme Buy Zone,” where previous negative-MVRV stretches have produced outsized recovery moves. The chart highlights that most recent buyers are underwater, a typical bottom-building condition where selling pressure becomes depleted. Historically, when ADA enters this area, volatility follows, often to the upside.
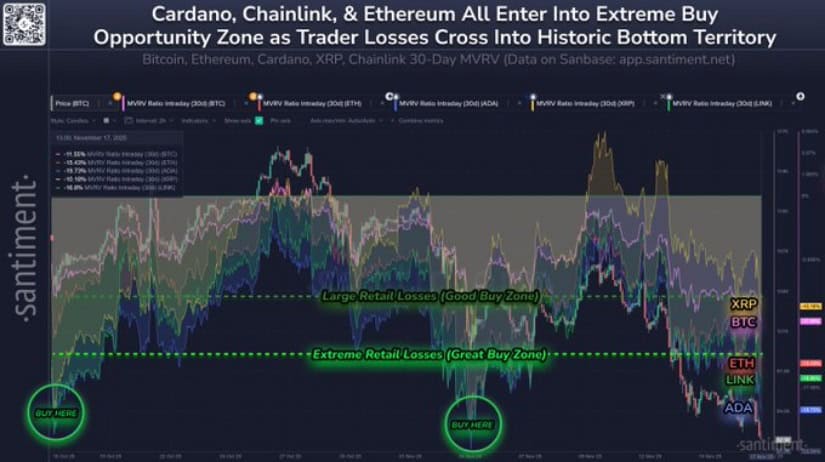
On-Chain Metrics Place ADA Deep in the Buy Zone

ADA’s 30-Day MVRV has dropped into the Extreme Buy Zone, a level that has repeatedly triggered strong rebound phases in past cycles. Source: Coin Bureau via X

This on-chain context reinforces that the current drawdown is less about fundamentals and more about market positioning. As broader altcoins like LINK and ETH also dip into negative MVRV zones, the data suggests a synchronized value pocket forming across major L1 ecosystems, with ADA sitting closer to the deeper end of that zone.

ADA Approaches a Major Long-Term Support Region

TapTools’ chart shows Cardano price pressing into a long-term structural support around $0.45, a level that has historically acted as a cycle reset point. Price is trading below the 25-day and 99-day moving averages, showing clear momentum loss, but the multi-year support band sitting just below current levels has repeatedly produced strong medium-term reactions.

This is the area where long-term participants typically accumulate, especially when confluence aligns across moving averages, volume behavior, and historical trend reversals. If this support does its job again, ADA could stabilize and form a base for its next structural expansion.
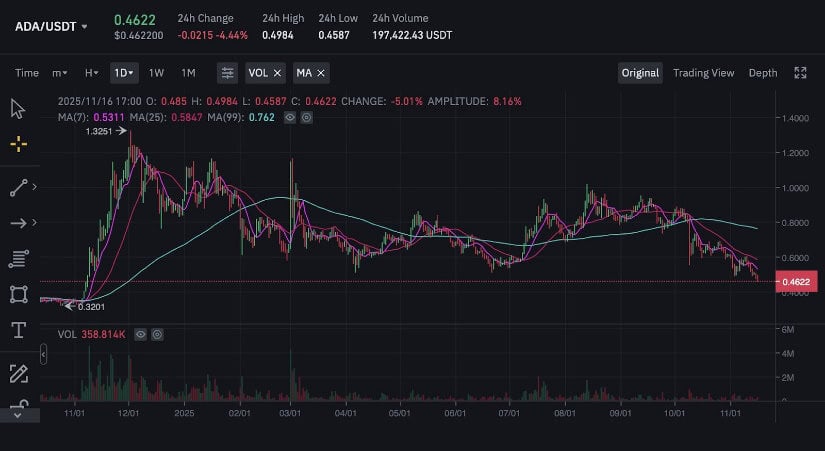
ADA Approaches a Major Long-Term Support Region

ADA is now testing a long-term support band near $0.45, a zone that has repeatedly triggered strong trend resets in previous cycles. Source: TapTools via X

Cardano Price Prediction Points Towards the Next Target

Cardano’s weekly structure, shared in the Smcapitalclub’s chart, reveals a key demand block sitting just beneath current price, aligning perfectly with the long-term accumulation zone. Even if ADA prints a small bounce from here, the macro trend still leans towards a continuation into the lower part of the demand region unless buyers step in aggressively.

Cardano Price Prediction Points Towards the Next Target

ADA’s weekly chart highlights a key demand block pointing towards the $0.36–$0.40 zone, the next major liquidity region on Smcapitalclub’s structure. Source: Smcapitalclub via X

Targets on the chart show the next major level between $0.36 and $0.40, where previous consolidation and liquidity buildup occurred. If Cardano price fully taps that region, it would complete a textbook cycle repetition, creating conditions for a stronger multi-week reversal. This remains the key area to watch for a sustainable trend shift.

Community Voices Push Back Against Selling at Lows

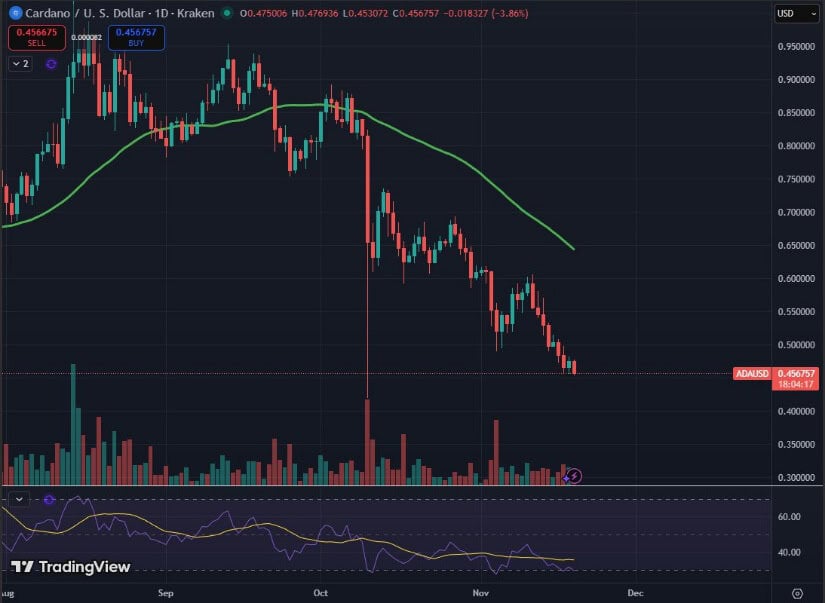
ADA’s community sentiment is beginning to stabilize, while analyst Sssebi warns that selling at these levels historically leads to regret. The chart shows Cardano price grinding down a clean descending structure, but also highlights oversold conditions and weakening downside momentum.
Community Voices Push Back Against Selling at Lows

ADA’s community sentiment is stabilizing, with many warning that selling at these oversold levels has historically proven premature. Source: Sssebi via X

The conversation in the community is shifting towards accumulation rather than panic. Long-term stakers and analysts emphasize that Cardano tends to move in sharp cycles; the deepest sell-offs often happen right before trend resets. This aligns with the broader on-chain and technical context, indicating exhaustion rather than a fresh bearish continuation.

Final Thoughts

Cardano price now sits at the intersection of macro support, on-chain value zones, and sentiment capitulation, the same ingredients that shaped previous mid-cycle reversals. ADA charts show room for one more liquidity sweep towards the $0.36–$0.40 zone, but the broader structure looks increasingly mature for a reset.

What matters from here is whether ADA can stabilize, reclaim its short-term moving averages, and rebuild structure in this high-value region. With a negative MVRV flashing opportunity and long-term support approaching, the risk-reward profile strengthens for patient accumulation while volatility remains elevated.

Source link

20 11, 2025

METABORA GAMES Forms Strategic Partnership with NEOSTELLAGAMES To Co-Develop and Launch Web3 Games

By |2025-11-20T10:51:22+02:00November 20, 2025|News, NFT News|0 Comments


  • A strategic partnership with NEOSTELLAGAMES, a mobile game studio with strong global live-service capabilities
  • Co-developing a casual roguelike RPG for the global Web3 market with an H5 title
  • Enhancing BORA token utility through payment, rewards, and onboarding collaboration

SEOUL, South Korea, Nov. 20, 2025 /PRNewswire/ — METABORA GAMES (CEO Choi Se-hoon), a leading blockchain game developer, announced today that it has signed a partnership with NEOSTELLAGAMES (CEO Kim Tae-Kyun) to co-develop and globally launch a Web3 game built on HTML5 (H5).

NEOSTELLAGAMES is a mobile game studio founded by developers who have led a wide range of projects at major global companies including Line Play, Disney Interactive, and NCSOFT. The studio has extensive experience in commercial game development and global live service operations, and has built strong expertise in the casual and idle RPG genres. With additional experience in Web3 game development, the company has also secured capabilities for next generation hybrid game production.

Through this partnership, the two companies will collaborate on the launch of a next generation Web3 title that combines H5 accessibility with a Web3-driven, targeting for the global H5 game market. NEOSTELLAGAMES will lead development and live service operations for a casual roguelike RPG Web3 game, while METABORA GAMES will support tokenomics design optimized for synergy with the BORA ecosystem, along with global Web3 marketing and user engagement systems.

The new title jointly developed by the two companies will support in-app payments that allow players to purchase in game items using the BORA token. The game is also planned to introduce a gas abstraction feature, enabling players to pay gas fees with BORA even without holding KAIA tokens.

METABORA GAMES has been actively pursuing external collaborations to secure H5 based Web3 game titles. Through this onboarding partnership with NEOSTELLAGAMES, the company plans to expand its global lineup of H5 based Web3 games, strengthen the utility of the BORA token, and accelerate the growth of its ecosystem.

A representative from METABORA stated that the company will continue to expand its portfolio of H5 based titles across various genres, increase real use cases for the BORA token, and further enhance user engagement. 

About METABORA

METABORA is a casual game developer and the service operator of the blockchain platform BORA.

The BORA ecosystem brings together partners across various industries—ranging from tokenomics and content to blockchain technology—driving innovation and collaboration across games, sports, and entertainment.

BORA is a national game/entertainment token with a high liquidity in the market and reinforcing the accessibility of users and services abroad by increasing the listing on global cryptocurrency exchanges and expanding partnership.

Photo – https://mma.prnewswire.com/media/2827222/METABORA_GAMES_Forms_Strategic_Partnership_NEOSTELLAGAMES_To_Co_Develop_Launch_Web3.jpg


Source link

20 11, 2025

WTI price bullish at European opening

By |2025-11-20T10:49:14+02:00November 20, 2025|Forex News, News|0 Comments


West Texas Intermediate (WTI) Oil price advances on Thursday, early in the European session. WTI trades at $59.34 per barrel, up from Wednesday’s close at $59.28.
Brent Oil Exchange Rate (Brent crude) is also up, advancing from the $63.15 price posted on Wednesday, and trading at $63.21.

WTI Oil FAQs

WTI Oil is a type of Crude Oil sold on international markets. The WTI stands for West Texas Intermediate, one of three major types including Brent and Dubai Crude. WTI is also referred to as “light” and “sweet” because of its relatively low gravity and sulfur content respectively. It is considered a high quality Oil that is easily refined. It is sourced in the United States and distributed via the Cushing hub, which is considered “The Pipeline Crossroads of the World”. It is a benchmark for the Oil market and WTI price is frequently quoted in the media.

Like all assets, supply and demand are the key drivers of WTI Oil price. As such, global growth can be a driver of increased demand and vice versa for weak global growth. Political instability, wars, and sanctions can disrupt supply and impact prices. The decisions of OPEC, a group of major Oil-producing countries, is another key driver of price. The value of the US Dollar influences the price of WTI Crude Oil, since Oil is predominantly traded in US Dollars, thus a weaker US Dollar can make Oil more affordable and vice versa.

The weekly Oil inventory reports published by the American Petroleum Institute (API) and the Energy Information Agency (EIA) impact the price of WTI Oil. Changes in inventories reflect fluctuating supply and demand. If the data shows a drop in inventories it can indicate increased demand, pushing up Oil price. Higher inventories can reflect increased supply, pushing down prices. API’s report is published every Tuesday and EIA’s the day after. Their results are usually similar, falling within 1% of each other 75% of the time. The EIA data is considered more reliable, since it is a government agency.

OPEC (Organization of the Petroleum Exporting Countries) is a group of 12 Oil-producing nations who collectively decide production quotas for member countries at twice-yearly meetings. Their decisions often impact WTI Oil prices. When OPEC decides to lower quotas, it can tighten supply, pushing up Oil prices. When OPEC increases production, it has the opposite effect. OPEC+ refers to an expanded group that includes ten extra non-OPEC members, the most notable of which is Russia.


Source link

20 11, 2025

Eyes 182.00 after hitting record highs

By |2025-11-20T10:31:53+02:00November 20, 2025|Forex News, News|0 Comments

EUR/JPY extends its winning streak for the fourth successive session, reached fresh all-time high of 181.73 and currently trading around 181.40 during the early European hours on Thursday. The currency cross moves upwards within the ascending channel pattern, suggesting a persistent bullish bias.

Additionally, the 14-day Relative Strength Index (RSI) has moved above the 70 mark, indicating overbought conditions and a likelihood of a near-term downward correction. The EUR/JPY cross suggests a stronger short-term momentum, as it remains above the nine-day Exponential Moving Average (EMA).

On the upside, the initial resistance lies at the psychological level of 182.00, followed by the upper boundary of the ascending channel around 182.20. A break above this confluence area could reinforce the bullish bias and lead the EUR/JPY cross to approach the crucial level of 183.00.

The initial support lies at the lower boundary of the ascending channel around 180.20, followed by the nine-day EMA at 179.85. Further declines below this confluence support zone would weaken the bullish bias and put downward pressure on the EUR/JPY cross to navigate the area around the 50-day EMA at 176.65.

From a macro perspective, the Japanese Yen struggles against its peers due to the potential for Japan’s Prime Minister Sanae Takaichi to unveil a stimulus package exceeding JPY 20 trillion.

The upside of the EUR/JPY cross could be restrained as the JPY may receive support on emergence of hawkish sentiment surrounding the Bank of Japan (BoJ) policy outlook. A Reuters poll indicated that the BoJ appears poised to raise interest rates to 0.75% from 0.50% at its December 18–19 meeting.

Additionally, BoJ board member Junko Koeda noted that she believes the central bank must continue to raise the policy interest rate and adjust the degree of monetary accommodation in accordance with improvement in economic activity and prices.” Koeda emphasized that ongoing economic and price trends warrant further policy adjustment.

EUR/JPY: Daily Chart

Euro Price Today

The table below shows the percentage change of Euro (EUR) against listed major currencies today. Euro was the strongest against the Japanese Yen.

USD EUR GBP JPY CAD AUD NZD CHF
USD 0.05% -0.16% 0.33% -0.01% -0.12% -0.17% 0.00%
EUR -0.05% -0.20% 0.25% -0.06% -0.17% -0.22% -0.05%
GBP 0.16% 0.20% 0.47% 0.14% 0.03% -0.02% 0.16%
JPY -0.33% -0.25% -0.47% -0.34% -0.44% -0.51% -0.32%
CAD 0.01% 0.06% -0.14% 0.34% -0.10% -0.16% 0.03%
AUD 0.12% 0.17% -0.03% 0.44% 0.10% -0.05% 0.12%
NZD 0.17% 0.22% 0.02% 0.51% 0.16% 0.05% 0.18%
CHF -0.00% 0.05% -0.16% 0.32% -0.03% -0.12% -0.18%

The heat map shows percentage changes of major currencies against each other. The base currency is picked from the left column, while the quote currency is picked from the top row. For example, if you pick the Euro from the left column and move along the horizontal line to the US Dollar, the percentage change displayed in the box will represent EUR (base)/USD (quote).

Source link

20 11, 2025

Top Global Industry Trends in 2026

By |2025-11-20T10:16:36+02:00November 20, 2025|Dietary Supplements News, News|0 Comments


Nutraceutical

The global nutraceutical market is poised for significant growth from 2025 to 2035, driven by increasing consumer focus on preventive healthcare, wellness, and science-backed nutrition. Nutraceuticals-which encompass vitamins, minerals, dietary supplements, herbal products, and functional foods-are gaining popularity for their ability to promote overall health, prevent disease, and complement conventional medical therapies. The market is expected to grow from USD 296.0 billion in 2025 to USD 505.0 billion by 2035, reflecting a robust CAGR of 5.5%.

Market Dynamics and Growth Drivers

Rising health consciousness, a shift toward preventive healthcare, and growing demand for functional foods are key drivers. Vitamins and minerals dominate the market with a 39% share, while capsules and tablets remain the most preferred delivery form, accounting for 52% of sales. Technological advancements in formulation, enhanced bioavailability, and automated manufacturing processes are further accelerating adoption. Additionally, consumer preference for evidence-based nutrition and personalized wellness solutions is boosting demand across age groups.

Applications and Industry Adoption

Nutraceuticals are widely used in dietary supplements, functional foods, and beverages, with increasing applications in sports nutrition, weight management, cognitive health, and immunity support. The market also benefits from the growing trend of integrating nutraceuticals into daily diets through fortified foods and beverages, allowing consumers to achieve preventive health goals conveniently. Botanical extracts are a growing segment, reflecting the demand for plant-based, natural products.

To access the complete data tables and in-depth insights, request a Discount On The Report here: https://www.factmr.com/connectus/sample?flag=S&rep_id=2548

Regional Insights

North America and Europe represent major markets, driven by high health awareness, regulatory frameworks, and established healthcare infrastructure. Asia-Pacific is the fastest-growing region, led by rising disposable incomes, urbanization, and expanding e-commerce channels for nutraceutical distribution. Emerging markets in India, China, and Southeast Asia are showing strong growth potential, fueled by traditional medicine practices and increasing adoption of supplements.

Challenges and Strategic Implications

Regulatory variations across countries, ingredient efficacy concerns, and complex formulation requirements pose challenges to market growth. Companies are investing in R&D, advanced ingredient systems, and compliance to address these hurdles. Strategic partnerships with healthcare providers, wellness platforms, and distribution networks are critical for maximizing reach and maintaining product quality.

Outlook Summary

From 2025 to 2035, the nutraceutical market is expected to grow steadily, driven by preventive healthcare adoption, technological innovation in formulations, and rising consumer awareness. Vitamins and minerals, capsules and tablets, and botanical extracts represent key growth segments. North America, Europe, and Asia-Pacific will remain strategic regions, with companies focusing on bioavailability enhancement, product diversification, and distribution expansion. This market offers sustainable growth opportunities for manufacturers, healthcare providers, and investors committed to advancing wellness, nutrition, and preventive health solutions globally.

The decade-long growth trajectory underscores the transformation of nutraceuticals from traditional dietary supplements to sophisticated, science-backed wellness solutions with broad applications in preventive healthcare, functional foods, and personalized nutrition.

Browse Full Report – https://www.factmr.com/report/2548/nutraceutical-market

Purchase Full Report for Detailed Insights

For access to full forecasts, regional breakouts, company share analysis, and emerging trend assessments, you can purchase the complete report here: https://www.factmr.com/checkout/2548

Have a specific Requirements and Need Assistant on Report Pricing or Limited Budget please contact us – sales@factmr.com

To View Related Report:

Citrus Fiber Market https://www.factmr.com/report/2305/citrus-fiber-market

Stock Cube Market https://www.factmr.com/report/2466/stock-cubes-market

Freezer & Beverage and Wine Cooler Market https://www.factmr.com/report/2550/freezer-beverage-and-wine-cooler-market

Vegetable Proteins Market https://www.factmr.com/report/2867/vegetable-proteins-market

– Contact Us –

11140 Rockville Pike, Suite 400, Rockville,

MD 20852, United States

Tel: +1 (628) 251-1583 | sales@factmr.com

About Fact.MR

Fact.MR is a global market research and consulting firm, trusted by Fortune 500 companies and emerging businesses for reliable insights and strategic intelligence. With a presence across the U.S., UK, India, and Dubai, we deliver data-driven research and tailored consulting solutions across 30+ industries and 1,000+ markets. Backed by deep expertise and advanced analytics, Fact.MR helps organizations uncover opportunities, reduce risks, and make informed decisions for sustainable growth.

This release was published on openPR.


Source link

20 11, 2025

XRP Price Prediction: ETF Launches Introduce Liquidity Amid $2 Support Fragility

By |2025-11-20T10:14:55+02:00November 20, 2025|Crypto News, News|0 Comments

The mix of institutional optimism and market caution has heightened attention among traders, analysts, and long-term holders.

While ETF launches can introduce fresh liquidity, their impact often varies depending on macroeconomic conditions, investor risk appetite, and prior market positioning. Historical cases show that some ETF debuts have caused strong price moves, while others have resulted in muted market reactions, highlighting the need for measured expectations.

Institutional Interest Rises with New XRP ETFs

Several asset managers, including Franklin Templeton and Bitwise, are launching XRP ETFs this week. Franklin Templeton’s ETF, listed under the ticker EZRP, is scheduled to debut on the CBOE on November 18, shortly after Canary Capital’s XRP ETF recorded $58 million in first-day trading volume. Bitwise is planning its second major crypto ETF on November 20, following a successful Solana ETF rollout last month.

Franklin Templeton’s XRP ETF (EZRP) goes live on Tuesday, followed by Bitwise on November 20, marking a potentially significant week of institutional liquidity inflows. Source: Diana via X

According to ETF strategists cited on TradingView and market research desks, the presence of established financial brands can attract institutional participation. However, they caution that inflows depend not just on the ETF launch itself but also on broader market sentiment and liquidity conditions.

ETF analysts note that while early inflows are possible, these events do not guarantee sustained upward price movement. ETF launches may catalyze demand, but historical patterns suggest that outcomes can vary depending on macroeconomic conditions and market positioning. Market Sentiment and $2 Support

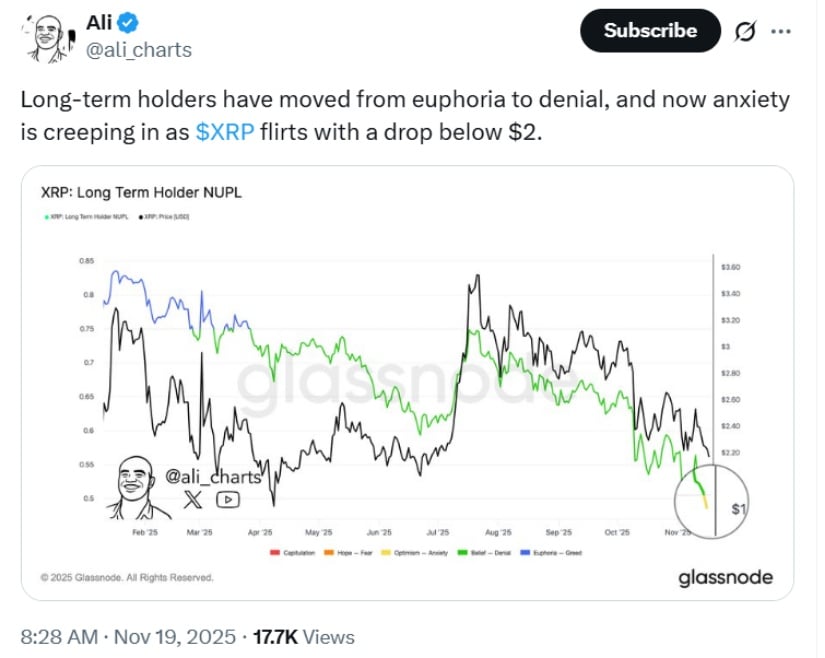
XRP currently trades around $2.21, only slightly above the psychological $2 support zone. On-chain metrics, such as Glassnode’s Net Unrealized Profit/Loss (NUPL), show long-term holders shifting from “belief/denial” to “optimism/anxiety.” NUPL transitions can indicate changes in investor conviction and potential caution before price rallies or corrections, making it a useful tool for gauging market sentiment.

XRP Price Prediction: ETF Launches Introduce Liquidity Amid  Support Fragility

Long-term XRP holders have shifted from euphoria to denial, with growing anxiety as the price teeters near $2. Source: Ali Martinez via X

Social media commentary reflects a spectrum of expectations. For instance, EGRAG Crypto, a technical analyst on X, noted, “XRP could decline slightly before a potential rally, given the current support dynamics,” while trader Javon Marks referenced prior ETF cycles to highlight that structured liquidity inflows could lead to substantial upside—but emphasized that uncertainty remains.

Analysts generally highlight that holding the $2 support level is critical, as a breach could trigger broader short-term downside pressure.

Technical Analysis: Breakout Potential vs. Risks

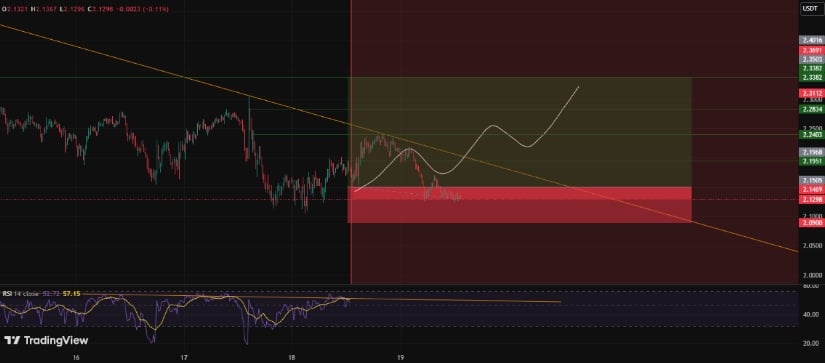
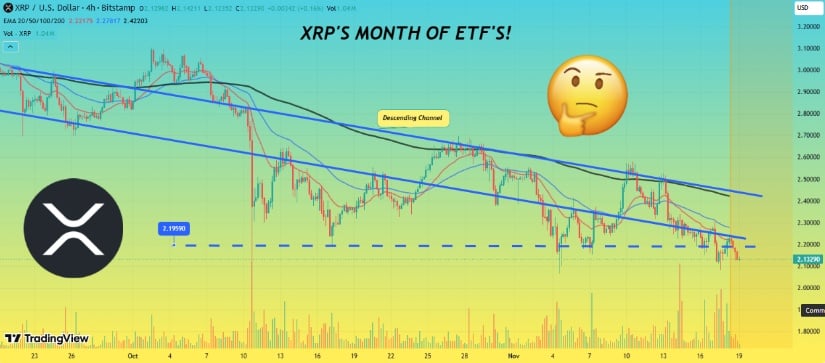
Technical analysts observing XRP note that the price is forming a bullish pattern within a descending channel, with higher lows supporting potential upward movement. A breakout above $2.195 is often cited as an early confirmation signal for continuation toward $2.24–$2.30, though analysts stress that these projections rely on price respecting lower support bands.

Technical Analysis: Breakout Potential vs. Risks

XRP/USDT is holding strong support at 2.10–2.12, with a bullish structure aiming for 2.195–2.330, while maintaining a stop-loss at 2.090. Source: mastercrypto2020 on TradingView

Chart analysts caution that a close below $2.09 would invalidate bullish setups, potentially signaling further downside. Such assessments are derived from standard technical analysis methods, including trendline validation and channel breakout measurements, and should be interpreted alongside broader market context.

Short-Term Volatility and Whale Activity

Recent market data shows short-term anomalies, such as a “flash wick” on Kraken moving XRP/USD briefly from $2.18 to $2.1979. TradingView contributors note that such wicks often reflect isolated liquidity imbalances rather than lasting structural price changes.

Short-Term Volatility and Whale Activity

XRP remains resilient above $2.10, with ETF launches and technical patterns hinting at a potential bullish breakout. Source: Rocksorgate on TradingView

Additionally, on-chain tracking revealed a $95 million XRP transfer to Binance, which could indicate repositioning by larger holders (“whales”). Analysts caution that while large transfers can precede significant moves, these events are not always predictive and should be viewed in combination with ETF flows, technical levels, and overall market conditions.

Bitcoin’s recent decline (~14% from $115,000 to ~$94,000–$95,000) has added broader market pressure, but XRP has maintained relative resilience above key support levels.

Balancing Opportunity and Caution

Traders, long-term holders, and institutional observers are monitoring several key factors this week:

  • ETF inflows: Potentially increasing liquidity, but outcomes vary.

  • Support levels: $2 remains a critical threshold; breaches could trigger short-term downside.

  • Technical confirmations: Breakouts above $2.195 could suggest upward momentum, but descending-channel dynamics must be respected.

  • Market sentiment and on-chain metrics: Tools like NUPL offer insight into long-term holder positioning, but signals are probabilistic, not deterministic.

Balancing Opportunity and Caution

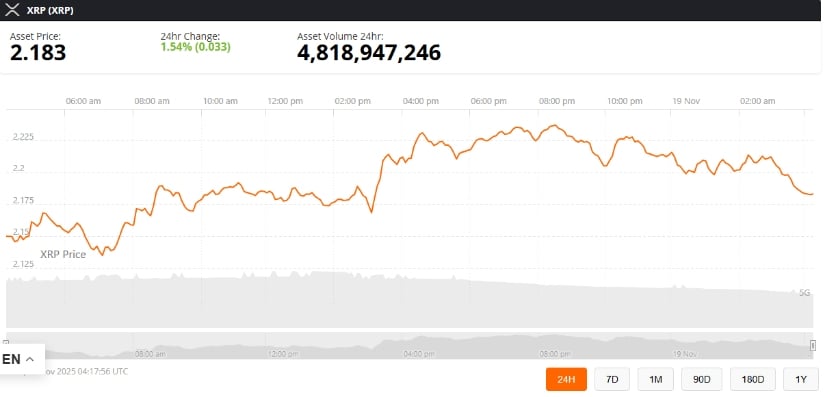
XRP was trading at around 2.18, up 1.54% in the last 24 hours at press time. Source: XRP price via Brave New Coin

While ETF launches provide a catalyst for renewed institutional interest, analysts emphasize balanced expectations. “The market structure is improving, but risks remain—both from macro volatility and the possibility that ETF-driven demand is partially priced in,” noted a senior ETF strategist.

For now, attention centers on EZRP’s debut on November 18 and Bitwise’s follow-up launch, as XRP’s ability to stabilize near $2 will determine whether renewed institutional liquidity translates into meaningful price action.

Source link

20 11, 2025

METABORA GAMES Forms Strategic Partnership with NEOSTELLAGAMES To Co-Develop and Launch Web3 Games

By |2025-11-20T08:50:28+02:00November 20, 2025|News, NFT News|0 Comments


  • A strategic partnership with NEOSTELLAGAMES, a mobile game studio with strong global live-service capabilities
  • Co-developing a casual roguelike RPG for the global Web3 market with an H5 title
  • Enhancing BORA token utility through payment, rewards, and onboarding collaboration

SEOUL, South Korea, Nov. 20, 2025 /PRNewswire/ — METABORA GAMES (CEO Choi Se-hoon), a leading blockchain game developer, announced today that it has signed a partnership with NEOSTELLAGAMES (CEO Kim Tae-Kyun) to co-develop and globally launch a Web3 game built on HTML5 (H5).

NEOSTELLAGAMES is a mobile game studio founded by developers who have led a wide range of projects at major global companies including Line Play, Disney Interactive, and NCSOFT. The studio has extensive experience in commercial game development and global live service operations, and has built strong expertise in the casual and idle RPG genres. With additional experience in Web3 game development, the company has also secured capabilities for next generation hybrid game production.

Through this partnership, the two companies will collaborate on the launch of a next generation Web3 title that combines H5 accessibility with a Web3-driven, targeting for the global H5 game market. NEOSTELLAGAMES will lead development and live service operations for a casual roguelike RPG Web3 game, while METABORA GAMES will support tokenomics design optimized for synergy with the BORA ecosystem, along with global Web3 marketing and user engagement systems.

The new title jointly developed by the two companies will support in-app payments that allow players to purchase in game items using the BORA token. The game is also planned to introduce a gas abstraction feature, enabling players to pay gas fees with BORA even without holding KAIA tokens.

METABORA GAMES has been actively pursuing external collaborations to secure H5 based Web3 game titles. Through this onboarding partnership with NEOSTELLAGAMES, the company plans to expand its global lineup of H5 based Web3 games, strengthen the utility of the BORA token, and accelerate the growth of its ecosystem.

A representative from METABORA stated that the company will continue to expand its portfolio of H5 based titles across various genres, increase real use cases for the BORA token, and further enhance user engagement. 

About METABORA

METABORA is a casual game developer and the service operator of the blockchain platform BORA.

The BORA ecosystem brings together partners across various industries—ranging from tokenomics and content to blockchain technology—driving innovation and collaboration across games, sports, and entertainment.

BORA is a national game/entertainment token with a high liquidity in the market and reinforcing the accessibility of users and services abroad by increasing the listing on global cryptocurrency exchanges and expanding partnership.

SOURCE METABORA GAMES


Source link

20 11, 2025

USD/JPY forecast: 52-week high breakout imminent?

By |2025-11-20T08:29:57+02:00November 20, 2025|Forex News, News|0 Comments

USD/JPY overview: Relentless strength still dominant

USDJPY continues to command the FX market with a powerful bullish trend. The yen remains heavily pressured as Japan sits on the extreme end of global monetary policy, maintaining near-zero rates while the rest of the world stays significantly tighter. This alone has kept USDJPY elevated for most of the year.

The recent push into the upper 157s shows the same pattern we’ve seen for weeks — strong impulsive legs with shallow corrections. While this speaks to persistent demand for USDJPY, it also raises the question: is a deeper retracement due before a breakout attempt on the 52-week high?

Main driver behind USD/JPY’s strength

The core engine behind USDJPY’s climb remains policy divergence — and that gap continues to widen.

1. Bank of Japan’s ultra-dovish stance

The BoJ still refuses to shift away from accommodative policy. Despite inflation fluctuations, the central bank avoids decisive tightening, keeping Japanese yields pinned close to zero. This anchors the yen as the funding currency of global markets and makes it structurally weak.

2. Stable US yields and sticky inflation

While the Federal Reserve isn’t aggressively tightening, it’s also not cutting quickly. US yields remain elevated, and inflation remains sticky enough to prevent early dovish shifts. This keeps the dollar attractive compared to the yen.

3. Capital flows into USD assets

Global investors continue rotating capital into higher-yielding U.S. instruments. This flow naturally supports USDJPY and compounds the yen’s underperformance.

The result is a pair that remains fundamentally bullish until one side of the divergence changes — and so far, neither has.

USD/JPY price action narrative

USDJPY has been in a clean and aggressive uptrend with very limited pullbacks. Price is now sitting just under the 52-week high at 158.87, trading inside a premium zone where rallies typically slow down.

Candles continue to show momentum but also early signals of exhaustion — long wicks near the highs, smaller bodies, and stretched displacement. Beneath current price lies a natural re-pricing zone between 155.735 and 156.877, where the market may correct before setting up the next move.

This zone becomes the key battleground for continuation or reversal.

Technical outlook

Narrative of the technical structure

The higher-timeframe trend remains clearly bullish. But price is overextended, and a healthy retracement would restore balance. The 155.70–156.80 zone is the nearest and cleanest support area for discount entries.

Until that zone is retested, upside breakouts may lack sustainability.

Bullish scenario: Dip first, then breakout

The bullish path anticipates a structured correction before buyers re-enter with conviction.

Requirements:

  • Retracement into 155.70–156.80
  • Bullish rejection from this zone
  • Formation of a higher low
  • Break above recent short-term highs

Upside targets:

  • 158.00
  • 158.87 (52-week high)
  • 159.50 if momentum persists

A strong reaction from the support zone supports continuation.

Bearish scenario: Failure at the highs, breakdown of support

If USDJPY keeps rejecting the highs and fails to find support in the imbalance zone, a deeper correction could unfold.

Requirements:

  • Rejection from 158.00–158.80
  • Breakdown below 155.735
  • Lower high forming beneath 156.80

Downside targets:

A loss of structure below 155.70 opens the door for broader downside.

Final thoughts

USDJPY stays firmly bullish, but the rally is extended. With the 52-week high just overhead, the market may need a reset before attempting a decisive breakout. The 155.70–156.80 zone is the key technical area to monitor — a bounce there maintains the trend, while a breakdown signals deeper correction.

If the BoJ remains dovish and U.S. yields stay firm, the bias still leans bullish. But no trend climbs in a straight line. A healthy pullback may be the final ingredient before the next major move.

Source link

20 11, 2025

Food Supplement Market is expected to reach US$ 345.13 billion

By |2025-11-20T08:15:44+02:00November 20, 2025|Dietary Supplements News, News|0 Comments


Food Supplement Market

Market Size and Growth:

The Food Supplement Market Size reached US$ 203.10 billion in 2024 and is expected to reach US$ 345.13 billion by 2031, growing with a CAGR of 8.4% during the forecast period 2025-2031. The Market is growing due to rising health awareness, increased adoption of preventive healthcare, and higher demand for personalized nutrition and immunity-boosting supplements. According to DataM Intelligence Report.

Get a Free Sample Research PDF: https://datamintelligence.com/download-sample/food-supplement-market?sz

The Food Supplement Market refers to the industry producing vitamins, minerals, proteins, herbal extracts, and other nutraceutical products that support overall health, improve nutritional intake, and address specific wellness needs. It includes dietary tablets, capsules, powders, functional foods, and beverages designed to enhance immunity, energy, digestion, and performance, driven by rising health awareness and preventive healthcare trends.

Industry Recent Developments: United States

✅ August 2025: Expansion of e-commerce and online supplement sales has increased accessibility to dietary supplements, with particular popularity growth in powdered supplements and plant-based ingredients.

✅ September 2025: There is a rising interest in personalized nutrition, including AI-powered personalized nutrition services, alongside continued growth in natural, organic, and plant-based supplements. Fortified protein and amino acid supplements designed for seniors to combat sarcopenia were introduced.

✅ October 2025: A new line of plant-based botanical supplements targeting immune health and anti-aging was launched, gaining rapid market traction. Additionally, mergers and partnerships focused on omega fatty acid extraction and fermented food supplements occurred.

Industry Recent Developments: Japan

✅ August 2025: FANCL Corporation gained marketing authorization for a new probiotic strain clinically proven to support gastrointestinal health.

✅ September 2025: Meiji Holdings introduced fortified protein and amino acid supplements specifically formulated for seniors to address sarcopenia and improve quality of life. Also, Yotsuba Japan acquired a domestic nutraceutical firm specializing in omega fatty acid extraction.

✅ October 2025: FANCL Corporation launched a new line of plant-based botanical supplements targeting immune health and anti-aging that gained rapid market traction. Asahi Group Foods entered a strategic partnership with Nihon Kefir Co., Ltd. to co-develop novel fermented food supplements for urinary and vaginal health.

Get Customization in the report as per your requirements: https://datamintelligence.com/customize/food-supplement-market?sz

Major Key Players:

1. Amway

A global leader in nutritional supplements with strong direct-selling distribution. Its Nutrilite brand drives large-scale revenues across vitamins, minerals, and herbal products.

2. Abbott Laboratories

A diversified healthcare company offering advanced nutritional products backed by clinical research. Its strong global presence enhances trust and market penetration.

3. Bayer AG

A pharmaceutical and life sciences giant with a broad portfolio in health and nutrition. Bayer leverages innovation and R&D strength to expand its supplement offerings.

4. Pfizer Inc.

A top pharmaceutical leader providing high-quality vitamins and wellness formulations. Its trusted brand and global footprint support strong consumer adoption.

5. Glanbia Plc

A prominent nutrition company known for performance and lifestyle nutrition brands. It excels in sports nutrition and functional supplements with strong manufacturing capabilities.

6. Haleon Plc

A consumer health company with powerful brands in vitamins, minerals, and supplements. It focuses on science-backed products and strong retail reach worldwide.

Market Growth Drivers:

✅ Rising Health Awareness and Preventive Healthcare Focus: Increasing consumer consciousness about health, wellness, and preventive care has led to higher demand for supplements that support overall well-being and help manage chronic diseases such as obesity, diabetes, and heart conditions.

✅ Growing Aging Population: The aging global population drives demand for supplements targeting age-related health issues like joint health, cognitive function, and bone density, contributing significantly to market growth.

✅ Advances in Technology and Product Innovation: Technological improvements in ingredient extraction, formulation, and personalized nutrition solutions (including AI-driven personalization) enhance supplement efficacy, bioavailability, and consumer appeal, propelling market expansion.

Segments Covered in the Food Supplement Market:

By Ingredient: Vitamins, Vitamins, Botanicals, Minerals, Proteins and Amino Acids, Omega Fatty Acids, Others.

By Form: Tablet, Capsules, Soft Gels, Powders, Liquids, Others.

By Application: Energy and Weight Management, General Health, Bone and Joint Health, Gastrointestinal Health, Immunity, Cardiac Health, Diabetes, Others.

By End-User: Adults, Geriatric, Pregnant Women, Children, Infants.

By Distribution Channel: Offline, Online.

Regional Analysis for Food Supplement Market:

⇥ North America (U.S., Canada, Mexico)

⇥ Europe (U.K., Italy, Germany, Russia, France, Spain, The Netherlands and Rest of Europe)

⇥ Asia-Pacific (India, Japan, China, South Korea, Australia, Indonesia Rest of Asia Pacific)

⇥ South America (Colombia, Brazil, Argentina, Rest of South America)

⇥ Middle East & Africa (Saudi Arabia, U.A.E., South Africa, Rest of Middle East & Africa)

Buy Now & Get 30% OFF – Grab 50% OFF on 2+ reports: https://www.datamintelligence.com/buy-now-page?report=food-supplement-market

Chapter Outline:

⏩ Market Overview: It contains five chapters, as well as information about the research scope, major manufacturers covered, market segments, Food Supplement market segments, study objectives, and years considered.

⏩ Market Landscape: The competition in the Global Food Supplement Market is evaluated here in terms of value, turnover, revenues, and market share by organization, as well as market rate, competitive landscape, and recent developments, transaction, growth, sale, and market shares of top companies.

⏩ Companies Profiles: The global Food Supplement market’s leading players are studied based on sales, main products, gross profit margin, revenue, price, and growth production.

⏩ Market Outlook by Region: The report goes through gross margin, sales, income, supply, market share, CAGR, and market size by region in this segment. North America, Europe, Asia Pacific, Middle East & Africa, and South America are among the regions and countries studied in depth in this study.

⏩ Market Segments: It contains the deep research study which interprets how different end-user/application/type segments contribute to the Food Supplement Market.

⏩ Market Forecast: Production Side: In this part of the report, the authors have focused on production and production value forecast, key producers forecast, and production and production value forecast by type.

⏩ Research Findings: This section of the report showcases the findings and analysis of the report.

⏩ Conclusion: This portion of the report is the last section of the report where the conclusion of the research study is provided.

Unlimited Insights. One Subscription: https://www.datamintelligence.com/reports-subscription

Frequently asked questions:

➠ What is the global sales value, production value, consumption value, import and export of Food Supplement market?

➠ Who are the global key manufacturers of the Food Supplement Industry? How is their operating situation (capacity, production, sales, price, cost, gross, and revenue)?

➠ What are the Food Supplement market opportunities and threats faced by the vendors in the global Food Supplement Industry?

➠ Which application/end-user or product type may seek incremental growth prospects? What is the market share of each type and application?

➠ What focused approach and constraints are holding the Food Supplement market?

➠ What are the different sales, marketing, and distribution channels in the global industry?

Contact Us –

Company Name: DataM Intelligence

Contact Person: Sai Kiran

Email: Sai.k@datamintelligence.com

Phone: +1 877 441 4866

Website: https://www.datamintelligence.com

About Us –

DataM Intelligence is a Market Research and Consulting firm that provides end-to-end business solutions to organizations from Research to Consulting. We, at DataM Intelligence, leverage our top trademark trends, insights and developments to emancipate swift and astute solutions to clients like you. We encompass a multitude of syndicate reports and customized reports with a robust methodology.

Our research database features countless statistics and in-depth analyses across a wide range of 6300+ reports in 40+ domains creating business solutions for more than 200+ companies across 50+ countries; catering to the key business research needs that influence the growth trajectory of our vast clientele.

This release was published on openPR.


Source link

20 11, 2025

Solana Price Prediction: SOL Leads Market Recovery as Bulls Target the $180–$200 Rebound Zone

By |2025-11-20T08:13:29+02:00November 20, 2025|Crypto News, News|0 Comments

Solana price is showing renewed strength, rebounding sharply from key support as participants watch for signs of a broader trend reversal.

Solana price is starting to stand out again, breaking away from the broader market slowdown with a sharp push back into strength. After days of pressure, buyers are finally stepping in with confidence.

Solana Price Showing Stronger Recovery Momentum

Solana Price is leading the broader crypto rebound, posting one of the strongest 24-hour recoveries among top assets. Momentum has shifted firmly back into green territory, with price climbing more than 7% while most majors still lag behind. This kind of relative strength often signals early rotation, especially when a coin begins reclaiming levels quicker than the rest of the market.

Solana’s strong 24-hour rebound places it among the market’s top performers. Source: The Solana Floor via X

The move above $140 also aligns with the start of a broader sentiment recovery after weeks of sustained selling pressure. With SOL climbing the leaderboard again, The Solana Floor is beginning to reassess whether this could mark the early stages of a momentum reset.

Technical & On-Chain Signals Lean Bullish

On-chain data and chart structure both point towards $130 acting as a potential cyclical bottom. The zone has shown reactive buying multiple times, while intraday liquidity sweeps have failed to produce continuation to the downside, often an early sign of exhaustion among sellers.

Solana Price Prediction: SOL Leads Market Recovery as Bulls Target the 0–0 Rebound Zone

Solana’s on-chain strength and repeated reactions from the $130 zone signal a potential cyclical bottom forming. Source: Cointelegraph via X

The on-chain metrics add conviction: network volumes remain elevated, staking activity continues rising, and long-term holder accumulation is strengthening. This blend of technical support + improving on-chain sentiment increases the probability of a recovery towards the $180–$200 region if momentum extends.

Bullish Divergences Forming Into Higher Levels

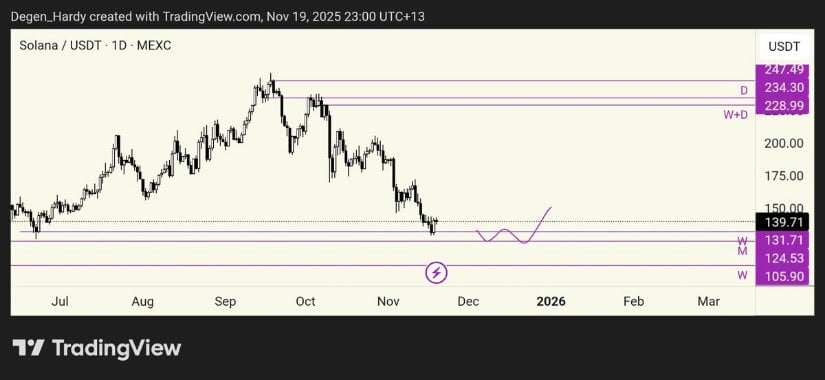
Hardy’s chart highlights a developing daily bullish divergence, with price forming lower lows while RSI begins to curl upward. This type of structure often appears near local bottoms.

Technically, the next reaction zones sit at $150, $175, and the major reclaim level at $200. The drawn projection suggests a rounded bottom forming between $132 to $139, which, if confirmed, typically transitions into a mid-trend reversal.

As long as Solana price defends the support wick region around $135, the divergence setup remains valid.

Bullish Divergences Forming Into Higher Levels

SOL’s chart captures a clean bullish divergence developing on the daily timeframe, hinting at a potential mid-trend reversal. Source: Hardy via X

SOL Strengthening Against ETH and BNB

Crypto analyst TraderSZ believes that SOL’s performance relative to ETH and BNB is beginning to show early signs of rotation. The ratio chart has bounced from a multi-month floor and is attempting to reclaim its immediate resistance band.

SOL Strengthening Against ETH and BNB

Solana’s ratio charts against ETH and BNB are rebounding from a multi-month floor, hinting at early rotational strength. Source: TraderSZ via X

A move above 0.046–0.047 on the SOL/ETH pair would confirm the start of a new dominance leg. Meanwhile, the SOL/BNB structure shows a similar early recovery, indicating that SOL may be gearing up to outperform majors if momentum continues.

Major Liquidity Cluster Observed Between $170–$200

Heatmap data shared by TED shows that most downside liquidity has already been cleared out during the recent selloff, an important structural shift. Above current price, the next dense cluster sits in the $170 to $200 region, meaning that any upside continuation is likely to gravitate toward this zone.

Major Liquidity Cluster Observed Between $170–$200

Heatmap data reveals a heavy liquidity pocket between $170 and $200, acting as the key upside magnet for SOL. Source: TED via X

This range contains heavy resting orders, previous inefficiencies, and major stop-loss pockets, making it the first meaningful upside magnet once SOL stabilizes above the lower range. If markets show even a mild rebound, liquidity mechanics alone could pull SOL towards these levels.

Final Thoughts

Solana’s latest rebound shows a shift in both technicals and market sentiment. The $130–$140 zone continues to act as strong structural support, on-chain data points towards accumulation, divergences are forming, and liquidity above price is stacked in the $170–$200 band.

If buyers maintain control above support and Solana price continues outperforming majors, a move back to the $180 to $200 region becomes increasingly realistic. For now, the recovery is still early, but the structure for a broader trend reversal is finally aligning.


Source link

Go to Top