Tea Bags Market Forecast and Outlook 2025 to 2035
The global tea bags market is set to grow from USD 7.69 billion in 2025 to USD 14.59 billion by 2035, adding USD 6.90 billion in new revenue and advancing at a CAGR of 6.6%. Growth is driven by rising health consciousness, increasing preference for convenient beverage solutions, and expanding retail infrastructure across emerging economies seeking accessible hot beverage consumption alternatives. Tea bags are increasingly recognized as efficient brewing methods in modern lifestyles, offering superior convenience, portion control accuracy, and time savings compared to traditional loose leaf preparation.
Quick Stats for Tea Bags Market
- Tea Bags Market Value (2025): USD 7.69 billion
- Tea Bags Market Forecast Value (2035): USD 14.59 billion
- Tea Bags Market Forecast CAGR: 6.6%
- Leading Type in Tea Bags Market: Black Tea
- Key Growth Regions in Tea Bags Market: Asia Pacific, North America, and Europe
- Top Players in Tea Bags Market: Koehler Paper, Parkside, Elevate Packaging, Dongguan Yupu Packaging, Sikri Packaging
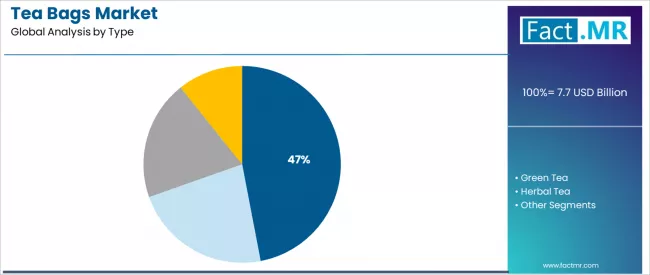
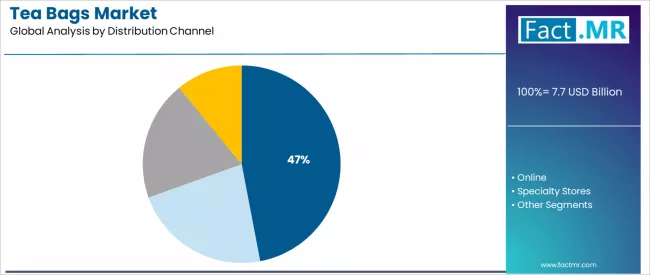
Black tea holds a 47.0% share in 2025, favored in daily consumption environments for its robust flavor profile, established brand presence, and broad demographic appeal addressing diverse consumer taste preferences and cultural tea-drinking traditions. Hypermarkets and supermarkets represent 47.0% of distribution channels and remain essential in mainstream retail environments where product visibility, promotional activities, and brand assortment match consumer shopping convenience requirements and bulk purchasing preferences.
Distribution dynamics reveal hypermarkets and supermarkets maintaining 47.0% channel dominance through established retail footprints, promotional capabilities, and comprehensive product assortment that enable consumer discovery and repeat purchasing across diverse demographic segments. Online channels expand rapidly as e-commerce platforms improve accessibility, subscription models gain acceptance, and digital-native brands capture younger consumer segments seeking specialty tea varieties and premium product positioning.
Asia Pacific leads regional growth with 7.3% CAGR, supported by traditional tea consumption cultures, expanding middle-class populations, and modern retail infrastructure development in China and India that create substantial demand for convenient tea formats. North America demonstrates steady development at 6.5% CAGR through established wellness trends, specialty tea adoption, and premiumization strategies, while Europe advances at 6.2% CAGR driven by organic tea consumption growth, sustainable packaging innovation, and afternoon tea cultural heritage.
From 2025-2030, the market will witness an incline from USD 7.69 billion to approximately USD 10.66 billion, adding USD 2.97 billion in value, which constitutes 43% of the total forecast growth period. This phase will be characterized by the continued dominance of black tea varieties in established markets, combined with accelerating adoption of specialty tea bags including herbal, green, and wellness-focused blends where functional benefits address consumer health priorities and preventive wellness approaches.
Manufacturers will concentrate on packaging sustainability optimization, material biodegradability enhancement, and retail distribution expansion in underserved regional territories where tea bag adoption remains aspirational for convenience-seeking consumers.
Compostable filter materials, plastic-free packaging, and transparent sourcing documentation will become standard industry requirements rather than premium differentiators as mainstream brands respond to environmental consciousness and circular economy expectations.
From 2030-2035, the market will witness sustained expansion from USD 10.66 billion to USD 14.59 billion, representing an addition of USD 3.93 billion or 57% of the decade’s growth. This period will be defined by the broadening acceptance of premium specialty tea bags beyond traditional black tea segments, integration of innovative brewing technologies across mainstream product lines, and strengthened direct-to-consumer channels in previously retail-dominated markets.
Where revenue comes from – Now Vs Next (industry-level view)
| Period |
Primary Revenue Buckets |
Share |
Notes |
| Today |
Black tea |
47% |
Traditional consumption |
| Hypermarkets & supermarkets |
47% |
Mainstream retail |
| Household consumption |
65% |
Domestic brewing |
| Green tea |
22% |
Health positioning |
| Specialty blends |
18% |
Premium segments |
| Asia Pacific markets |
30% |
Cultural heritage |
| North America markets |
32% |
Wellness trends |
| Future (3-5 yrs) |
Black tea varieties |
44-48% |
Sustained preference |
| Specialty tea platforms |
24-28% |
Functional benefits |
| Online channels |
28-32% |
Subscription models |
| Household premium |
70-74% |
Quality upgrading |
| Sustainable packaging |
55-60% |
Environmental focus |
| Asia Pacific growth |
32-36% |
Middle-class expansion |
| Organic variants |
20-25% |
Clean label demand |
Tea Bags Market Key Takeaways
At-a-Glance Metrics
| Metric |
Value |
| Market Value (2025) → |
USD 7.69 billion |
| Market Forecast (2035) ↑ |
USD 14.59 billion |
| Growth Rate ★ |
6.6% CAGR |
| Leading Type → |
Black Tea |
| Primary Distribution → |
Hypermarkets & Supermarkets |
The market demonstrates solid fundamentals with black tea capturing a commanding 47% share through established consumption patterns and diverse flavor profiles that deliver taste satisfaction and cultural familiarity capabilities. Hypermarkets and supermarkets drive primary distribution at 47% share, supported by established retail infrastructure and promotional visibility that maintain consumer accessibility across mainstream shopping segments. Geographic concentration reveals Asia Pacific’s robust growth trajectory with 7.3% CAGR and expanding modern retail ecosystems, while North America maintains significant market presence driven by wellness positioning and specialty tea adoption in health-conscious consumer segments.
Imperatives for Stakeholders in Tea Bags Market
Design for sustainability, not just convenience
- Offer complete sustainable solutions: biodegradable materials + plastic-free packaging + compostable filters + transparent sourcing + carbon footprint documentation.
- Preconfigured consumption profiles: traditional black tea specifications, wellness blend configurations, specialty tea packages, and organic variety portfolios for consumer satisfaction.
Regulatory readiness for packaging transitions
- Real-time sustainability monitoring systems, packaging certification documentation, and supply chain transparency (material traceability, manufacturing standards, biodegradability protocols).
Quality-by-design approach
- Premium tea sourcing, flavor consistency optimization, freshness preservation technologies, and transparent origin documentation.
Omnichannel distribution penetration
- Clear retail expansion strategies + established channel partnerships (hypermarkets, specialty stores, online platforms); direct-to-consumer models for brand engagement and subscription relationship development.
Segmental Analysis
The market segments by tea type into black tea, green tea, herbal tea, and specialty blends, representing the evolution from traditional consumption patterns toward health-focused varieties and functional beverage applications requiring specific flavor profiles and wellness positioning. The distribution channel segmentation divides the market into hypermarkets and supermarkets (47%), online channels, specialty stores, and convenience retail, reflecting distinct consumer priorities for shopping convenience and promotional accessibility versus specialty curation and subscription convenience.
The end-use segmentation reveals household consumption’s commanding 65% dominance, followed by foodservice and hospitality applications, demonstrating varied consumption occasions and brewing convenience requirements. The regional segmentation reveals Asia Pacific’s exceptional 7.3% CAGR growth momentum, followed by North America at 6.5% and Europe at 6.2%, demonstrating varied tea consumption cultures, retail infrastructure maturity levels, and health awareness progression stages.
By Type, Which Tea Bags Category is the Most Demanded?

Black tea bags command the leading position in the tea bags market with a 47% market share through established consumption traditions, including robust flavor characteristics, caffeine content appeal, and versatile preparation methods that enable consumers to achieve satisfying beverage experiences across varied demographic groups and cultural tea-drinking applications.
The segment benefits from consumer familiarity with traditional tea flavors that provide consistent taste profiles, morning energy requirements, and cultural heritage connections without requiring specialized brewing knowledge or equipment investments. Advanced processing technologies enable flavor optimization, aroma preservation, and quality consistency for diverse tea bag formats, where taste reliability and brand loyalty represent critical consumer requirements.
Premium black tea variants including Earl Grey, English Breakfast, and Assam blends command substantial share within the segment, appealing to consumers seeking elevated taste experiences and brand heritage associations. Black tea varieties differentiate through proven flavor profiles, extensive brand portfolios, and integration with established consumption rituals that enhance consumer satisfaction while maintaining optimal quality standards for diverse preparation methods and consumption occasions.
Key market characteristics:
- Advanced processing technology with optimized oxidation levels and flavor development capabilities
- Superior brewing convenience, enabling consistent flavor extraction with simple preparation and reliable taste outcomes
- Cultural tradition compatibility, including breakfast rituals, afternoon tea ceremonies, and social consumption patterns for mainstream market adoption
Why do Hypermarkets & Supermarkets Represent an Important Distribution Channel?
Hypermarkets and supermarkets maintain a substantial position, with a 47% share due to their comprehensive product assortment and mainstream retail accessibility characteristics. These channels appeal to convenience-seeking consumers and regular purchasers requiring visible product placement with promotional pricing opportunities, offering extensive brand selection and bulk purchasing options through organized retail environments.
Market dominance is driven by established shopping patterns, emphasizing accessible retail locations and integrated grocery purchasing where tea bags represent routine household items alongside other beverage and food products.
How does Household Consumption Shape End-Use Preferences in Tea Bags?
Household consumption demonstrates end-use leadership in the tea bags market with a 65% share due to widespread home brewing patterns and sustained focus on convenience preparation, daily consumption rituals, and cost-effective beverage solutions that maximize household value while maintaining acceptable taste quality standards.
Consumers prioritize preparation simplicity, portion control accuracy, and integration with morning routines and relaxation moments that enable consistent beverage enjoyment across diverse household settings. The segment benefits from work-from-home trends and in-home entertainment patterns that emphasize household tea consumption for daily refreshment and wellness beverage applications. Multi-pack formats capture significant share within the household segment, demonstrating consumer preference for value purchasing and inventory management.
Wellness awareness programs incorporate tea consumption as standard health practices for antioxidant intake, while convenience priorities increase demand for ready-to-brew formats that minimize preparation complexity and deliver consistent quality experiences.
What drives Green Tea Adoption in Health-Conscious Segments?
Green tea captures 22% market share through comprehensive wellness positioning in antioxidant delivery, metabolism support benefits, and traditional medicine heritage. These varieties demand careful processing methods capable of maintaining polyphenol content while providing delicate flavor characteristics and health functionality claims, appealing to health-conscious consumers and preventive wellness practitioners seeking evidence-based beverage benefits.
What Establishes Asia Pacific’s Market Leadership in Tea Bags?
Asia Pacific establishes market leadership in the tea bags sector with exceptional 7.3% CAGR due to comprehensive tea consumption culture and sustained focus on convenience adoption, urbanization acceleration, and modern retail expansion that maximizes product accessibility while maintaining traditional beverage heritage standards.
Consumers and manufacturers prioritize convenience integration with cultural tea traditions, modern lifestyle compatibility, and alignment with established hot beverage consumption patterns that enable coordinated market development across multiple national jurisdictions.
The region benefits from substantial tea production infrastructure and retail modernization investments that emphasize the development of convenient tea formats for urban commuter applications and household consumption requirements.
Retail infrastructure programs incorporate modern grocery formats as standard urban development considerations for consumer convenience, while rising middle-class populations increase demand for packaged beverage products that meet quality expectations and minimize preparation time requirements.
Regional dynamics include:
- Strong growth in Chinese markets with expanding convenience preferences requiring modern tea formats for urban lifestyle integration
- Increasing adoption in Indian markets for packaged tea solutions and organized retail channel development
- Rising consumption in Southeast Asian economies for convenient beverage formats and modern retail penetration
What are the Drivers, Restraints, and Key Trends of the Tea Bags Market?
| Category |
Factor |
Impact |
Why It Matters |
| Driver |
Health consciousness & wellness trends (antioxidant benefits, functional beverages) |
★★★★★ |
Consumer preference shifting toward natural wellness beverages drives tea bag adoption; manufacturers providing functional tea blends gain competitive advantage in health-focused market segments. |
| Driver |
Convenience demand & lifestyle changes (single-serve formats, quick preparation) |
★★★★★ |
Modern urban lifestyles require efficient beverage solutions; tea bag convenience positioning enables market expansion across time-constrained consumer demographics and workplace environments. |
| Driver |
Retail infrastructure expansion & organized retail growth (hypermarket penetration, brand visibility) |
★★★★☆ |
Emerging market retail modernization drives packaged tea adoption; organized retail channels providing promotional support expand addressable markets beyond traditional loose leaf consumption. |
| Restraint |
Loose leaf tea preference & quality perception (authentic experience, premium positioning) |
★★★☆☆ |
Traditional tea enthusiasts resist tea bag adoption; quality perception challenges affect premium segment penetration and limit market expansion in connoisseur demographics. |
| Restraint |
Packaging sustainability concerns & plastic microplastics (environmental impact, material criticism) |
★★★★☆ |
Environmental activists criticize conventional tea bag materials; sustainability requirements increase development costs and affect brand reputation in environmentally-conscious segments. |
| Trend |
Sustainable packaging innovation & compostable materials (biodegradable filters, plastic-free solutions) |
★★★★★ |
Growing consumer expectation for environmental responsibility beyond conventional packaging; sustainability positioning becomes core differentiation strategy for premium brand access. |
| Trend |
Specialty tea growth & premium blends (herbal varieties, functional ingredients, organic certification) |
★★★★☆ |
Tea consumption evolving beyond commodity beverage toward lifestyle wellness product; specialty positioning drives higher margins and brand loyalty in affluent demographics. |
Analysis of the Tea Bags Market by Key Countries
The tea bags market demonstrates robust regional growth dynamics with emerging leaders including China (7.5% CAGR) and India (7.0% CAGR) driving expansion through urbanization acceleration and modern retail penetration. Strong Performers encompass USA (6.4% CAGR), Brazil (6.3% CAGR), and Japan (6.2% CAGR), benefiting from established beverage consumption patterns and wellness trend adoption. Developed Markets feature UK (6.1% CAGR) and Germany (6.0% CAGR), where tea culture heritage and sustainable packaging innovation support consistent growth patterns.
Regional synthesis reveals Asian markets leading adoption through comprehensive urban lifestyle transformation and convenience preference acceleration, while Western countries demonstrate measured growth potential supported by specialty tea expansion and organic product positioning. European markets show solid development driven by sustainability standards and traditional tea culture preservation.
| Region/Country |
2025 to 2035 Growth |
How to win |
What to watch out |
| China |
7.5% |
Focus on convenience positioning for urban consumers |
Traditional loose leaf preference; cultural resistance |
| India |
7.0% |
Lead with affordable quality tea solutions |
Unorganized retail dominance; price sensitivity |
| USA |
6.4% |
Provide specialty wellness blend innovation |
Coffee culture competition; market maturity |
| Brazil |
6.3% |
Offer localized flavor adaptations |
Economic volatility; regional taste preferences |
| Germany |
6.0% |
Push organic certification excellence |
Sustainability cost pressure; regulatory complexity |
| UK |
6.1% |
Deliver heritage brand premium positioning |
Market saturation; discount competition |
| Japan |
6.2% |
Maintain quality consistency standards |
Green tea loose leaf tradition; demographic aging |
What is the Outlook for the Tea Bags Market in China?
China establishes fastest market growth through progressive urbanization programs and comprehensive convenience adoption, positioning tea bags as practical brewing solutions in modern office environments and household consumption applications. The country’s 7.5% growth rate reflects lifestyle transformation supporting packaged tea formats and expanding modern retail infrastructure that encourages the deployment of convenient products in diverse urban settings.
Growth concentrates in major metropolitan areas, including Shanghai, Beijing, and Guangzhou, where urban professionals showcase increasing preference for convenient beverage solutions that appeal to time-constrained consumers demanding quality maintenance and preparation simplicity.
Chinese tea bag manufacturers are developing products that balance traditional tea quality expectations with modern convenience requirements, including retail distribution expansion and e-commerce platform integration strategies. Supply chain development through organized retail networks and online marketplace partnerships expand market access, while product innovation initiatives support development across diverse tea varieties and flavor preference segments.
What is India’s Outlook in the Global Tea Bags Market?
In Mumbai, Delhi, and Bangalore regions, urban consumers and working professionals are adopting tea bags as convenient brewing alternatives for workplace and household applications, driven by increasing organized retail penetration and modern lifestyle preferences that emphasize the importance of time-efficient beverage preparation.
The market holds a 7.0% growth rate, supported by retail infrastructure modernization programs and brand marketing investments that promote packaged tea formats for urban applications. Indian consumers are favoring products that provide consistent quality and convenient preparation, particularly appealing in metropolitan markets where time scarcity and workplace consumption represent critical purchasing priorities.
Market expansion benefits from massive retail modernization infrastructure and brand distribution capabilities that enable domestic development of quality-competitive tea bag platforms for urban applications. Consumer adoption follows patterns established in packaged food trends, where convenience positioning and brand trust drive purchasing decisions and category acceptance patterns.
How is the Tea Bags Market in the USA Expanding?
The USA establishes wellness market leadership through comprehensive health trend adoption and established specialty tea positioning, integrating tea bags across household consumption occasions, workplace beverage programs, and wellness routine applications. The country’s 6.4% growth rate reflects sophisticated consumer health awareness and functional beverage preferences that support widespread deployment of specialty tea platforms in premium applications.
Growth concentrates in established markets, including California, New York, and Texas, where health-conscious consumers showcase advanced wellness knowledge that appeals to preventive health practitioners seeking functional beverage benefits and natural ingredient transparency.
American tea brands leverage established retail distribution networks and comprehensive digital marketing capabilities, including influencer partnerships and wellness community engagement that create brand awareness and trial conversion patterns. The market benefits from mature e-commerce infrastructure and subscription model acceptance that encourage specialty tea discovery while supporting organic certification and functional ingredient positioning.
How is Brazil likely to Expand in the Global Tea Bags Market?
Brazil establishes robust beverage diversification momentum through progressive consumer preference evolution and emerging tea culture development, integrating tea bags across urban household networks and modern retail environments. The country’s 6.3% growth rate reflects growing beverage variety appreciation and increasing adoption of international beverage formats that supports expanding tea bag deployment in Brazilian markets.
Growth concentrates in major metropolitan regions, including São Paulo, Rio de Janeiro, and Brasília, where cosmopolitan consumers showcase demand for diverse beverage options that appeal to health-conscious demographics seeking natural alternatives with functional benefits accessibility.
Brazilian retailers focus on product education and consumption occasion positioning, creating demand for convenient tea formats that combine international quality standards with Brazilian taste preferences. The market benefits from expanding organized retail infrastructure and growing health awareness that support tea adoption while maintaining price positioning important to Brazilian economic conditions.
How will Germany provide Opportunities for Growth?
Germany’s advanced organic market demonstrates sophisticated tea consumption with documented quality excellence in organic certification and sustainable packaging through premium retail distribution channels and specialized organic store networks. The country leverages environmental consciousness and food quality standards to maintain a 6.0% growth rate.
Consumer centers, including Bavaria, North Rhine-Westphalia, and Baden-Württemberg, showcase sustainability-oriented consumption where tea bags integrate with established organic food preferences and environmental expectations to optimize packaging sustainability and ensure ingredient traceability maintenance.
German consumers prioritize organic certification and sustainable sourcing in tea purchasing, creating demand for environmentally validated platforms with comprehensive documentation characteristics, including origin verification, fair trade compliance, and compostable packaging materials. The market benefits from established organic consumer segments and environmental awareness patterns that provide premium positioning opportunities and compliance with strict European sustainability regulations.
How does the UK demonstrate Heritage Brand Leadership?
UK’s tea market demonstrates sophisticated cultural integration with documented effectiveness in afternoon tea traditions and premium blend development through established retail channels and heritage brand networks. The country maintains a 6.1% growth rate, leveraging traditional tea culture and contemporary specialty variety adoption in beverage consumption. Consumer centers, including London, Manchester, and Edinburgh, showcase premium tea positioning where tea bags integrate with cultural heritage patterns and modern wellness trends to optimize flavor quality and maintain brand tradition standards under evolving consumer preferences.
Consumers prioritize brand heritage and flavor authenticity in tea purchasing decisions, creating demand for quality-established platforms with proven taste characteristics, including traditional blend formulations combined with contemporary specialty varieties and organic options. The market benefits from established tea culture infrastructure and brand loyalty patterns that provide premium positioning opportunities and compliance with UK food quality frameworks.
How does Japan demonstrate Quality Consistency Integration?
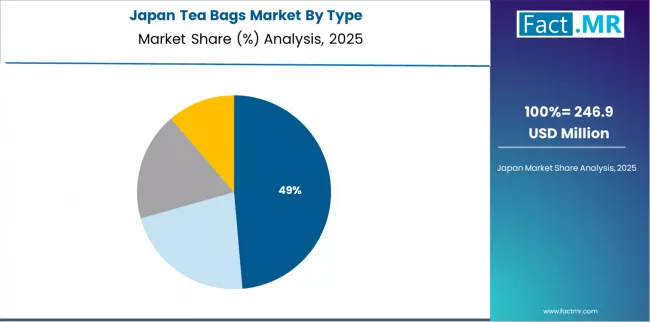
Japan’s advanced beverage market demonstrates established tea consumption culture with documented precision in quality standards and flavor consistency through comprehensive retail networks and quality-focused brand positioning. The country maintains a 6.2% growth rate, leveraging traditional tea expertise and gradual tea bag format acceptance in modern consumption patterns.
Urban centers, including Tokyo, Osaka, and Nagoya, showcase quality-oriented beverage consumption where tea bags integrate with established green tea traditions and convenience requirements to optimize preparation efficiency and maintain flavor quality under consistent consumer expectations.
Japanese manufacturers prioritize quality consistency and flavor precision in tea bag development, creating demand for quality-validated platforms with exceptional production standards, including precise blending techniques and comprehensive quality control protocols. The market benefits from established quality reputation infrastructure and consumer excellence expectations that provide premium positioning opportunities and comply with strict Japanese food quality regulations.
Europe Market Split by Country
The tea bags market in Europe is projected to grow from USD 2.46 billion in 2025 to USD 4.51 billion by 2035, representing 32.0% of the global market in 2025 and 30.9% by 2035. Germany is expected to maintain its leadership position with USD 0.72 billion in 2025, accounting for 29.3% of the European market, supported by its strong organic tea consumption trends and established afternoon tea culture.
The UK follows with USD 0.80 billion, representing 32.5% of the European market in 2025, driven by comprehensive tea heritage traditions and premium blend adoption. France holds USD 0.38 billion with 15.4% market share through established wellness tea consumption and specialty variety preferences.
Italy commands USD 0.28 billion representing 11.4% share, while Spain accounts for USD 0.18 billion or 7.3% in 2025. The rest of Europe region maintains USD 0.10 billion, representing 4.1% of the European market, attributed to increasing tea consumption in Nordic countries and emerging Eastern European markets implementing modern retail infrastructure programs.
Competitive Landscape of the Tea Bags Market
The tea bags market exhibits a moderately fragmented competitive structure with approximately 40-60 active players operating across global packaging supply networks and regional tea brand portfolios. Koehler Paper maintains market leadership at an 8.5% share, reflecting strong positioning in sustainable packaging solutions with sophisticated material innovation strategies.
This competitive landscape demonstrates the specialization of tea bag packaging and tea brand manufacturing, where established players leverage sustainable material expertise, retail distribution relationships, and brand recognition to maintain competitive positions, while innovative packaging startups and regional tea brands create niche opportunities through compostable material development and specialty tea curation.
Market leadership is maintained through several critical competitive advantages extending beyond production capabilities and material specifications. Global distribution networks enable leading players to navigate diverse sustainability requirements and access varied retail segments including hypermarkets, specialty stores, and online platforms.
Sustainable packaging innovation and compostable material development represent crucial differentiators in tea bag categories, where environmental credentials, biodegradability certification, and plastic-free solutions create purchasing preference among environmentally conscious brands and retailers.
Manufacturing efficiency in filter paper production, tea blending operations, and quality control management separate major suppliers from smaller competitors, while comprehensive sustainability documentation addressing material sourcing, carbon footprint, and circular economy principles strengthen market position and support brand environmental commitments.
The market demonstrates emerging differentiation opportunities in fully compostable packaging and specialty tea varieties, where conventional synthetic materials face disruption from innovative bio-based suppliers offering enhanced sustainability credentials and consumer acceptance. However, significant competitive advantages persist in established packaging supplier categories through integrated manufacturing networks and technical expertise.
Premium specialty tea lines with organic certification and functional wellness positioning command margin premiums through superior quality credentials and health differentiation. Heritage tea brands emphasizing traditional blends, cultural authenticity, and emotional connections generate brand loyalty and customer retention beyond transactional product competition.
| Stakeholder |
What they actually control |
Typical strengths |
Typical blind spots |
| Sustainable packaging innovators |
Material technology; compostable solutions; certification infrastructure |
Environmental credentials; innovation speed; regulatory compliance |
Scale production; cost competitiveness; mainstream adoption |
| Global tea brands |
Brand equity; retail relationships; product portfolios |
Market access; consumer trust; distribution scale |
Packaging innovation; sustainability transition; specialty segments |
| Regional packaging suppliers |
Local market knowledge; customer proximity; technical service |
Relationship depth; customization capability; responsive support |
Global reach; innovation resources; certification costs |
| Specialty tea brands |
Blend curation; quality positioning; direct consumer relationships |
Premium margins; brand loyalty; differentiation clarity |
Volume scale; retail penetration; mainstream pricing |
| Heritage tea companies |
Cultural authenticity; brand history; consumer loyalty |
Tradition credibility; established distribution; brand recognition |
Innovation agility; sustainability leadership; younger demographics |
Key Players in the Tea Bags Market
- Koehler Paper
- Parkside
- Elevate Packaging, Inc
- Dongguan Yupu Packaging Products Co., Ltd.
- Sikri Packaging Corporation LLP
- TONCHANT
- Greenshield Nutricare
- YITING NON-WOVEN CO., LTD
- Macrokun
- Custom Co-Pak
Scope of the Report
| Items |
Values |
| Quantitative Units (2025) |
USD 7.69 billion |
| Tea Type |
Black Tea, Green Tea, Herbal Tea, Specialty Blends |
| Distribution Channel |
Hypermarkets & Supermarkets, Online, Specialty Stores, Convenience Retail |
| End Use |
Household, Foodservice, Hospitality |
| Regions Covered |
North America, Europe, Asia Pacific, Central & South America, Middle East & Africa |
| Countries Covered |
USA, China, India, Germany, UK, Japan, Brazil, and 15+ additional countries |
| Key Companies Profiled |
Koehler Paper, Parkside, Elevate Packaging, Dongguan Yupu Packaging, Sikri Packaging, TONCHANT, Greenshield Nutricare |
| Additional Attributes |
Dollar sales by tea type and distribution categories, regional adoption trends across Asia Pacific, North America, and Europe, competitive landscape with established packaging suppliers and specialty tea brands, consumer preferences for convenience preparation and wellness functionality, integration with retail systems and online subscription platforms, innovations in sustainable packaging technology and compostable material development, and advancement of premium tea platforms with optimized quality profiles and comprehensive sustainability credentials. |
Tea Bags Market by Segments
-
Tea Type :
- Black Tea
- Green Tea
- Herbal Tea
- Specialty Blends
-
Distribution Channel :
- Hypermarkets & Supermarkets
- Online
- Specialty Stores
- Convenience Retail
-
End Use :
- Household
- Foodservice
- Hospitality
-
Region:
- North America
- Europe
- Germany
- France
- UK
- Italy
- Spain
- Rest of Europe
- Asia Pacific
- China
- India
- Japan
- South Korea
- ASEAN
- Australia & New Zealand
- Rest of Asia Pacific
- Central & South America
- Brazil
- Rest of Central & South America
- Middle East & Africa
- GCC Countries
- South Africa
- Rest of Middle East & Africa