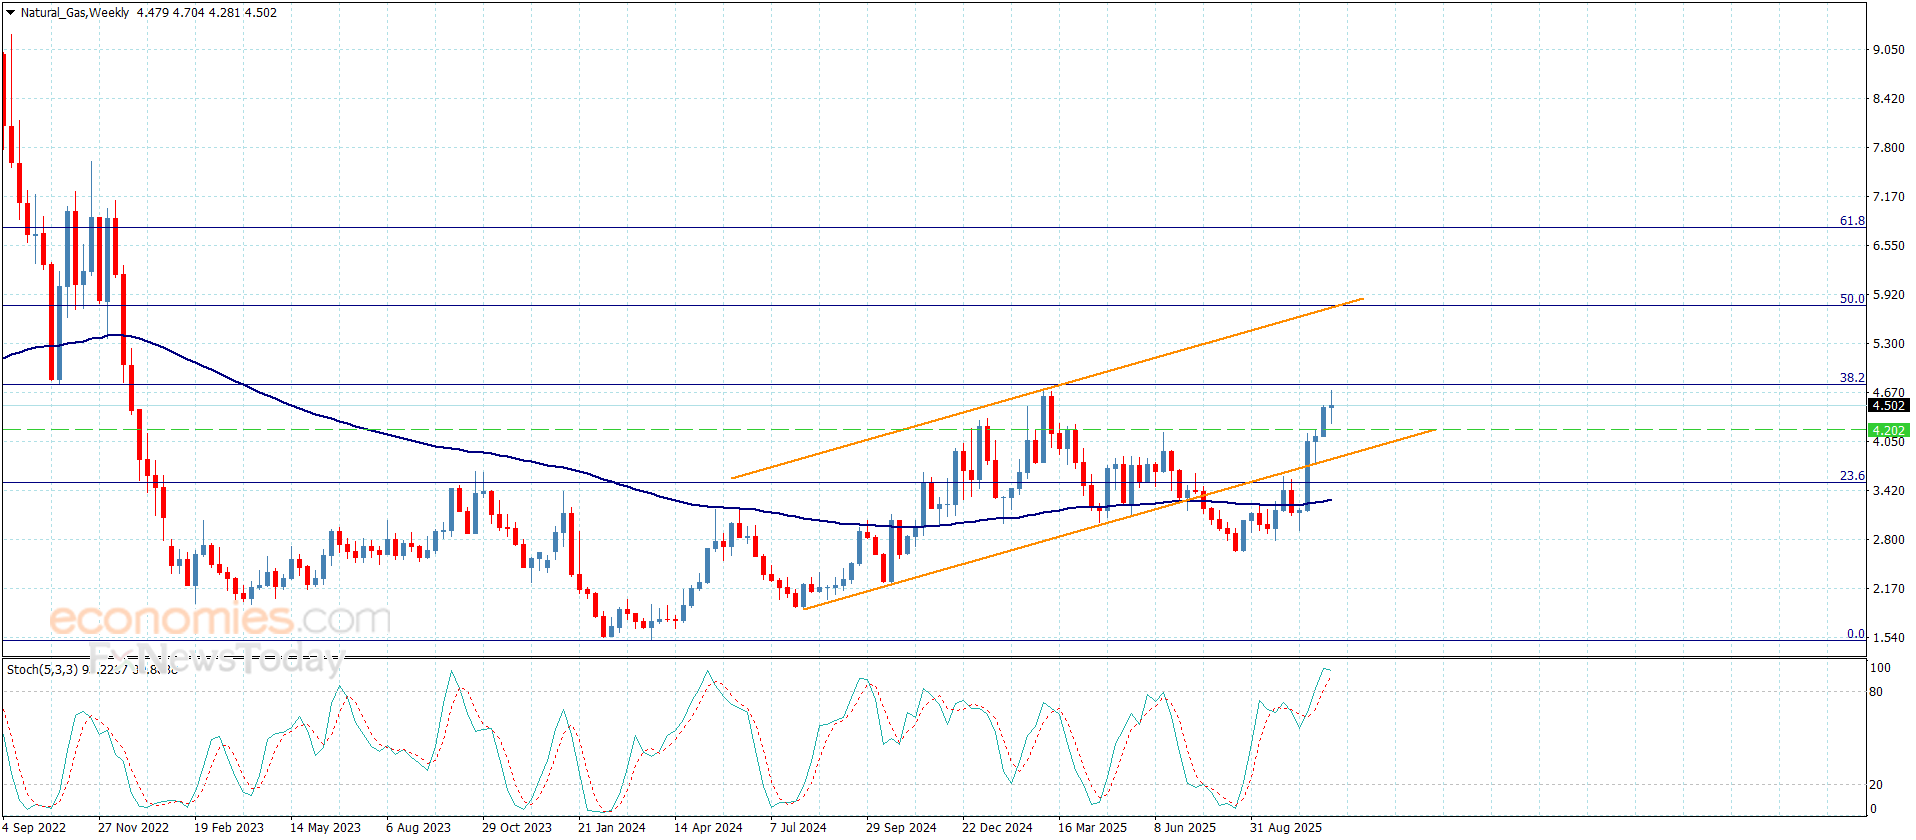
Natural gas prices formed temporary corrective trading on Friday, keeping their positive stability above the extra support at $4.200, to confirm the previously suggested bullish scenario.
The price might be forced to provide more mixed trading, to keep waiting for extra bullish momentum, to ease the mission of pressing on %38.2 Fibonacci level at $4.770 and surpassing it will lead the price to record extra gains by its rally towards $4.910 and $5.150.
The expected trading range for today is between $4.330 and $4.700
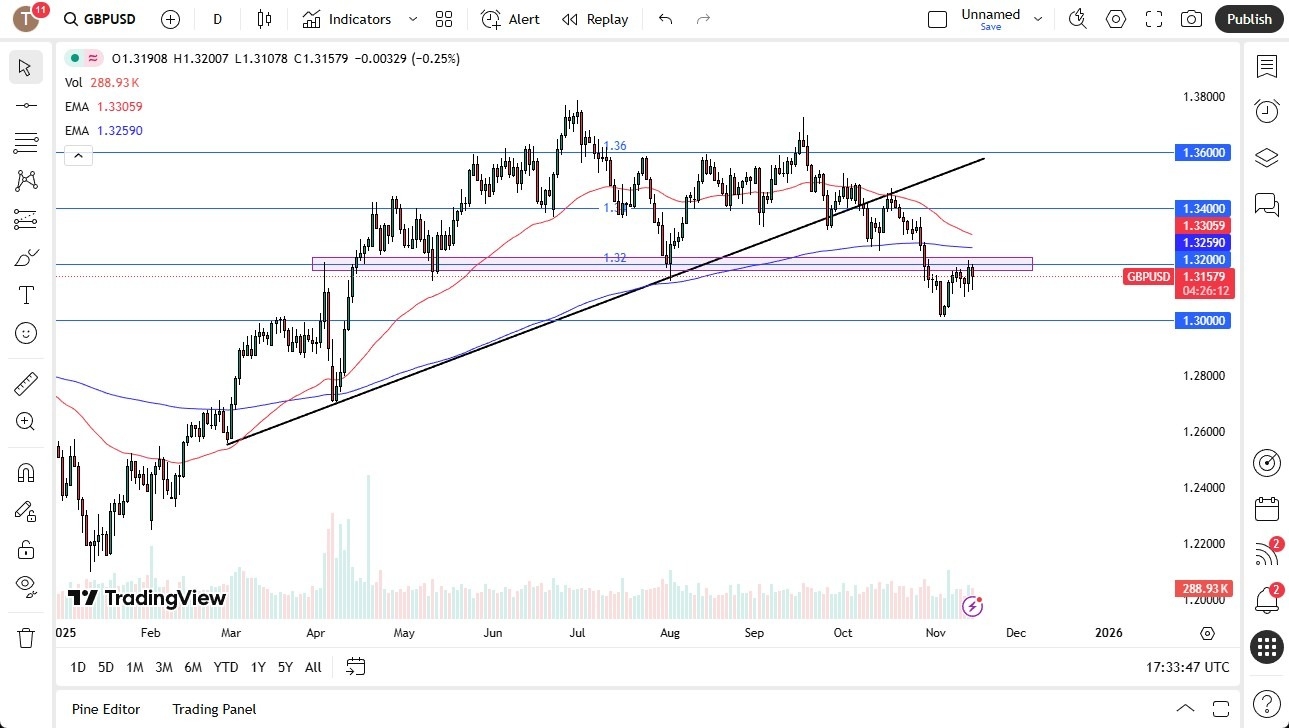
The British pound slid sharply on Friday as 1.32 capped gains, with weakening technicals and a looming death cross reinforcing a bearish bias.
Expectations for a potential BOE rate cut further pressure GBP while short-term rallies continue to attract sellers.
The British pound has fallen quite a bit during the trading session against the US dollar on Friday, as the 1.32 level has offered a bit of a barrier. Ultimately, this is a market that I think you have to look at through the prism of being in a downtrend now that we are below 1.32, which means if we can break above the 1.32 level, then that would actually be a very strong sign.
Potential “Death Cross”
Nonetheless, the 50-day EMA breaking down the way it is and looking to cross below the 200-day EMA suggests that perhaps we might get the so-called death cross. And that, of course, is a very negative turn of events as the death cross will attract a lot of longer-term traders. The US dollar itself has been relatively strong. And I think that probably continues to be the case.
But the British pound is a little bit different situation in the sense that, despite the fact that the Bank of England did not cut rates last time, the reality is that the vote count was very close. So, with this, I think you have a situation where traders are keeping an eye on the idea of lower rates coming out of London. And that will have a major influence on what we see here.
I fade short term rallies that show the first signs of exhaustion. I like the US dollar in general right now, but more importantly, don’t necessarily like the British pound. If we were to break above the 1.32 level and then sustain that for a day or two, then you can make an argument for getting long. But until then, I’m more of a downside player at this point.
Christopher Lewis has been trading Forex and has over 20 years experience in financial markets. Chris has been a regular contributor to Daily Forex since the early days of the site. He writes about Forex for several online publications, including FX Empire, Investing.com, and his own site, aptly named The Trader Guy. Chris favours technical analysis methods to identify his trades and likes to trade equity indices and commodities as well as Forex. He favours a longer-term trading style, and his trades often last for days or weeks.
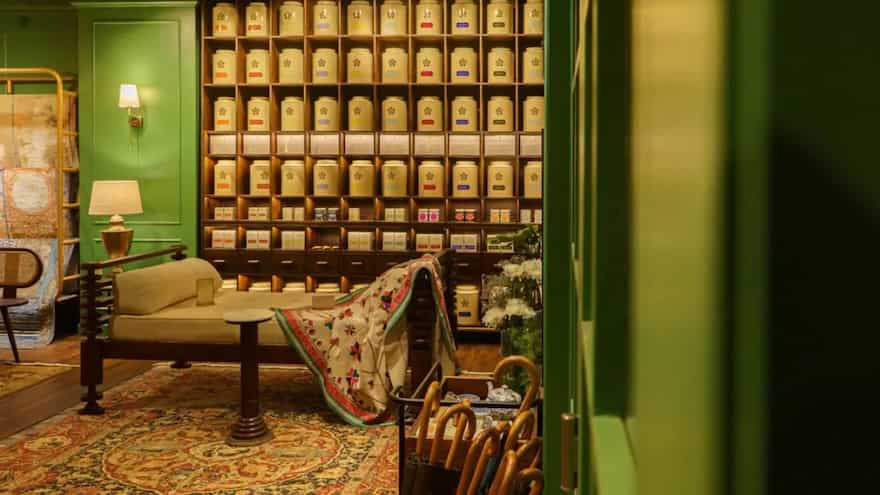
Kolkata’s culture is deeply rooted in its tea. From early in the morning until late at night, it is consumed throughout the day. The sound of dishes clattering and the smell of freshly brewed tea fill the booths of the chaiwallahs, or street merchants, who are everywhere. But Kolkata is also home to a few of the most luxurious tea rooms in the country, linked to the city’s colonial heritage. Here are a few interesting ones you can take note of.
Image Credit: Pixabay
A modest tea stall on the street, a passionate dispute about politics, a newspaper in one hand and hot chai in the other. It’s peak Bengali behaviour. Today, though, the discussion shifts from the local tea stalls in the city to tea rooms in the city. What is a tea-room, you ask? A tearoom is a quaint setting where people congregate to savour different kinds of tea, frequently with light fare like cakes, sandwiches, or scones. With a steaming cup of tea, tearooms provide a comfortable and friendly setting where guests may relax, talk with friends, or even hold business meetings. Yes, it’s the European influence that still permeates these tea rooms in Kolkata. It’s all very Bridgerton, with tea cakes on the side, charming tea rooms and lounges, pinky-up while drinking, and laughing like it’s high tea at a royal estate. Tea rooms and lounges that radiate this vintage English charm abound in Kolkata. Continue reading to know where to go:
Dolly’s – The Tea Shop
India’s first female tea taster opened her own tea business in Kolkata in 1988. Dolly Roy, who goes by Dolly, launched Dolly’s – The Tea Shop inside Dakshinapan Shopping Complex. Dolly’s been serving exceptional blends and educating people how to enjoy tea the way experts do, long before tea rooms and lounges were trendy. Try raw tea, particularly Darjeeling tea without milk, also referred to as liquor cha in the community (no, it isn’t made with alcohol; we prefer tea made with tea leaves). And also the Mango Tango if the heat rushes to your head! You can also purchase tea to take home. With vintage, retro music playing in the background, the atmosphere is terrific. There is something for everyone, including herbal infusions, speciality blends, and black and green teas.
Address: Shop No. G-62, Ground Floor, Dakhinapan Shopping Complex, 2, Gariahat Rd S, Dhakuria, Jodhpur Park, Kolkata, West Bengal 700068
Timings: 10:30 AM – 8 PM. Closed on Sundays.
Cha Bar, Oxford Book Store
Like a scene from your current book, this is where all the BookTok girlies, bookworms, and literary romantics congregate. If you enjoy falling into a main-character mindset, the Cha Bar within Oxford Bookstore, Park Street, is the place to start your story. Purchase a book and immediately begin reading it while enjoying some tea and pastries. While enjoying what is arguably the largest selection of teas in Kolkata, including several tea-based mocktails, you can read and write at your leisure. With over 150 different types of tea, Cha Bar’s tea menu includes Arabic, Chinese, Japanese, Moroccan, Russian, Sri Lankan, South African and Thai teas in addition to a variety of single-origin Darjeeling, Nilgiri, Sikkim and Oolong teas, flowering teas, organic teas, herbal teas, fruit teas and bubble teas.
Address: 17, Park Street, Oxford Book Store, Park Street Area, Taltala, Kolkata, West Bengal 700016
Address: Ground Floor, 62/1, Golpark, Hindustan Park, Gariahat, Kolkata, West Bengal 700029
Flurys
Not only one of the oldest bakeries but also one of the oldest tea rooms in the city and country, Flurys has to be on your list. It serves the best view of the iconic Park Street with a side of English charm in Kolkata. Flurys originally had been established as an old English tearoom by Mr and Mrs J. Flurys in 1927. Well-known around the world for its rich, creamy cookies, puddings, and pastries, and hot beverages too, decades later, the restaurant is still as well-liked, featuring chandeliers, fancy furniture, and pastel colours that evoke the atmosphere of European tea salons. The tea blend offered at the flagship location on Park Street will appeal to you. Namring Upper Tea Estate supplies the second flush Darjeeling tea, while the company-owned garden at Budlabeta supplies the Assam tea. Darjeeling is the source of green tea. They also have an upcoming tea set that will have the logo stamped on it, which includes tea, milk, sugar pots, cups, saucers, and a strainer.
Address: 18A, Park St, Park Street area, Kolkata, West Bengal 700071
The Glenburn Cafe
The Glenburn Cafe has been renovated from an old warehouse site. It gives the feel of a European tea room and is part of the famous Glenburn tea estate in Darjeeling. Upon entering, you will be mesmerised by the quaint white louvred windows, the vintage décor, the chequered marble floors, and the flower-filled boxes underneath each window. It’s a wonderful spot to enjoy Glenburn’s renowned tea and some delectable cakes and pastries. Hot and cold drinks from the 8th Day Café, a roastery in Kolkata, are offered, along with a wide variety of 23 varieties of Darjeeling, Assam, and tasty mixes from their tea plantations in Darjeeling and Khongea, Assam. Tea from Darjeeling is served with a squeeze of fresh Gondhoraj lemon.
Address: 7A, Russel St, Park Street area, Kolkata, West Bengal 700071
Image Credit: ITC Royal Bengal
Address: G9WX+G3 ITC Royal Bengal, 1, JBS Haldane Ave, Tangra, Kolkata, West Bengal 700105
Visit the recently built Makaibari Bungalow Life store at Taj Bengal to experience the atmosphere of a plantation. Excellent tea, beautiful handmade fabrics, and the sophistication of plantation furniture are all available in this immersive space. Celebrated for its 160-year history of creating outstanding organic teas, the renowned Bengali tea brand Makaibari at Taj Bengal in Kolkata is now offering its discriminating clientele a lavish bungalow lifestyle. The space features handcrafted goods from Luxmi Estates’ historical outposts, which are responsible for prestigious brands like Obeetee and Makaibari, each of which has more than a century of unmatched craftsmanship. This includes an amazing selection of excellent teas, well-wrought silver teapots, plantation furniture, beautiful carpets, and home linens, all of which are expertly intended to create an extravagant, handcrafted lifestyle.
Address: 34-B, Belvedere Rd, Alipore, Kolkata, West Bengal 700027
Jakarta, Pintu News – Dogecoin , the meme-themed crypto known for its fast transactions and low fees, has been on a downward trend for the past month. However, a change in direction is now in sight, with Dogecoin’s price movement showing a potential trend reversal supported by a cyclical pattern forming.
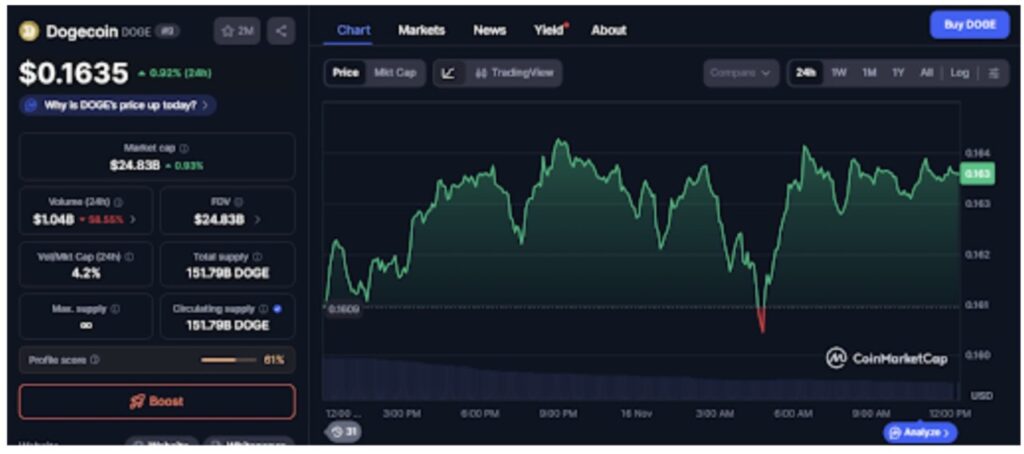
On November 17, 2025, the price of Dogecoin recorded a decrease of 1.64% in 24 hours, trading at $0.1612, equivalent to IDR 2,698. In the last 24-hour period, the DOGE price moved in the range of IDR 2,769 to IDR 2,584.
As of writing, Dogecoin’s market cap stands at around IDR 406.59 trillion, with a trading volume of around IDR 30.29 trillion in 24 hours.
At the end of last week, Dogecoin had shown a recovery after weakening at the beginning of the trading session. Throughout the day, the price moved in a consistent uptrend, reflecting the market sentiment that was starting to become positive.
The volume to market capitalization ratio stood at 4.2%, indicating normal trading activity. This movement indicates stable market interest and potential short-term consolidation.
Source: CoinMarketCap
With the gains made in the last 24 hours, Dogecoin is showing resilience to market pressures.
Cyclical Pattern Indicates Potential Upside for DOGE Price
Observations from Bitcoinsensus reveal that Dogecoin is in a recurring low phase in its historical cyclical pattern. Throughout the year, DOGE has consistently exhibited a quiet consolidation phase followed by a sharp price spike. This pattern once pushed the price of DOGE up to 21,457.13% in the previous cycle.
Although the price is currently flat, this historical pattern gives an indication that Dogecoin may be approaching an accumulation phase before a potential major rally. If this trend repeats, DOGE has the opportunity to post another significant uptrend as in previous market cycles.
That’s the latest information about crypto. Follow us on Google News to get the latest crypto news about crypto projects and blockchain technology. Also, learn crypto from scratch with complete discussion through Pintu Academy and stay up-to-date with the latest crypto market such as bitcoin price today, xrp coin price today, dogecoin and other crypto asset prices through Pintu Market.
Enjoy an easy and secure crypto trading experience by downloading Pintu crypto app via Google Play Store or App Store now. Also, get a web trading experience with various advanced trading tools such as pro charting, various types of order types, and portfolio tracker only at Pintu Pro.
*Disclaimer
This content aims to enrich readers’ information. Pintu collects this information from various relevant sources and is not influenced by outside parties. Note that an asset’s past performance does not determine its projected future performance. Trading crypto carries high risk and volatility, always do your own research and use cold hard cash before investing. All activities of buying and selling bitcoin and other crypto asset investments are the responsibility of the reader.
By Christina Flach — Celebrity Makeup Artist & Beauty Expert
“Keratin shouldn’t force your hair into something it’s not — it should make your natural texture smoother, healthier, and easier to live with.” — Christina Flach
Keratin treatments have become one of the most requested solutions for achieving smoother, shinier, more manageable hair. But with so many formulas out there — from Brazilian Blowouts to express keratin to full straightening systems — it’s important to choose the right treatment for your hair type, lifestyle, and goals.
As a celebrity makeup artist working on-camera talent, athletes, TV hosts, and editorial shoots, I see every texture respond differently to keratin. When chosen correctly, keratin can be life- changing. When chosen incorrectly, it can flatten, dry, or overwhelm the hair.
What Is a Keratin Treatment?
Keratin is the natural protein found in your hair, skin, and nails. Over time, heat styling, coloring, UV exposure, and environmental stressors break down the hair’s keratin, leaving it frizzy, dull, and harder to manage.
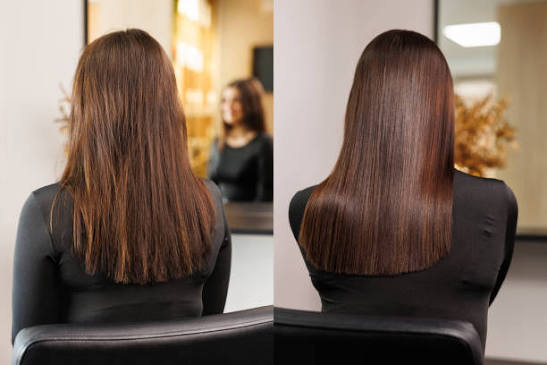
A keratin treatment works by replenishing this protein and sealing it into the hair cuticle using heat. The result? – Smoother, glossier, stronger hair that’s easier and faster to style.
Types of Keratin Treatments
1- Brazilian Blowout (Smoothing Treatment)
Best for: frizzy, wavy, curly hair that wants frizz control but still wants movement and curl.
Benefits: major shine, humidity protection, faster blowouts.
Lasts: 3–4 months.
2- Traditional Keratin Treatment (Stronger Straightening)
Best for: thick, coarse, unruly, or very frizzy hair.
Benefits: stronger smoothing, more straightening, reduced volume.
Lasts: 4–6 months.
Note: Some formulas may contain small amounts of formaldehyde or releasing agents — always ask for formaldehyde-free if sensitive.
3- Soft/Express Keratin Treatments
Best for: fine hair, mildly frizzy hair, or hair that needs a quick, gentle refresh.
Benefits: lightweight smoothing, instant shine, little to no curl loss.
Lasts: 6–8 weeks.
4- Japanese Straightening (Not a Keratin)
Frequently confused with keratin but works differently.
Best for: people who want pin-straight hair permanently.
Pros: dramatic, glossy, straight hair.
Cons: can cause breakage if hair is fragile.
Lasts: permanent until new hair grows out.
Who Is a Good Candidate for Keratin?
YES, consider keratin if you:
truggle with frizz or humidity
want smoother hair but not necessarily straight hair
want faster blow-drying
have color-treated hair that needs protection
want shine and softness without losing fullness
Avoid or reconsider keratin if you:
are pregnant or breastfeeding
have extremely damaged/over-processed hair
love big volume
have a sensitive scalp
don’t heat style (keratin requires high heat to seal)
Pros & Cons of Keratin Treatments
THE PROS
Eliminates frizz completely — even in humidity
Cuts styling time in half
Adds high-gloss shine
Strengthens hair by filling weak spots
Great for color-treated hair (seals color and reduces fading)
THE CONS
Some formulas release fumes during sealing
Can reduce volume more than some clients expect
Requires 24–48 hours of hair “rest” after treatment
Not suitable for very fragile, over-bleached hair
Can be pricey: $150–$500 depending on length and thickness
Christina’s Keratin Do’s & Don’ts
DO
Choose a formula matched to your hair’s texture and needs
Use sulfate-free shampoo
Deep-condition weekly
Request formaldehyde-free if you prefer clean formulas
Bring photos of the look you want
Sleep on a silk pillow, best for your hair and skin.
DON’T
Don’t wash or tie your hair for 24–48 hours afterward
Don’t expose hair to saltwater or chlorine unprotected
Don’t expect keratin to repair extreme damage instantly
Don’t use excessive heat — you’ll need less after keratin
Don’t put your hair in ponytails or clips too soon (it dents!)
Pro Tip from Christina
If you’re considering a keratin treatment, bring a photo of your dream hair and your realistic daily routine to your stylist. The right keratin formula should match your lifestyle, not just your hair type. If you work out daily, live in humidity, travel often, or need wash-and-go simplicity, your stylist can tailor the smoothing level to support the way you truly live. Smooth, healthy hair should make your life easier — not more complicated.
Disclaimer The Content is not intended to be a substitute for professional medical advice, diagnosis, or treatment. Always seek the advice of your physician or other qualified health provider with any questions you may have regarding a medical condition.
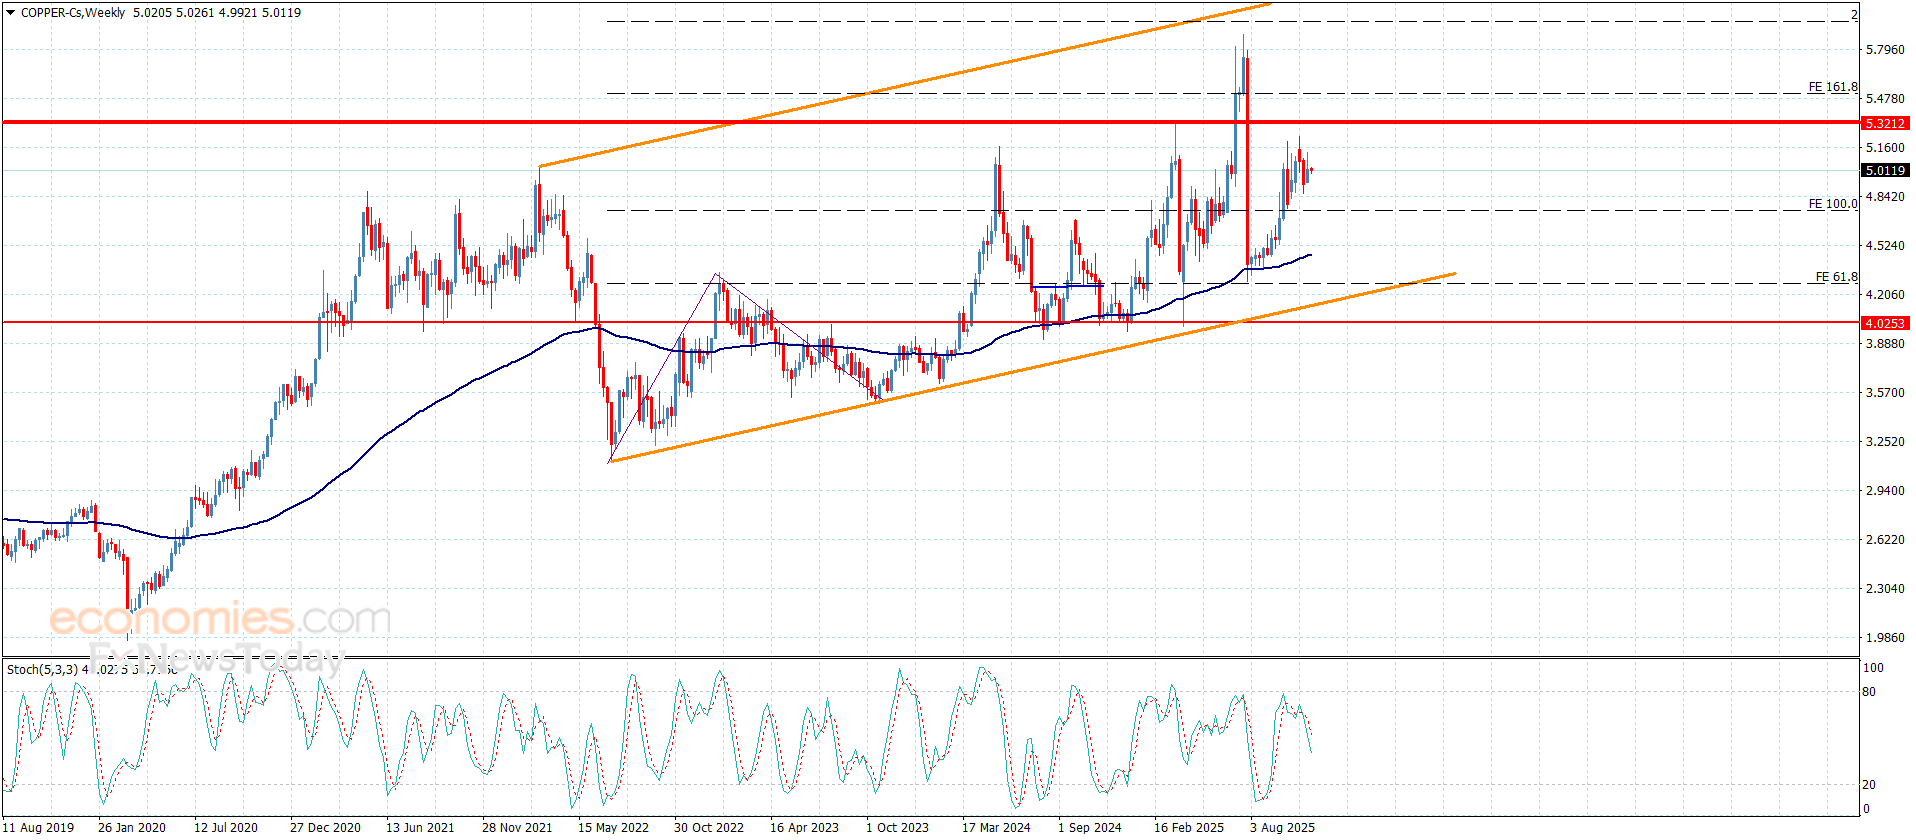
Copper price returned to form weak sideways trading due to the contradiction between the main indicators, by stochastic reach below 50 level, which forces it to settle below $5.2000, announcing its readiness to activate the bearish corrective trend again.
Facing negative pressure in the current period might force it to attack the extra support near $4.7500 and surpassing it might extend the losses towards $4.6300 reaching the moving average 55 at $4.4600.
The expected trading range for today is between $4.7500 and $5.1200
EUR/USD moves sideways slightly above 1.1600 in the European morning on Monday after posting marginal losses on Friday. The pair’s near-term technical outlook highlights a loss of bullish momentum. In the absence of high-impact data releases, comments from central bank policymakers could drive the pair’s action.
Euro Price Today
The table below shows the percentage change of Euro (EUR) against listed major currencies today. Euro was the weakest against the New Zealand Dollar.
USD
EUR
GBP
JPY
CAD
AUD
NZD
CHF
USD
0.07%
-0.01%
0.12%
-0.05%
0.00%
-0.15%
-0.06%
EUR
-0.07%
-0.09%
0.05%
-0.11%
-0.06%
-0.22%
-0.13%
GBP
0.01%
0.09%
0.12%
-0.03%
0.01%
-0.14%
-0.05%
JPY
-0.12%
-0.05%
-0.12%
-0.17%
-0.12%
-0.28%
-0.19%
CAD
0.05%
0.11%
0.03%
0.17%
0.05%
-0.11%
-0.02%
AUD
-0.01%
0.06%
-0.01%
0.12%
-0.05%
-0.16%
-0.05%
NZD
0.15%
0.22%
0.14%
0.28%
0.11%
0.16%
0.09%
CHF
0.06%
0.13%
0.05%
0.19%
0.02%
0.05%
-0.09%
The heat map shows percentage changes of major currencies against each other. The base currency is picked from the left column, while the quote currency is picked from the top row. For example, if you pick the Euro from the left column and move along the horizontal line to the US Dollar, the percentage change displayed in the box will represent EUR (base)/USD (quote).
Hawkish remarks from Fed officials supported the US Dollar (USD) heading into the weekend and caused EUR/USD to edge lower.
Kansas City Fed President Jeffrey Schmid argued that further rate cuts wouldn’t “patch job market cracks,” instead they could do damage to inflation. Meanwhile, St. Louis Fed President Alberto Musalem said that the US economy is resilient and added they need to proceed with caution.
According to the CME FedWatch Tool, markets are currently pricing in about a 56% chance that the Fed will hold the policy rate unchanged at the last meeting of the year, up from about 37% a week earlier.
In case Fed policymakers cling to a cautious tone on further policy-easing, the USD could hold its ground and continue to limit EUR/USD upside.
Meanwhile, the Bureau of Labor Statistics announced that it will release the Nonfarm Payrolls data for September on Thursday.
EUR/USD Technical Analysis:
The 20-period Simple Moving Average (SMA) rises above the 50-, 100-, and 200-period SMAs, with the short-term slopes turning higher while the 200-period SMA still declines. Price holds above all these averages, keeping the near-term bias mildly bullish. The Relative Strength Index (RSI) prints 54, neutral with a slight positive tilt.
Measured from the 1.1885 high to the 1.1470 low, the 38.2% retracement at 1.1628 aligns as the initial resistance level. A sustained break above it could open the path to the 50% retracement at 1.1678. The 200-period SMA at 1.1610 offers nearby dynamic support. A drop below this level would undermine the bullish tone and expose the horizontal support at 1.1551.
(The technical analysis of this story was written with the help of an AI tool)
Euro FAQs
The Euro is the currency for the 20 European Union countries that belong to the Eurozone. It is the second most heavily traded currency in the world behind the US Dollar. In 2022, it accounted for 31% of all foreign exchange transactions, with an average daily turnover of over $2.2 trillion a day.
EUR/USD is the most heavily traded currency pair in the world, accounting for an estimated 30% off all transactions, followed by EUR/JPY (4%), EUR/GBP (3%) and EUR/AUD (2%).
The European Central Bank (ECB) in Frankfurt, Germany, is the reserve bank for the Eurozone. The ECB sets interest rates and manages monetary policy.
The ECB’s primary mandate is to maintain price stability, which means either controlling inflation or stimulating growth. Its primary tool is the raising or lowering of interest rates. Relatively high interest rates – or the expectation of higher rates – will usually benefit the Euro and vice versa.
The ECB Governing Council makes monetary policy decisions at meetings held eight times a year. Decisions are made by heads of the Eurozone national banks and six permanent members, including the President of the ECB, Christine Lagarde.
Eurozone inflation data, measured by the Harmonized Index of Consumer Prices (HICP), is an important econometric for the Euro. If inflation rises more than expected, especially if above the ECB’s 2% target, it obliges the ECB to raise interest rates to bring it back under control.
Relatively high interest rates compared to its counterparts will usually benefit the Euro, as it makes the region more attractive as a place for global investors to park their money.
Data releases gauge the health of the economy and can impact on the Euro. Indicators such as GDP, Manufacturing and Services PMIs, employment, and consumer sentiment surveys can all influence the direction of the single currency.
A strong economy is good for the Euro. Not only does it attract more foreign investment but it may encourage the ECB to put up interest rates, which will directly strengthen the Euro. Otherwise, if economic data is weak, the Euro is likely to fall.
Economic data for the four largest economies in the euro area (Germany, France, Italy and Spain) are especially significant, as they account for 75% of the Eurozone’s economy.
Another significant data release for the Euro is the Trade Balance. This indicator measures the difference between what a country earns from its exports and what it spends on imports over a given period.
If a country produces highly sought after exports then its currency will gain in value purely from the extra demand created from foreign buyers seeking to purchase these goods. Therefore, a positive net Trade Balance strengthens a currency and vice versa for a negative balance.
Dr Saurabh Sethi, a board certified gastroenterologist, shared a warning with his 1.3million Instagram followers about tea drinking habits that can have a negative effect on our health
Alice Sjoberg Social News Reporter
09:15, 17 Nov 2025
Drinking tea might be worse for your health than you might think (stock image)(Image: Getty Images)
A gastroenterologist trained at Harvard has cautioned individuals to scrutinise their tea-drinking habits, as they could be causing damage to your gut and liver.
Brits are famous for their fondness for tea, consuming over 100 million cups daily – amounting to approximately 36 billion cups each year. The UK Tea and Infusions Association (UKTIA) discloses that 84% of Britons savour a brew every single day.
But have you ever pondered what this might be doing to your body?
Harvard-educated gastroenterologist Dr Saurabh Sethi has now taken to Instagram to alert his 1.3 million followers about potentially harmful tea-drinking practices that could be detrimental to their health.
“I’m a board certified gastroenterologist and here are [the] seven worst tea habits wrecking your gut + liver,” he penned on his post, reports the Mirror.
He then proceeded to share seven common blunders people make when drinking tea, and how it can impact your health negatively.
1. Consuming tea on an empty stomach
Dr Sethi’s initial warning advised against drinking tea without food, urging individuals to have a snack before or during their cuppa.
He clarified that having tea on an empty stomach irritates the stomach lining due to its acidity and compounds such as caffeine and tannins.
This can subsequently provoke acid reflux, nausea, and general discomfort.
It may also lead to dehydration since tea acts as a diuretic and could obstruct iron absorption, particularly problematic for those suffering from anaemia.
2. Drinking sweetened teas
Next, Dr Sethi advised people to limit their consumption of iced teas or milk teas due to their high sugar content. He informed his followers: “Iced teas or milk teas can pack 30 – 40 grams of sugar.”
This implies that regularly drinking these types of sugary teas can heighten the risk of conditions like non-alcoholic fatty liver disease or diabetes.
3. ‘Detox’ or Slimming teas
Thirdly, Dr Sethi disclosed that detox teas, or ‘slimming’ teas, may not be as beneficial as they are advertised
While they might work for some, the doctor explained that the ‘slimming’ element in these teas is usually a form of laxative.
Frequent consumption of these tea ‘laxatives’ can lead to dehydration, electrolyte imbalance, and gut damage.
Therefore, it’s essential not to consume more than recommended and to consult NHS guidance on laxatives to avoid any lasting harm to your body.
4. Overdoing green tea extracts
Lastly, while green tea is generally considered a healthier alternative to standard black tea, it’s also important not to overdo it.
If you’re not fond of the taste of green tea, then green tea supplements have become a popular way to still reap the benefits of green tea, such as antioxidants and polyphenols, without having to drink it.
However, Dr Sethi issued a stark warning about over-reliance on these supplements, as they’ve been associated with a rare, ‘but real’ risk of liver toxicity.
5. Drinking scalding hot tea
While many of us are guilty of pouring boiling water straight from the kettle onto our teabag, Dr Sethi has advised tea lovers to hold off drinking until the water has cooled to below 65C.
He further explained that regularly consuming tea hotter than 65C has been shown to heighten the risk of oesophageal cancer.
A Chinese study published in 2020 found a significant link between regularly drinking tea hotter than 65C and Oesophageal squamous cell carcinoma, a type of cancer that originates in the thin, flat squamous cells lining the oesophagus, the tube connecting the throat and stomach.
6. Drinking caffeinated teas late at night
Although different types of tea contain significantly less caffeine compared to coffee, it’s still crucial to be aware of its presence.
For this reason, Dr Sethi advised tea drinkers to steer clear of chai and green teas late at night. He elaborated that caffeine lingers in our bodies, which can disrupt our sleep.
This can subsequently hinder your body’s ability to repair itself effectively during the night, such as your liver or gut.
7. Overindulging in boba or bubble teas
Dr Sethi issued a stark warning to bubble tea lovers, cautioning them about the high sugar content and ‘hidden calories’ in their favourite drinks.
He explained that the sweet mixture, along with starchy boba pearls made from tapioca, can lead to an unexpected calorie intake. This could potentially result in insulin resistance and non-alcoholic fatty liver disease.
To avoid these health problems, it’s essential to maintain a balanced lifestyle and adhere to a nutritious diet.
Cardano price is slipping below key support levels, signaling growing bearish pressure as participants watch to see how much deeper the decline could extend.
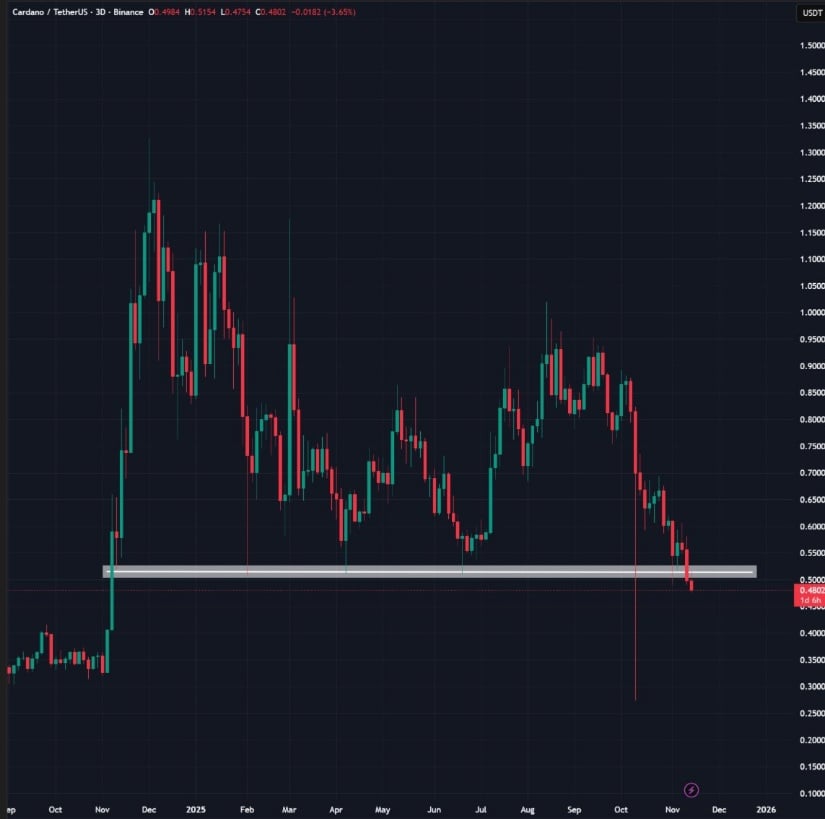
Cardano’s latest price action has taken a sharp turn, slipping below the crucial $0.50 support and shaking confidence across the market. What looked like a steady consolidation has now turned into a clear sign of weakness, with both technical levels and on-chain flows pointing to mounting sell pressure.
Cardano Price Breaks $0.50 Support Level
Cardano has now confirmed a breakdown below the key $0.50 support, a level that held the structure. The chart shows price slipping under the horizontal zone with no significant bullish reaction, indicating weakness in demand. The lower-timeframe candles are printing consistent lower highs, and the next visible liquidity pocket sits closer to the $0.42 to $0.38 range. If this zone fails to attract buyers, ADA may drift towards deeper historical levels where volume previously accumulated.
Cardano price is trading around $0.50, down -1.64% in the last 24 hours. Source: Brave New Coin
Momentum remains soft, with sell-side pressure visible on the breakdown. Cardano will need to reclaim $0.50 quickly to avoid acceleration towards lower support blocks. Until then, the chart leans bearish, and mean-reversion attempts could remain short-lived.
Cardano Next Key Support at $0.25
Crypto Chiefs chart shows a clean structural break beneath the major mid-range level. ADA has decisively slipped below the $0.50 line, leaving a large inefficiency zone beneath it. From a pure technical standpoint, the next strong support lies at $0.25, a higher-timeframe level that previously stood as a multi-month base.
Cardano’s breakdown now exposes the high-timeframe $0.25 support as the next major target for price. Source: Crypto Chief via X
If ADA Cardano price continues its descent without forming a higher low, this $0.25 zone may become the major magnet for price. Until ADA can reclaim the broken support, rallies are likely to face resistance at the same $0.50 level now flipped into supply.
On-Chain Flow Shows Heavy Selling Pressure
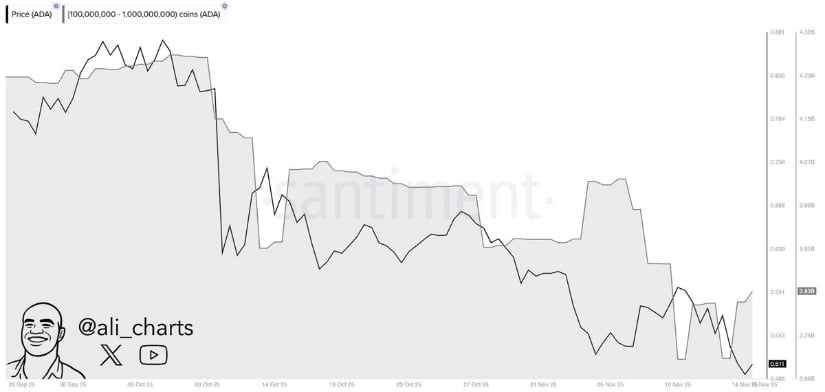
Recent on-chain activity highlights a surge in distribution among large ADA holders. Ali Martinez highlights that roughly 440 million ADA exited whale wallets within a single month, a significant sign of shifting sentiment. The declining whale holdings on the Cardano chart align with the broader price downtrend, suggesting that institutional and large retail entities have been reducing exposure rather than accumulating into weakness.
Whales have offloaded over 440 million ADA in a month, adding strong sell pressure to an already weakening chart. Source: Ali Martinez via X
This sustained outflow adds another layer of pressure on ADA, especially when paired with the loss of key technical levels. Without renewed demand, recovery attempts may remain limited as whales continue to offload during each bounce.
Large Sell-Off Adds to Bearish Pressure
Following the fresh wave of smart money sell-off, a single wallet unloading 14.5 million ADA for only $850K USADA further weakened the market confidence. Such large-scale exits typically appear in capitulation phases, signaling that some participants expect more downside. Combined with the breakdown on the charts and ongoing whale distribution, this large sell adds fuel to bearish momentum.
A single wallet sold 14.5 million ADA for just $850K, signaling capitulation-style pressure in the market. Source: Yasha via X
Final Thoughts: How Low Can Cardano Go?
Cardano price is entering a critical phase where both chart structure and on-chain behaviour point toward further downside unless buyers step in quickly. With the $0.50 support now lost, Cardano price has no major historical demand zones until the $0.42 to $0.38 region, a range that previously acted as a swing-point during older cycles. If this band fails to generate a reaction, the high-timeframe target around $0.25 becomes the next major level.
On-chain flows continue to confirm the technical weakness. Whale supply is trending lower, large holders are exiting positions, and distribution spikes are forming right as ADA breaks support. This combination suggests ADA could remain under pressure until capitulation zones are tested or a meaningful divergence forms on higher timeframes.
For Cardano price, reclaiming $0.60 is the first sign of structural repair. Only above this reclaimed base can ADA attempt a move towards $0.68 to $0.72 again. Until then, the market leans defensive, liquidity remains lower, and price could explore deeper supports before any sustainable recovery sets in.
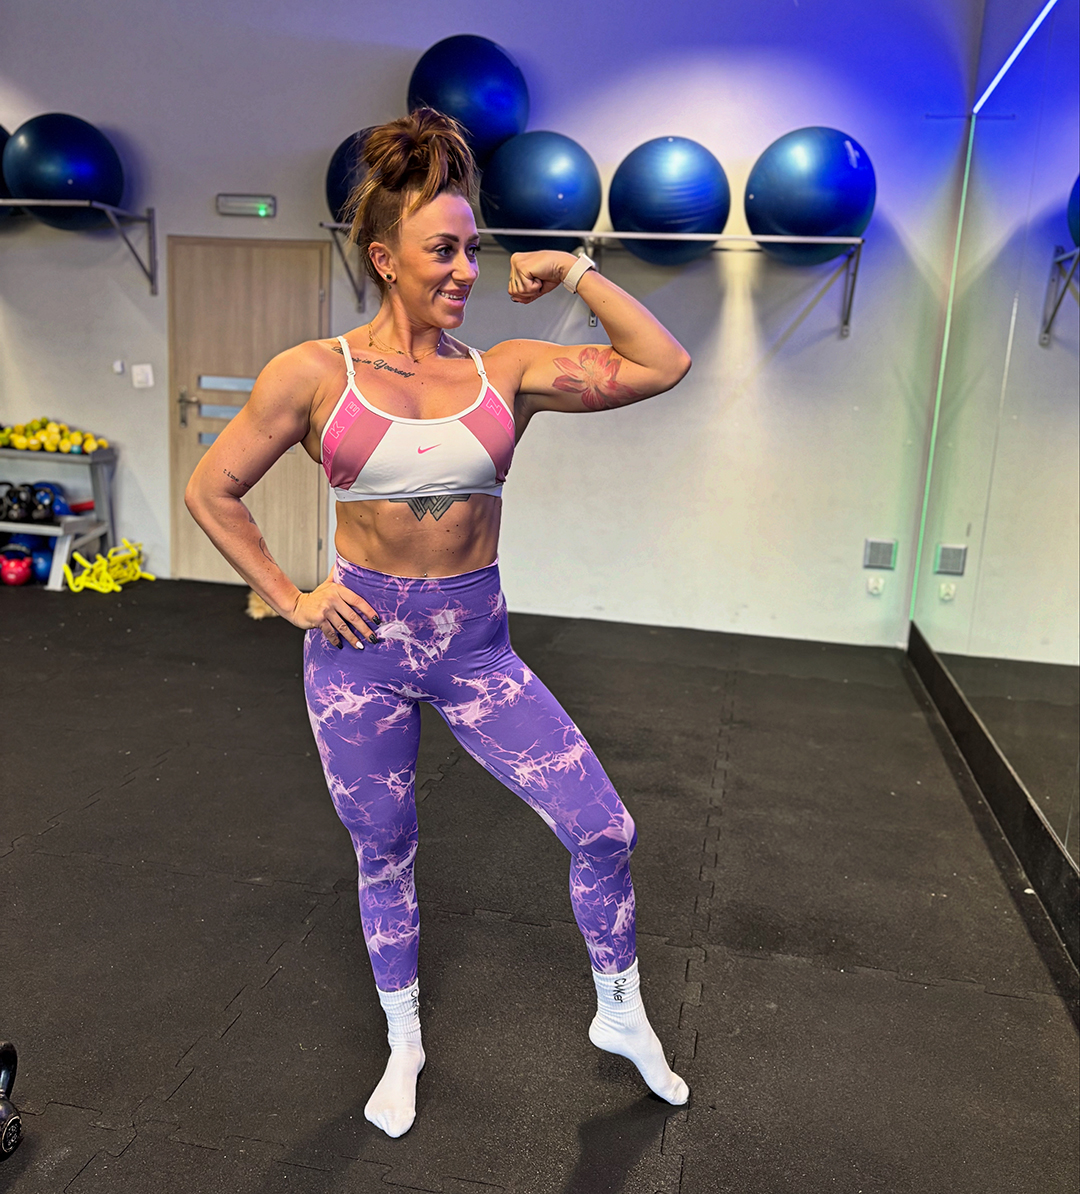
Monika Wierzbicka was born in a small town called Koszalin, on the Polish Baltic Sea. She has lived in Poland for almost her entire life, although she did travel a bit. Five years ago, she moved to a bigger city, and currently live at Gdansk. Her whole life has been connected with sports. She has been training in sports since childhood—starting with basketball, volleyball, athletics, and later strength sports. She studied and graduated in Koszalin, with a Master’s degree in Economics, but she did not work in that profession. Later she started professionally as a fitness instructor, but over time she developed her knowledge and skills because she always wanted to be better at what she did, that is why she is currently a medical and personal trainer. She work with injury patients, helping them return to health after injuries or surgeries, but she also love strength training and she helps her clients transform their bodies and improve their quality of life.
She has completed numerous courses and training related to sports and nutrition. She loves her job, so every day it is a pleasure combined with usefulness for which she receive a salary – a perfect life. Besides working in the gym or fitness room, she try to help her clients change bad habits, motivate them to make such changes, and inspire them with her positive energy and passion for life.
Additionally, she is also involved in helping homeless, abused dogs and assist the foundation in finding new homes where they will be surrounded by love. Animals is her second love (her first being sports). She also enjoys horseback riding as a hobby. She started her adventure with strength training in 2015. During this time, she also became interested in bodybuilding, specifically in the bikini fitness category. Since she is very slim, no one believed in her because she didn’t have the right conditions and couldn’t find a coach at that time. She is very happy about this now because it motivated her to achieve success on my own.
She learned from videos, read about training, and tested training techniques and preparation processes on herself. Her first competition took place in 2016—She won on her debut and was incredibly proud of herself. This marked the beginning of years of competing and rivalry on stage. She competed for about 5 years – during that time, she won the Polish Championship, the Polish Cup, went to the World Championships (where she was placed 8th), and her last competition brought her victory at the International Polish Championships, after which she was supposed to go to Mr. Olympia. However, she ended her career here – the Covid pandemic erupted, and she also had to undergo hernia surgery, which she had been struggling with for a long time, so she gave up competitions (focusing on her health).She devoted everything in her life to competing – family, friends, health, relationships, and pleasures. She regret nothing because it taught her so much, and thanks to that, she is now such a strong woman who knows what she wants in life.
Now she has different opportunities and can engage in things that she previously couldn’t afford. Because of this, she can now teach her clients the balance in life and how to be able to get the best out of what we are doing and to never give up, even if no one believes in you.
Currently, she provides training in coaching knowledge and conduct workshops for horseback riders on how to strengthen their bodies and gain more benefits from horseback riding. Additionally, she is interested in modeling—although she is at the beginning of this journey, she enjoys it a lot—but she is also working on several other projects that she wish not to talk about yet She would like everyone to believe in their own strength and potential, just as she did many years ago—because only such determination can lead to success.
Of course! Here is a comprehensive set of interview questions for Monika Wierzbicka, designed to cover her unique journey from champion competitor to specialized trainer and model.
Today we’re with the incredible Monika Wierzbicka – a Polish Fitness Champion, a dedicated trainer, and a fitness model. Monika, thank you for sharing your journey and insights with us.
Women Fitness President Ms. Namita Nayyar catches up with Monika Wierzbicka – an exceptionally talented and accomplished Polish Fitness Champion and fitness trainer for horseback riders. Here she talks about her fitness journey and the success story.
Namita Nayyar:
Your titles in the Polish Championship and Polish Cup are monumental achievements. What was the single most challenging part of your competitive career, and what did it teach you about yourself?
Monika Wierzbicka:
I think the hardest thing was balancing duties and work with preparations for competitions—the final stage of cutting before the events. I do not come from a wealthy family, so I had to work a lot to have the financial means to cover the preparations. I was often physically exhausted. I did not have sponsors for a long time, which is why I think it was difficult.
Namita Nayyar:
Many see the glamour of the stage. Can you describe the reality of a peak competition week—the physical and mental grind that the audience doesn’t see?
Monika Wierzbicka:
As I have already mentioned, the effort is immense. Intense strength training, in my case five times a week. On top of that, work and responsibilities, with the possibility of rest only on one day – Sunday. I maintained a very strict diet, allowing myself no deviations, counting every meal down to the gram. The reduction diet in the final week before the competition was the most important, as was the process of dehydrating the body to make the muscles more visible – the body’s fatigue was so great that due to the low level of body fat, there were sleep problems, which made recovery difficult, and consequently led to significant physical and mental fatigue.
Namita Nayyar:
You’ve transitioned from competitor to coach. How has your perspective on the bikini fitness world changed now that you’re guiding others through the process?
Monika Wierzbicka:
Nowadays, many people want to compete, but not everyone is aware of what it entails and not everyone is ready for such sacrifices. One must be able to distinguish between being a slim person and being in the shape necessary to compete in physique competitions. I think that because I have competed myself, it is easier for me to support my trainees and understand their struggles.
This interview is exclusive and taken by Namita Nayyar, President of womenfitness.net, and should not be reproduced, copied, or hosted in part or in full anywhere without express permission.
Disclaimer The Content is not intended to be a substitute for professional medical advice, diagnosis, or treatment. Always seek the advice of your physician or other qualified health provider with any questions you may have regarding a medical condition.