About Editorial team of BIPNs

Main team of content of bipns.com. Any type of content should be approved by us.
29 11, 2025

Solana Price Prediction: SOL Approaches Make-or-Break Resistance After Strong Bounce From $121

By |2025-11-29T06:04:03+02:00November 29, 2025|Crypto News, News|0 Comments

Solana price is edging into a decisive zone, holding key support while testing major resistance levels as ETF inflows and improving market structure hint at a potential upside continuation.

Solana price is slowly regaining momentum after a volatile week, with market structure stabilizing above short-term supports and institutional flows offering some early signs of relief. While sentiment across the broader crypto market remains mixed, SOL continues to show pockets of strength backed by ETF inflows, improving treasury activity, and gradual technical improvement on higher timeframes.

Even so, upside remains far from guaranteed. Solana now approaches a cluster of critical resistance levels that will determine whether this recovery attempt matures into a broader trend reversal or fades into another lower-high formation. With price hovering near the $140–$142 band, volatility is expected to increase.

Institutional Flows Create a Supportive Backdrop

One of the more notable developments comes from renewed demand on the institutional side. Ted Pillows highlighted how Solana-linked treasury companies are beginning to stabilize and show early recovery signs, a shift that aligns with steadily rising inflows into Solana ETFs. Bitwise’s SOL fund alone has absorbed more than $527 million in inflows since November 10.

Solana ETF inflows have surged past $527 million since November 10, highlighting steady institutional demand despite recent volatility. Source: Ted Pillows via X

This consistency of inflows doesn’t guarantee upside, but it does act as a buffer during pullbacks. If these inflows persist, Solana price prediction models tilt more favorably, especially heading into December, where historically liquidity improves across risk assets.

Technical Structure Approaches a Critical Test

From a charting perspective, Solana price is entering a decisive zone. Price has rebounded sharply from the $121–$122 demand region, an area where buyers stepped in aggressively, according to CryptoGemsCom. This bounce pushed SOL back towards the immediate resistance band at $144, which now becomes the level traders are watching for confirmation.

Solana Price Prediction: SOL Approaches Make-or-Break Resistance After Strong Bounce From 1

Solana has bounced strongly from the $121–$122 demand zone and is now retesting the critical $144 resistance area. Source: CryptoGemsCom via X

Meanwhile, ChiefraT’s chart places emphasis on the two recovery markers at $146.85 and $152.80, both aligning with key Fibonacci retracement levels. These zones previously triggered strong rejections, and a clean breakout through them would signal a meaningful shift in trend strength.

Technical Structure Approaches a Critical Test

Solana is now eyeing the $146.85 and $152.80 Fib resistance levels, key zones where previous rallies were rejected. Source: ChiefraT via X

Key Support and Resistance Levels to Watch

Support remains firmly established around $121–$126, where the most recent reversal originated. Losing this level would place SOL back into a vulnerable position, likely sending the price towards deeper liquidity pockets near $110.

Key Support and Resistance Levels to Watch

Solana current price is $139.50, down 2.05% in the last 24 hours. Source: Brave New Coin

On the upside, the first reaction zone rests at $144, followed by the more significant resistance confluence at $147–$153. This cluster aligns with both historical supply and Fibonacci retracements. Clearing this zone would open the path towards $165, the next major liquidity block from earlier this year.

If momentum accelerates, Solana price prediction scenarios extend towards the broader mid-range level at $180, a region that previously capped bullish expansions during Q2.

Macro Structure Suggests SOL Is Not Done Yet

Higher-timeframe structure presents an interesting case. Gordon’s long-range chart, rooted in a Wyckoff-style multi-phase progression, argues that Solana may still be sitting in the later stages of a large reaccumulation pattern. His model outlines a potential move back towards 320–$380 over the next market cycle, provided price maintains its structural supports and ETF inflows continue stabilizing demand.

Macro Structure Suggests SOL Is Not Done Yet

Solana may still be in a late-stage Wyckoff reaccumulation, with potential upside toward $320–$380 if structure holds. Source: Gordon via X

The broader takeaway is that while short-term volatility remains significant, SOL’s long-term narrative remains technically intact. Institutional flows, on-chain activity, and cyclical positioning all form part of the argument that SOL Solana price could still be building for a larger expansion phase in 2025.

Final Thoughts

Solana price is attempting an early recovery, backed by improving ETF inflows, stabilization across treasury-linked companies, and a constructive bounce from major demand levels. However, the next phase hinges entirely on whether SOL can reclaim the heavy resistance cluster between $144 and $153, a zone that has rejected the price multiple times.

Clearing this area would place Solana in a stronger position to retest mid-range targets around $165–$180, and potentially reopen discussions for higher-timeframe expansion later in the cycle. But until confirmation arrives, participants should remain cautious of lower-high formations and the possibility of another dip towards $121 if demand weakens.




Source link

29 11, 2025

6 Supplements That May Be Damaging Your Liver

By |2025-11-29T04:08:02+02:00November 29, 2025|Dietary Supplements News, News|0 Comments


  • Your liver helps filter toxins out of your body, but some supplements can cause liver damage.
  • Even though supplements are natural, they can still cause harm in your body.
  • Knowing the signs of liver damage, such as yellowing skin, can help you seek help faster.

As the largest internal organ, the liver carries out hundreds of vital functions that keep your body running smoothly. It is responsible for filtering toxins out of the blood, processing key nutrients, producing bile for fat digestion and metabolizing medications and foreign compounds. However, when it’s overloaded with harmful substances, it becomes vulnerable to inflammation and injury. Supplements, in particular, often contain high concentrations of compounds that can strain this hardworking organ. While they are often seen as a natural way to support health, experts caution that the six supplements below should be taken carefully to avoid potential liver damage.

1. Green Tea Extract

Green tea extract is widely sought after for its antioxidant and heart-protective properties, but concentrated supplements may do more harm than good. “Green tea extract (EGCG or epigallocatechin gallate) capsules can harm the liver at high doses,” says Vanessa Rissetto, M.S., RD, CDN. She explains that concentrated EGCG can generate immune reactions and oxidative stress in susceptible people, leading to liver inflammation and irritation that mirrors hepatitis. Instead, she recommends reaching for brewed tea, as it has much lower concentrations of EGCG. But if you prefer supplementation, she says, “keep EGCG from supplements 300 milligrams or less per day and avoid products delivering 800 mg or greater per day, which have been linked to liver enzyme elevations and injury.”

2. Vitamin A

Vitamin A plays an essential role in vision, immunity, skin health and cellular growth, but too much can quickly turn toxic—particularly when taken in supplement form. The type most likely to cause harm is retinol, the active form of vitamin A, which is often found in high doses in supplements. Unlike water-soluble vitamins that flush out the body easily, says Tara Durden, M.S., RDN, vitamin A is a fat-soluble vitamin that tends to build up in the liver when intake exceeds the body’s needs. She warns that when the liver becomes overburdened with vitamin A, it increases the risk of toxicity. As such, she recommends sticking to the safe dose of 1,000 to 5,000 IU per day and avoiding high doses greater than 10,000 IU to reduce the risk of acute vitamin A toxicity.

3. Niacin

Niacin, also known as vitamin B3, is often taken to manage high cholesterol. However, high doses can take a huge toll on the liver. “At nutritional levels, niacin is safe, but pharmacologic doses used for cholesterol (often 1 to 6 grams per day) can inflame the liver and cause jaundice,” says Rissetto. She highlights that sustained-release niacin supplements pose the highest risk. “Even supplements containing 500 mg or more can raise liver enzymes [a marker of liver stress or damage] in some users, and the risk climbs with grams-per-day dosing or switching formulations without supervision,” she emphasizes. For these reasons, the tolerable upper intake for adults is 35 mg or less per day. Rissetto cautions that prescription-strength use or any dose of 1,000 mg per day or more should only be taken under the guidance of a clinician.

4. Ashwagandha

Ashwagandha is a popular herbal supplement promoted for its stress-relieving and anxiety-reducing benefits. Although generally considered safe for short-term use, recent reports have linked some commercial herbal products claiming to contain ashwagandha to rare cases of liver injury. There have also been rare cases of liver injury and, in some instances, the need for a liver transplant in people with preexisting liver diseases and cirrhosis. The exact cause of liver toxicity is unknown, but some experts suspect that compounds in ashwagandha called withanolides are the main culprit. Typical amounts found in supplements range from 150 to 600 mg, taken one to three times per day. However, Durden recommends using the lowest effective dose. She also advises only taking the supplement for a short period of time, choosing third-party tested brands and seeking medical attention if symptoms of liver injury appear.

5. Kava

Kava is an herbal supplement that is typically used to promote relaxation and ease anxiety. However, depending on the dose and how it’s formulated, its calming effects can come at a serious cost to liver health. “Kava products, especially solvent extracts, have been tied to severe liver injury, including rare cases of liver failure,” warns Rissetto. She points out that these effects may be due to the herb’s toxic metabolites or its ability to deplete the liver’s antioxidant defenses. The risk of liver injury is even higher when the herb is taken with alcohol or other compounds that may harm the liver or if you have preexisting liver disease. To reduce the risk of liver damage, Rissetto recommends choosing water-extracted formulations made from the root of the plant, not exceeding 240 to 250 mg of kavalactones per day and only taking them short-term.

6. Black Cohosh

Though black cohosh is marketed as a natural remedy for menopause symptoms, such as hot flashes, night sweats and mood regulation, it doesn’t come without risk. “Black cohosh has been associated with idiosyncratic hepatitis [drug-induced liver injury] and, rarely, liver failure,” says Rissetto. She notes that the specific compound responsible for the effects on the liver isn’t known, so people with liver disease should avoid it, and any user who experiences adverse symptoms should stop taking the herb immediately. If you do choose to take black cohosh, she outlines that clinical studies often involve around 40 mg of extract daily. However, the safety of long-term use is uncertain, so it’s best to use the supplement on a short-term basis and pay close attention to any symptoms that may arise.

Signs and Symptoms of Liver Damage

If you’re taking any of the above supplements, both dietitians advise that you stop the supplement immediately and contact your health care provider if you notice the following signs and symptoms:

  • Jaundice: Yellowing of the skin or whites of the eyes
  • Dark urine: Particularly if it appears brown or like cola in color
  • Pale stools: White or gray stool is a sign of reduced bile flow
  • Abdominal pain or discomfort: Especially if it’s in the upper right side of your abdomen
  • Nausea, vomiting or loss of appetite: Seek medical attention if these symptoms persist
  • Itchy skin: This can be a sign of bile or toxin buildup
  • Fatigue: Especially if it’s profound or prolonged
  • Easy bruising: This occurs when your liver stops producing enough clotting factors that stop bleeding.

“Some people have no early symptoms, so blood test abnormalities (ALT/AST, bilirubin, INR) after starting a supplement also warrant stopping and evaluation,” adds Rissetto. Of all of the symptoms, Rissetto emphasizes that in drug- or supplement-induced liver injury, jaundice signals more severe disease and needs prompt attention.

Our Expert Take

Many people turn to supplements to boost their immune, mental, hormonal and overall health. However, herbal remedies and high-dose nutrients aren’t as harmless as they may seem. Supplements like vitamin A, niacin, green tea extract, kava, ashwagandha and black cohosh should be taken with caution, as they have all been linked to liver injury, inflammation and damage when taken in excess. 

Though the liver works tirelessly to filter out excess substances, it still has its limits. When those limits are crossed, symptoms like yellow skin and eyes, dark urine, fatigue, nausea, vomiting, loss of appetite, pale stools and itchy skin can arise. If you experience any of these symptoms, experts advise stopping supplementation and seeking medical attention immediately. After all, your body’s largest internal organ is counting on you to adhere to professional guidance and proper dosages to prevent long-term damage.


Source link

29 11, 2025

BTCUSD News Today, Nov 28: Will Bitcoin Hit $100K Amid Bull-Bear Impasse?

By |2025-11-29T04:02:06+02:00November 29, 2025|Crypto News, News|0 Comments

Bitcoin, a staple in the crypto market, is currently navigating through a period of mixed sentiments with its price hovering just above $91K. With the recent gains and impressive 11.39% year-to-date growth, Bitcoin’s potential to reach the $100K mark is captivating investors worldwide. Current dynamics reflect a complex interplay between bullish optimism and caution amid macroeconomic influences and holiday trading patterns. Much of the market’s next move hinges on a possible supply cluster breakout that could propel the BTC price rally significantly upward.

Current Dynamics in Bitcoin Pricing

As of today, Bitcoin is priced at $90,468.84, showing minimal change from the previous close. This price stability reflects a broader market pause, with Bitcoin exhibiting a 1.22% increase over the past five days. However, monthly performance depicts a 5.09% decrease, pointing to a fluctuating pattern that is typical for the world’s leading cryptocurrency. The question on every investor’s mind is whether Bitcoin can overcome these hurdles to hit the $100K milestone.

For Bitcoin to achieve further momentum, a supply cluster breakout is essential. Currently, Bitcoin’s relative strength index (RSI) stands at 38.70, indicative of a potential price reversal, while volatility remains marked by an ATR of 4558.31. Investors are closely watching these indicators to discern future movements. Latest discussions suggest varied opinions on how Bitcoin’s journey to $100K will unfold.

Influence of Macro Policy and Thanksgiving Patterns

Inflation concerns and recent policy statements from major central banks are adding layers of complexity to Bitcoin’s price prediction landscape. As the holiday season progresses, trading patterns often shift due to thinner volumes and holiday-related market closures. For Bitcoin, Thanksgiving has historically contributed to increased volatility, as investors reassess portfolios before year-end.

Bitcoin’s current volatility indicators, such as the Bollinger Bands indicating a range between $82,032.20 and $111,601.95, reflect potential price movements. This variability creates both opportunities and risks as traders speculate on Bitcoin’s path forward. The crypto market trends during this holiday period could be pivotal in pushing Bitcoin past psychological barriers.

Investor Sentiment and Market Outlook

Investors remain divided on Bitcoin’s immediate future. With a market cap of approximately $1.8 trillion, Bitcoin’s dominance continues to shape crypto market trends, yet its path to $100K is not assured. The strong trend indicated by an ADX of 44.62 suggests a persistent directional movement, though whether this is upwards to $100K or downwards remains an open question.

The oversold position indicated by an MFI of 14.04 could prompt buying activity, adding upward pressure to Bitcoin’s price. Market sentiment is also influenced by forecasts predicting Bitcoin reaching $100,096.72 monthly. However, the long-term forecast varies, indicating potential setbacks or slower gains.

Final Thoughts

The investment landscape for Bitcoin is teetering between optimism for a rally and caution due to current macroeconomic challenges. The short-term focus for investors lies in observing breakouts from supply clusters and watching volatility indices closely. Longer-term projections offer a promising glimpse into Bitcoin’s potential, buoyed by forecasts of substantial growth in the coming years.

With the volatility and price movement patterns surrounding Bitcoin, investors should remain vigilant. Staying informed of macroeconomic policies and significant market events is crucial for making strategic decisions. Platforms like Meyka, offering real-time insights and predictive analytics, can be instrumental in navigating this complex crypto market.

Ultimately, whether Bitcoin reaches $100K will depend on the broader economic environment, investor behavior, and technological advancements in the crypto sector.

FAQs

What factors are influencing Bitcoin’s potential to reach $100K?

Bitcoin’s journey towards the $100K mark is affected by supply cluster breakouts, macroeconomic policies, and seasonal trading patterns like Thanksgiving. Current stability at $91K and an 11.39% year-to-date increase highlight mixed market sentiments.

How does Bitcoin’s current technical analysis inform investors?

Technical indicators like an RSI of 38.70 and an ATR of 4558.31 highlight possible price reversals and volatility. These metrics are crucial for predicting Bitcoin’s price trajectory and potential breakout points.

Why is market sentiment divided on Bitcoin’s future?

While some investors anticipate a BTC price rally, challenges like economic uncertainties and policy impacts create hesitation. BTC’s oversold status suggests potential buying, yet risks remain significant, leading to mixed outlooks.

Disclaimer:

The content shared by Meyka AI PTY LTD is solely for research and informational purposes. 
Meyka is not a financial advisory service, and the information provided should not be considered investment or trading advice.

Source link

29 11, 2025

XAU/USD remains firm with $4,140 holding bears

By |2025-11-29T02:40:05+02:00November 29, 2025|Forex News, News|0 Comments


Gold (XAU/USD) keeps crawling higher, and is on track to close the week 2.7% higher, with the US Dollar weighed by rising bets of Fed monetary easing. XAU/USD has been capped at $4,190 earlier on Friday, as the US Dollar picked up in a calm Thanksgiving session, but downside attempts remain limited above $4,140 so far.

The US Dollar Index, which measures the value of the US Dollar against a basket of six currencies, is picking up from lows on Friday, favoured by a mild rebound in US Treasury yields, but it remains on track for its worst weekly performance in months. 

Dovish comments from Fed officials and weak US consumption figures have prompted investors to ramp up hopes of a Fed rate cut in December, which has sent US Treasury yields and the US Dollar tumbling this week.

Technical Analysis: Bulls are focusing on the $4,245 level

XAU/USD 4-Hour Chart

The technical picture remains positive. The 4-hour Relative Strength Index is trending higher, reaching levels past 60, and the Moving Average Convergence Divergence (MACD) has turned up and is crossing the signal line, highlighting growing bullish pressure.

The move above $4,100 confirmed that the bearish correction from the November peak is over, and bulls have shifted their focus to the November 14 high, at $4,210, on track for November’s peak, at $4,245.

On the downside, the mentioned $4,140 support (November 27 low) keeps the bullish trend in play. A bearish reaction below here brings the  November 25 low, near $4,100, to the focus, ahead of the November 21 and 24 lows between $4.025 and $4,040.

US Dollar Price This week

The table below shows the percentage change of US Dollar (USD) against listed major currencies this week. US Dollar was the strongest against the Japanese Yen.

USD EUR GBP JPY CAD AUD NZD CHF
USD -0.41% -0.81% -0.22% -0.42% -0.99% -1.60% -0.25%
EUR 0.41% -0.39% 0.20% -0.02% -0.60% -1.20% 0.16%
GBP 0.81% 0.39% 0.58% 0.38% -0.21% -0.80% 0.56%
JPY 0.22% -0.20% -0.58% -0.22% -0.84% -1.52% -0.03%
CAD 0.42% 0.02% -0.38% 0.22% -0.58% -1.18% 0.18%
AUD 0.99% 0.60% 0.21% 0.84% 0.58% -0.59% 0.80%
NZD 1.60% 1.20% 0.80% 1.52% 1.18% 0.59% 1.38%
CHF 0.25% -0.16% -0.56% 0.03% -0.18% -0.80% -1.38%

The heat map shows percentage changes of major currencies against each other. The base currency is picked from the left column, while the quote currency is picked from the top row. For example, if you pick the US Dollar from the left column and move along the horizontal line to the Japanese Yen, the percentage change displayed in the box will represent USD (base)/JPY (quote).


Source link

29 11, 2025

Green tea benefits: Can green tea really help reduce blood pressure? Here’s what nutritionists reveal

By |2025-11-29T02:07:03+02:00November 29, 2025|Dietary Supplements News, News|0 Comments


Green tea is widely recognized for its potential heart and blood pressure advantages. Rich in antioxidants called catechins, it may help to maintain flexible blood vessels, aids healthy circulation, and lowers inflammation over time. While sipping a cup of green tea can offer a calming ritual, experts warn that excessive intake or concentrated supplements may result in side effects or interact with medications. Knowing how to consume green tea safely and effectively can maximize its cardiovascular and overall health benefits.

What Compounds in Green Tea Support Heart Health?

“One compound in particular, epigallocatechin gallate (EGCG), boosts nitric oxide and promotes vasodilation, helping your blood vessels relax,” states Bess Berger, RDN.

When blood vessels relax, or vasodilate, blood pressure decreases, a temporary impact that can enhance circulation.

“While catechins are one type of tea polyphenol, the blood pressure–lowering effects of green tea are probably attributable to a combination of all of the plant compounds it contains instead of an individual few,” cites Qianzhi Jiang, Ph.D., RDN.

How Does Green Tea Affect Blood Pressure in the Short and Long Term?

Research indicates that green tea may help to reduce blood pressure in both healthy people and those with hypertension, though findings vary and further long-term research is needed. While it relaxes blood vessels temporarily, its biggest benefit may lie in long-term protection. The same polyphenols that offers green tea its antioxidant power also defend arteries against oxidative stress and low-grade inflammation, major contributors to increasing blood pressure over time.


“Green tea’s catechins support blood vessel health by reducing inflammation and improving how your vessels function,” states Devon Golem, Ph.D., RD, LDN.With time, this changes to more elastic arteries that expand and contract effectively, supporting the heart pump blood with less strain.

Caffeine Considerations

Green tea contains less caffeine than coffee, almost 30 mg per 8-ounce cup when compared to 95 mg in coffee but it can still result in a temporary elevation in blood pressure.

“If you’re super-sensitive to caffeine, green tea could cause a temporary bump in blood pressure right after drinking it,” says Berger.

For most individuals, this short-term raise doesn’t outweigh green tea’s long-term cardiovascular advantages. Decaffeinated choices are available for those who are particularly caffeine sensitive while still providing antioxidant benefits.

How Much Green Tea Is Recommended

There’s no official guideline, but most researchers used three to four cups each day. Longer-term use, more than three months, showcased greater reductions in blood pressure.

“The majority of the studies used three to four cups of green tea daily, and greater reductions in blood pressure were observed with longer use—more than three months,” describes Jiang.

Are There Any Safety Concerns?

Moderate brewed green tea is normally safe, but concentrated green tea extracts might result in side effects such as nausea, abdominal discomfort, or even increase blood pressure. Green tea extracts may also impact with some medications that include beta-blockers such as nadolol or other heart and cholesterol drugs. People consuming these medications should consult their healthcare expert before taking large amounts or extracts.

Disclaimer: This article is intended for informational and educational purposes only and is not a substitute for professional medical advice. Consult your healthcare provider before making major changes to your diet, especially if you have existing medical concerns.

FAQs:

Q1. What is green tea?
Green tea is a drink made from unfermented tea leaves, packed in antioxidants. It has been connected to several health advantages, including cardiovascular support.

Q2. How does green tea affect blood pressure?
Green tea may help to relax blood vessels and enhance circulation, temporarily reducing blood pressure. Long-term advantages are likely due to its anti-inflammatory and antioxidant properties.


Source link

29 11, 2025

Bitcoin Whale Sell-Off Jolts Market as DeepSnitch AI Presale Price Soars 65%

By |2025-11-29T02:01:08+02:00November 29, 2025|Crypto News, News|0 Comments

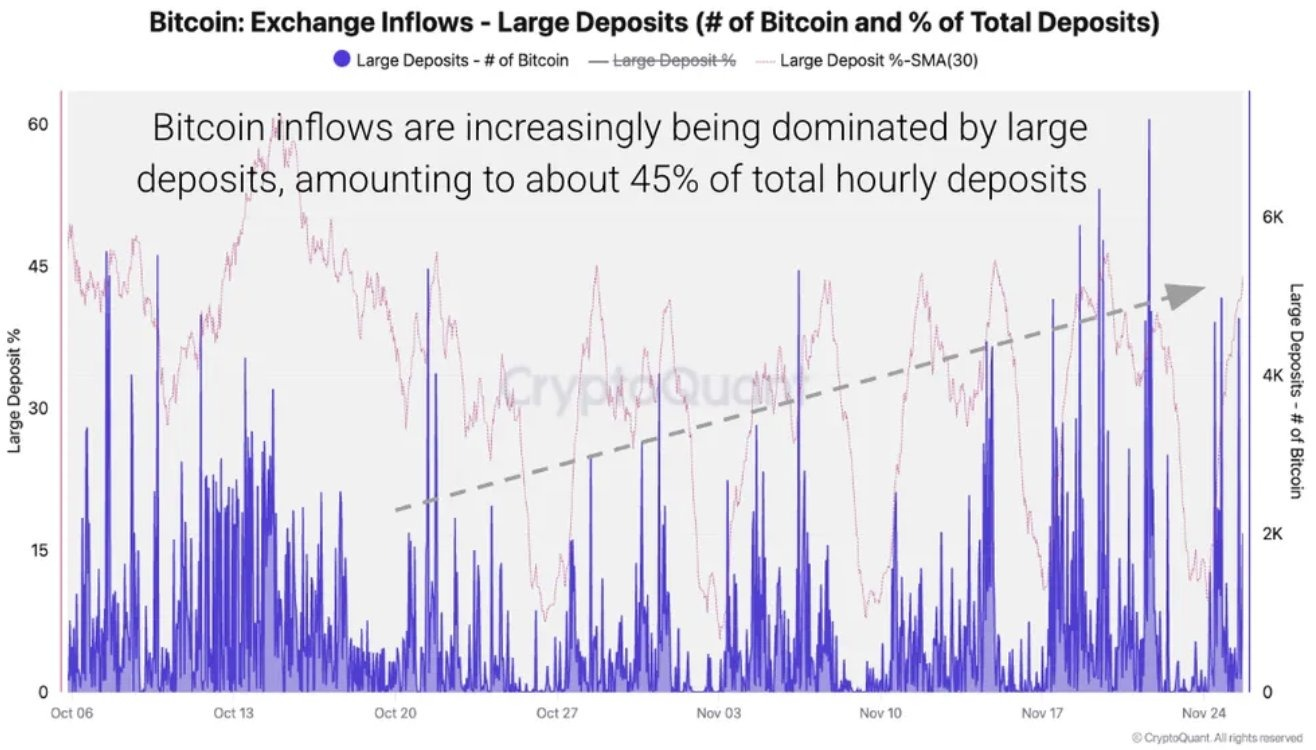
Bitcoin whales are back in the spotlight after dumping over 9,000 BTC onto exchanges in a single day. The move sent shockwaves through the market, with CryptoQuant analysts saying it was the reason Bitcoin fell to $80,600 on Nov. 21, its lowest price in seven months. Analysts are warning of more downside as whale inflows remain high and stablecoin reserves swell on major exchanges like Binance.

With fear rising and majors losing steam, the attention is shifting to high-upside altcoins. Traders are scanning for assets with room to move, which is why in this article, we’ll take a look at the 3 altcoins that could go the furthest: DeepSnitch AI, NEAR, and the Dogecoin price prediction.

Of the 3, DeepSnitch AI looks to have the most upside. Its price of $0.02527 is up 65% since its initial offering, and it’s already raised more than $600k in stage 2 fundraising, showing very strong early demand. That’s why some believe it could become the next 100x coin when price discovery hits in January 2026.

Dogecoin price prediction in 2026 dampens as BTC turns bearish

Bitcoin took a major hit on Nov. 21 after over 9,000 BTC was deposited into exchanges in a single day, one of the largest whale moves of the year. Analysts at CryptoQuant linked the action to Bitcoin’s steep drop to $80,600, marking its lowest price in seven months. With stablecoin reserves hitting an all-time high of $51 billion on Binance, traders appear to be exiting volatile positions and rotating into safer assets.

Bitcoin Whale Sell-Off Jolts Market as DeepSnitch AI Presale Price Soars 65%For investors, this signals a shift in strategy. Risk appetite is fading, and many are pulling back from large caps like BTC in favor of assets with asymmetric upside. As majors bleed, the opportunity window is opening for select altcoins and presales with strong fundamentals, working products, and low entry points. Here are the 3 that could go far in 2026 as Dogecoin price prediction remains weak.

DeepSnitch AI price prediction: Could this AI-powered tool have saved your portfolio?

When whales dumped 9,000 BTC on Nov. 21, the price of Bitcoin collapsed fast. But for retail traders, the warning signs weren’t obvious until it was too late.


Which is exactly the problem that DeepSnitch AI is trying to solve. This presale project is already live with a suite of AI-powered tools to help traders spot whale moves, liquidity shifts, and early rug-pull signals, before the rest of the market catches on.

In short, had you been using DeepSnitch AI before November 21, you might have been able to pull out before the market crashed.

What’s more, DeepSnitch AI is one of the few projects releasing products in a market defined by high volatility. While Bitcoin and the rest of the markets bleed, DeepSnitch AI provides real-world value, a key selling point sure to make early investors happy when the token goes to market in January 2026.

Over $600,000 has already been raised in Stage 2, and the token is priced at just $0.02527, up 64% from the initial offering, making this the best 100x potential token for 2026.


NEAR Protocol price prediction: Sharp pullback of 18%

NEAR Protocol has seen a sharp pullback, dropping over 18% in the past 7 days to around $1.92 as of November 27th, underperforming the broader market. The dip comes despite recent bullish coverage naming NEAR among the top AI crypto picks for 2025, partly fueled by Foxconn’s $3 billion commitment to AI infrastructure.

Still, the long-term NEAR forecast remains optimistic thanks to its focus on user-owned AI and chain abstraction technology. If sentiment stabilizes, some traders expect NEAR could recover toward the $2.50 – $3.00 range, with stronger moves possible if broader AI narratives return to the spotlight.

However, one concern among traders is that most of NEAR’s upside is already gone, unlike DeepSnitch AI, which is still in its early-stage pricing phase.

Dogecoin price prediction shows mild weakness

Dogecoin’s price prediction is showing mild weakness this week, down 1.4% over the past 7 days to around $0.154. Despite the dip, sentiment around DOGE remains active following the debut of two spot Dogecoin ETFs, one from Bitwise and another from Grayscale. While volume came in lower than expected, the listings are seen as a step toward further institutional access.

Still, meme momentum remains the key driver. Without a fresh Elon Musk Dogecoin update or other catalyst, upside may be limited in the short term. Current resistance sits near $0.16, with analysts watching for a breakout to signal renewed strength in the Dogecoin price prediction. Those looking for greater upside, however, are turning to smaller projects like DeepSnitch AI that have the potential to go 100x or more in 2026.

What’s the verdict?

With whales dumping and the markets looking jittery, most tokens are drifting sideways or worse. That’s certainly true for Hyperliquid and our Dogecoin price prediction, but not for DeepSnitch AI, whose price of $0.02527 is up 65%.

And with over $600k in early fundraising, it’s clear that investor demand is rapidly surging. When DeepSnitch AI hits the markets in January 2026, it could easily go 300x or more.

Visit the official website for more information, and join X and Telegram for community updates.

FAQs

How high will Doge go in 2025?

Most Dogecoin price predictions put it between $0.18 – $0.30, depending on social hype and broader market trends. However, many believe DeepSnitch AI offers a stronger upside and real-world use.

Will Doge reach $10?

Without a major surge in adoption or a renewed Elon Musk Dogecoin update, reaching $10 is highly unlikely.

How high can Doge go realistically?

Many see upside capped unless new catalysts like an Elon Musk Dogecoin update emerge. The current Dogecoin price prediction is not optimal, given the broader crypto sentiment.

Source link

29 11, 2025

XAG/USD hits record $56 as bulls dominate

By |2025-11-29T00:39:02+02:00November 29, 2025|Forex News, News|0 Comments


Silver (XAG/USD) climbs to a fresh all-time high on Friday, buoyed by dovish Federal Reserve (Fed) expectations alongside strong industrial and investment demand. At the time of writing, XAG/USD is trading around $56.40, with prices up over 12% this week and on track to log a seventh straight monthly gain.

A tightening supply backdrop is adding further support to the rally, with reports indicating that inventories at Shanghai Futures Exchange warehouses have dropped to their lowest level since 2015. Market data also show that physical Silver turnover on the Shanghai Gold Exchange has slipped to a nine-year low.

According to the Silver Institute, 2025 is on track to mark the fifth consecutive year of a structural supply deficit, with global output from mining and recycling still struggling to keep pace with rising demand from solar, electronics and investment channels.

From a technical standpoint, bulls remain firmly in control, driving XAG/USD deeper into uncharted territory after a clean breakout from the falling-wedge formation. The rally comes after a period of subdued momentum, marking a clear shift back in favour of upward continuation.

XAG/USD continues to trade comfortably above all major moving averages, reinforcing the strength of the prevailing uptrend. The 21-day Simple Moving Average (SMA) near $50.72 is rising steadily and remains the first layer of dynamic support, while the 50-day and 100-day SMAs sit much lower.

On the downside, any pullback is likely to attract fresh dip-buying interest, with initial support at the $55.00-$54.00 zone. A break below this area would shift attention toward the $50.70-$50.00 region, reinforced by the rising 21-day SMA.

Momentum indicators support the bullish narrative. The Moving Average Convergence Divergence (MACD) extends above the Signal line, with both in positive territory and a widening histogram, suggesting strengthening bullish momentum. The Relative Strength Index (RSI) has climbed to 71, entering overbought territory, although there are no clear signs of exhaustion.

Silver FAQs

Silver is a precious metal highly traded among investors. It has been historically used as a store of value and a medium of exchange. Although less popular than Gold, traders may turn to Silver to diversify their investment portfolio, for its intrinsic value or as a potential hedge during high-inflation periods. Investors can buy physical Silver, in coins or in bars, or trade it through vehicles such as Exchange Traded Funds, which track its price on international markets.

Silver prices can move due to a wide range of factors. Geopolitical instability or fears of a deep recession can make Silver price escalate due to its safe-haven status, although to a lesser extent than Gold’s. As a yieldless asset, Silver tends to rise with lower interest rates. Its moves also depend on how the US Dollar (USD) behaves as the asset is priced in dollars (XAG/USD). A strong Dollar tends to keep the price of Silver at bay, whereas a weaker Dollar is likely to propel prices up. Other factors such as investment demand, mining supply – Silver is much more abundant than Gold – and recycling rates can also affect prices.

Silver is widely used in industry, particularly in sectors such as electronics or solar energy, as it has one of the highest electric conductivity of all metals – more than Copper and Gold. A surge in demand can increase prices, while a decline tends to lower them. Dynamics in the US, Chinese and Indian economies can also contribute to price swings: for the US and particularly China, their big industrial sectors use Silver in various processes; in India, consumers’ demand for the precious metal for jewellery also plays a key role in setting prices.

Silver prices tend to follow Gold’s moves. When Gold prices rise, Silver typically follows suit, as their status as safe-haven assets is similar. The Gold/Silver ratio, which shows the number of ounces of Silver needed to equal the value of one ounce of Gold, may help to determine the relative valuation between both metals. Some investors may consider a high ratio as an indicator that Silver is undervalued, or Gold is overvalued. On the contrary, a low ratio might suggest that Gold is undervalued relative to Silver.


Source link

29 11, 2025

XRP Price Prediction: Can XRP Convert Long-Term Demand Into a Full Trend Reversal Toward $7?

By |2025-11-29T00:00:05+02:00November 29, 2025|Crypto News, News|0 Comments

XRP price is once again testing investor conviction as long-term demand, institutional ETF momentum, and unresolved regulatory questions converge at a pivotal technical inflection point for the digital asset.

XRP price today is stabilizing near historically significant support after months of structural consolidation, prompting market analysts to reassess whether the current setup can transition from range-bound trading into a sustained long-term uptrend.

Long-Term XRP Chart Reveals Macro Market Structure

The current market assessment is based on the XRP/USD 2-week chart spanning 2014 to 2025, a timeframe commonly used by professional analysts to smooth short-term volatility and identify primary market cycles. On this macro chart, XRP previously formed a rounded top distribution pattern after multiple failed attempts to break above declining resistance.

The XRP/USD 2-week chart shows a pre-2017–style fractal structure, leading to a speculative long-term $7+ target that remains probabilistic, not guaranteed. Source: Cryptollica on TradingView

A rounded top typically reflects gradual distribution by long-term holders, often followed by a prolonged accumulation phase before any major trend reversal develops. XRP’s current price structure shows the asset now trading inside a long-term demand zone that previously supported multiple historical rebounds.

“This is the same price region where macro buyers stepped in during prior corrections,” one technical analyst noted in a recent market briefing, adding that sustained price acceptance within this zone is critical for any high-timeframe reversal.

ETF Activity and Institutional Interest Shape XRP Market Dynamics

Beyond technical signals, XRP’s latest news continues to be shaped by fast-moving institutional developments. According to publicly available filings tracked by the U.S. Securities and Exchange Commission, nearly 20 XRP-related ETF applications are currently under regulatory review, placing XRP behind only Bitcoin and Solana in total filings.

Bloomberg Intelligence ETF analyst Eric Balchunas recently stated that XRP ETFs are “moving through the regulatory pipeline at an unusually fast pace,” reflecting accelerating issuer interest.

Meanwhile, Matt Hougan, Chief Investment Officer at Bitwise, has estimated that a spot XRP ETF could attract more than $1 billion in assets within months of approval, driven by sustained global retail demand and active trading participation.

Early institutional products launched by Grayscale, Franklin Templeton, Bitwise, and Canary have already seen tens of millions of XRP absorbed in single trading sessions.

At the same time, on-chain data from major tracking platforms shows that over 430 million XRP have moved off centralized exchanges in recent days, tightening liquid supply and increasing the potential for price volatility during high-volume trading periods.

Key Technical Levels Defining XRP Price Outlook

From a structural standpoint, analysts identify $1.80 as XRP’s most significant long-term support, a zone where price previously rebounded sharply amid heavy accumulation. This level also aligns with historical demand visible on high-timeframe charts.

On the upside, resistance currently concentrates between $2.30 and $2.40, making this range the most important near-term breakout threshold. A confirmed high-volume close above this zone could expose the next major technical objective between $2.95 and $3.10, referred to as a macro rejection zone, where sellers previously overwhelmed buyers.

XRP Price Prediction: Can XRP Convert Long-Term Demand Into a Full Trend Reversal Toward ?

XRP is at a macro inflection point, having completed a rounded top distribution and retested long-term demand, setting up potential bullish or bearish pathways based on higher-timeframe confirmation. Source: Scaling mastery on TradingView

For less-experienced readers, a “macro rejection zone” simply refers to a historical price area where rallies repeatedly stalled. Reclaiming such a zone often signals a shift in long-term market control.

Failure to hold current demand, however, could push XRP back toward its rising long-term trendline for further accumulation before any breakout attempt resumes.

Can XRP Realistically Reach $7?

The widely discussed $7 XRP price target is derived from proportional comparisons to XRP’s last full bull-market cycle. From a statistical perspective, a move from $2 to $7 would require a 5× expansion, which is modest relative to XRP’s prior multi-hundred-fold cycle growth.

Can XRP Realistically Reach $7?

A recent bullish XRP/USDT chart projects a potential breakout from ~$2.20 to $7, suggesting a new all-time high by Q1 2026, while analyst forecasts range from $2.29 to $18 amid SEC case developments and XRP Ledger adoption. Source: TOP GAINER TODAY via X

However, professional analysts emphasize that several verifiable conditions would likely need to align:

  • A final regulatory resolution of the ongoing XRP SEC lawsuit

  • Sustained growth in global crypto market liquidity

  • Continued capital rotation from Bitcoin into large-cap altcoins

  • Expansion of real-world asset (RWA) tokenization on the XRP Ledger

  • Regulatory clarity across U.S., EU, and Asian markets

Without these systemic drivers, price models suggest that $7 remains a long-term probabilistic scenario, not a near-term expectation.

XRP at a Structural Turning Point

From a macro-technical perspective, XRP is currently positioned at what analysts describe as a long-term inflection zone. The asset has completed a multi-month distribution cycle, fully retested historical demand, and is now attempting to establish a base for directional expansion.

Two primary scenarios remain in focus:

  • Bullish case: Reclaim of the $3 region followed by a gradual multi-quarter trend expansion.

  • Bearish case: Demand failure leading to deeper accumulation before any major bullish phase.

As one institutional technical strategist summarized, “This structure does not generate a trade signal by itself, but it defines where both opportunity and risk are clearly visible.”

Final Thoughts

XRP price today reflects a market in transition rather than one in confirmed breakout mode. ETF developments, tightening exchange supply, and gradual legal clarity all act as meaningful structural drivers. At the same time, overhead resistance, global liquidity conditions, and regulatory timelines continue to shape XRP’s recovery path.

Final Thoughts

XRP was trading at around 2.19, up 0.66% in the last 24 hours at press time. Source: XRP price via Brave New Coin

While the question of whether XRP can reach $7 remains open, current market evidence suggests that the outcome will depend less on short-term volatility and more on sustained institutional adoption, regulatory resolution, and long-term utility growth.

For now, XRP remains positioned at a critical crossroads—where structure, regulation, and capital deployment converge to define its next major phase.

Source link

28 11, 2025

GameFi News: Web3 Gaming Tokens Rally, Pump Game Inks Partnerships

By |2025-11-28T22:44:11+02:00November 28, 2025|News, NFT News|0 Comments


Altcoins are shaking off the recent bearish phase with modest gains.

  • Pi Network invests in gaming.
  • GameFi rebounds in line with the market.
  • Web3 gaming’s trading volume pumps +100%.
Is the crypto market turning a new leaf after a few weeks of down-only? Bitcoin is holding the $91K level like a champ as it finishes the week with an 11% gain, thanks to improving risk sentiment.

https://twitter.com/CoinMarketCap/status/1994175172807377267

However, analysts are cautiously optimistic as a downtrend still looms, even though JP Morgan filed to offer Bitcoin-backed structured notes.

https://twitter.com/Scaramucci/status/1993690114807955576

Will the Fed deliver a rate cut at its December meeting to give the market the fuel it needs to rally again?

https://twitter.com/wiseadvicesumit/status/1994364747920400752

Altcoins are shaking off the recent bearish phase with modest gains. The leading GameFi tokens are leading the way, with many printing green candles. SLIMEX (SLX) stood out above the top dogs with a 53% uptick.

Let’s unpack what drove the GameFi sector this week.

  • Pi Network has teamed up with CiDi Games to bring Pi-powered gameplay to tens of millions of users and boost real-world utility across its ecosystem. Backed by Pi Network Ventures, the partnership signals a serious commitment to gaming at scale.

https://twitter.com/PiCoreTeam/status/1993755066172362991

  • EdgeAI Labs partnered with Pump Game as the upgraded platform moves to BNB Chain and rolls out AI-powered, NFT-driven, multi-chain gaming tools.

https://twitter.com/pumpdotgame/status/1993939132968820784

Additionally, Pump Game is stepping into AI Ville World, a multi-chain platform that fuses NFTs, gaming, and AI into one powerful service hub. It delivers end-to-end tools for gamers, guilds, and developers building the next wave of Web3 games.

https://twitter.com/aivillebot/status/1994300228716093855

GameFi Sector Review

Degens are back in the game, with GameFi’s market cap rising 7% to close in on $10 billion. Trading volume exploded 103% to $6.1 billion. Is liquidity returning to the sector?

The trenches are coming out of their hibernation as Crypto’s Fear and Greed Index moved from last week’s Extreme Fear (11) to Fear territory (20). We are still not yet out of the woods, though!

https://twitter.com/coinbureau/status/1994290157055569934

Top Gainers

Top Decliners

The week ended with Web3 gaming in 16th position on DeFiLlama’s narrative tracker, but the big win is that all sectors closed the week in the money.

Web3 Gaming News This Week

Animoca’s Next Frontier in Web3

Animoca Brands is gearing up for a wider Web3 push in 2026 as it expands from gaming into AI, DePIN, DeFi, and stablecoin-powered opportunities. With gaming still its strongest pillar, the company is positioning itself to drive new momentum across GameFi.

https://x.com/WuBlockchain/status/1994252588485943362

What You Can Do Now

  • Hold off on scaling positions and wait for the market to settle
  • Monitor key macro signals that can redirect market momentum
  • Check CMC’s Fear and Greed Index to stay aligned with sentiment

This article contains links to third-party websites or other content for information purposes only (“Third-Party Sites”). The Third-Party Sites are not under the control of CoinMarketCap, and CoinMarketCap is not responsible for the content of any Third-Party Site, including without limitation any link contained in a Third-Party Site, or any changes or updates to a Third-Party Site. CoinMarketCap is providing these links to you only as a convenience, and the inclusion of any link does not imply endorsement, approval or recommendation by CoinMarketCap of the site or any association with its operators. This article is intended to be used and must be used for informational purposes only. It is important to do your own research and analysis before making any material decisions related to any of the products or services described. This article is not intended as, and shall not be construed as, financial advice. The views and opinions expressed in this article are the author’s [company’s] own and do not necessarily reflect those of CoinMarketCap.


Source link

28 11, 2025

Palo Alto price returns lower – Forecast today

By |2025-11-28T22:38:10+02:00November 28, 2025|Forex News, News|0 Comments


Palo Alto Networks (PANW) resumed its decline in its latest intraday trading, pressured by continued negative momentum resulting from trading below its previous 50-day SMA. This confirms the break of a main medium-term ascending trendline, which further intensifies the bearish pressure surrounding the price, especially after it successfully relieved part of its oversold saturation on the RSI indicators.


Therefore we expect the stock to decline in its upcoming trading, as long as it remains below the resistance level of $193.10, targeting the support level of $172.75.


Today’s price forecast: Bearish


Source link

Go to Top