About Editorial team of BIPNs

Main team of content of bipns.com. Any type of content should be approved by us.
16 10, 2025

XAU/USD rallies further to near $4,240 due to multiple tailwinds

By |2025-10-16T16:16:50+03:00October 16, 2025|Forex News, News|0 Comments


Gold price (XAU/USD) extends its rally to near $4,240 during the European trading session on Thursday. The precious metal continues to move higher amid firm Federal Reserve (Fed) dovish bets and ongoing trade tensions between the United States (US) and China.

Traders are increasingly confident that the Fed will loosen monetary conditions further amid growing concerns over US labor market conditions.

According to the CME FedWatch tool, traders see a 94.6% that the Fed will reduce interest rates by 50 basis points (bps) to 3.50%-3.75% in the remaining year.

Meanwhile, Federal Open Market Committee (FOMC) members, including Chair Jerome Powell, have also warned on downside labor market risks. On Tuesday, Fed’s Powell stated that “downside risks to the US job market have risen”, which justified the rate cut decision in September.

Theoretically, lower interest rates by the Fed bode well for non-yielding assets, such as Gold.

On the global front, escalating US-China trade frictions are also supporting the Gold price’s rally. Lately, US President Donald Trump announced additional 100% tariffs on China over Beijing’s export controls on rare earths and magnets.

The scenario of geopolitical tensions improves the appeal of safe-haven assets, such as Gold.

Gold technical analysis

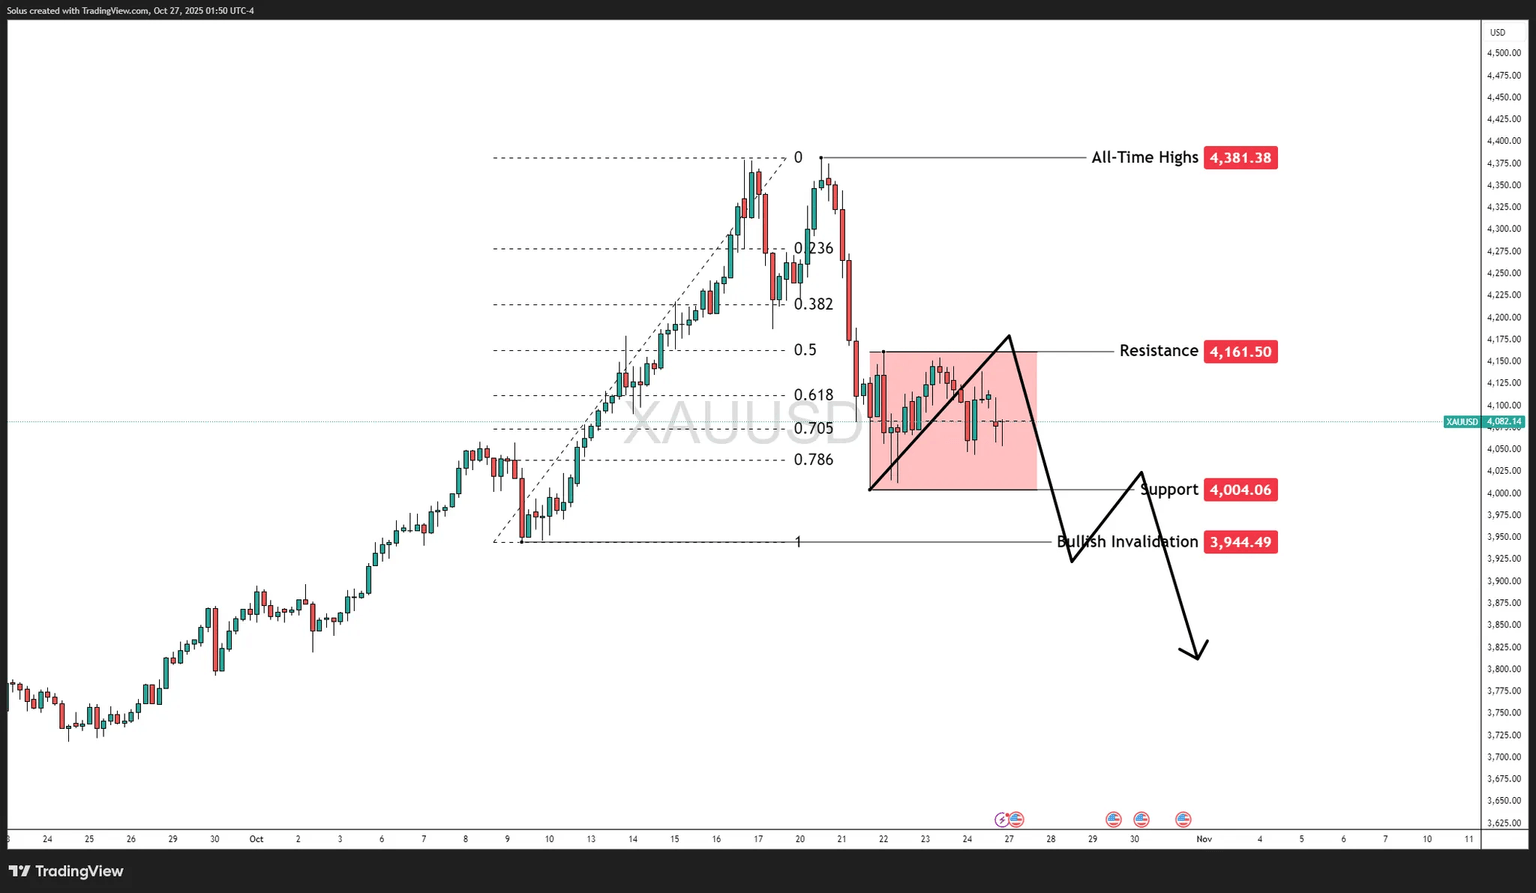
Gold price posts a fresh all-time high near $4,246 on Thursday. The overall trend of the Gold price remains bullish as the 20-day Exponential Moving Average (EMA) slopes higher around $3,950.15. The upward-sloping trendline from the August 22 low around $3,321.50 will act as key support for the Gold price.

The 14-day Relative Strength Index (RSI) stays above 60.00 for a long period, suggesting a strong bullish momentum.

On the upside, the Gold price could extend its upside towards $4,300. Looking down, the psychological level of $4,000 would act as key support.

Gold daily chart

Gold FAQs

Gold has played a key role in human’s history as it has been widely used as a store of value and medium of exchange. Currently, apart from its shine and usage for jewelry, the precious metal is widely seen as a safe-haven asset, meaning that it is considered a good investment during turbulent times. Gold is also widely seen as a hedge against inflation and against depreciating currencies as it doesn’t rely on any specific issuer or government.

Central banks are the biggest Gold holders. In their aim to support their currencies in turbulent times, central banks tend to diversify their reserves and buy Gold to improve the perceived strength of the economy and the currency. High Gold reserves can be a source of trust for a country’s solvency. Central banks added 1,136 tonnes of Gold worth around $70 billion to their reserves in 2022, according to data from the World Gold Council. This is the highest yearly purchase since records began. Central banks from emerging economies such as China, India and Turkey are quickly increasing their Gold reserves.

Gold has an inverse correlation with the US Dollar and US Treasuries, which are both major reserve and safe-haven assets. When the Dollar depreciates, Gold tends to rise, enabling investors and central banks to diversify their assets in turbulent times. Gold is also inversely correlated with risk assets. A rally in the stock market tends to weaken Gold price, while sell-offs in riskier markets tend to favor the precious metal.

The price can move due to a wide range of factors. Geopolitical instability or fears of a deep recession can quickly make Gold price escalate due to its safe-haven status. As a yield-less asset, Gold tends to rise with lower interest rates, while higher cost of money usually weighs down on the yellow metal. Still, most moves depend on how the US Dollar (USD) behaves as the asset is priced in dollars (XAU/USD). A strong Dollar tends to keep the price of Gold controlled, whereas a weaker Dollar is likely to push Gold prices up.


Source link

16 10, 2025

EUR/USD Analysis 16/10: Short-Term Reversal Looming? (Chart)

By |2025-10-16T16:15:42+03:00October 16, 2025|Forex News, News|0 Comments

EUR/USD Analysis Summary Today

  • General Trend: Bearish.
  • Today’s Support Points for EUR/USD: 1.1600 – 1.1560 – 1.1480.
  • Today’s Resistance Points for EUR/USD: 1.1680 – 1.1730 – 1.1800.

EUR/USD Trading Signals:

  • Buy EURUSD from the support level of 1.1550, target 1.1780, and stop 1.1470.
  • Sell EURUSD from the resistance level of 1.1760, target 1.1500, and stop 1.1820.

Technical Analysis of EUR/USD Today:

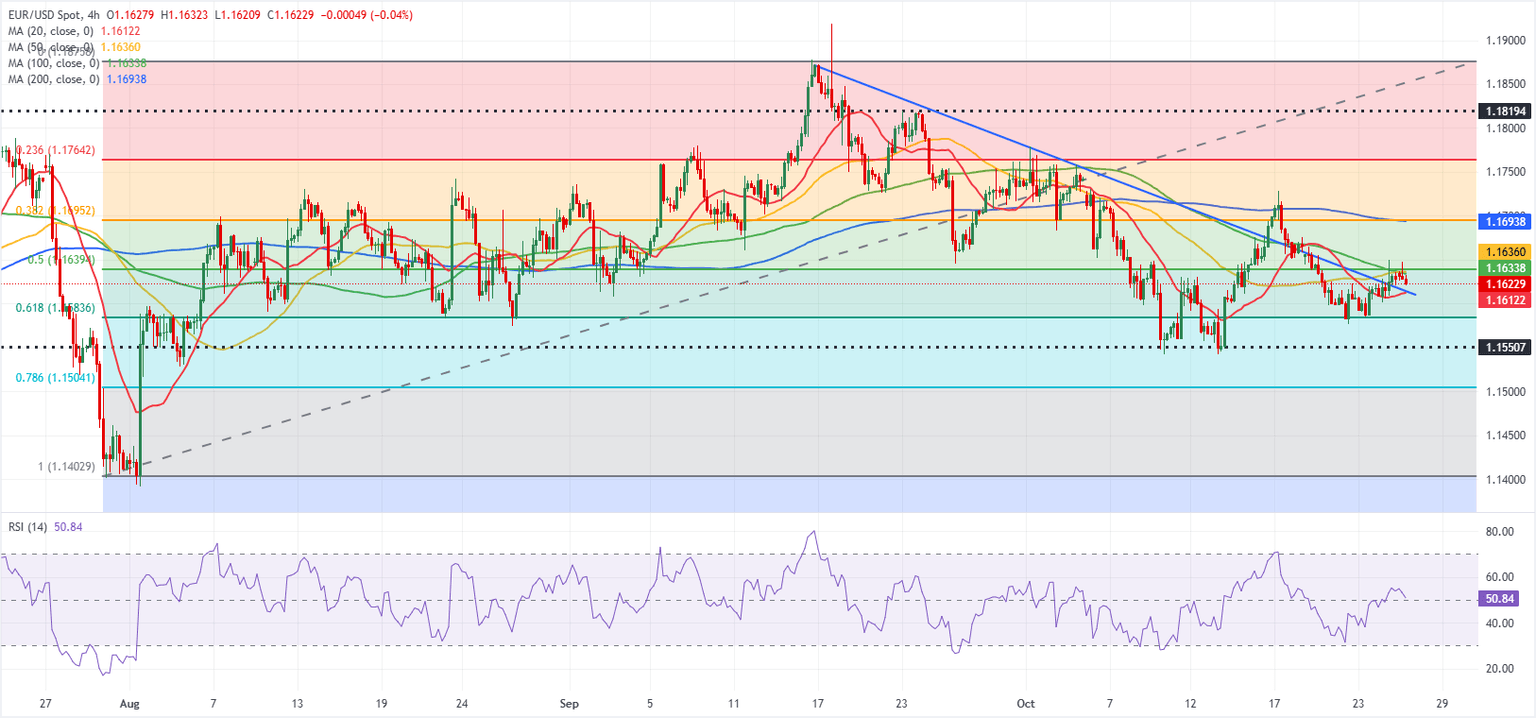
Based on recent trading, the EUR/USD pair has formed a double bottom pattern on the short-term chart, suggesting the possibility of a reversal from the previous bearish trend. Across trading company platforms, the Euro/Dollar pair appears to be testing the neckline resistance at the key psychological level of 1.1600, and a breakout of this area could confirm a shift in direction. If the neckline is successfully broken, the EUR/USD pair could rise by the same height as the double bottom formation. However, the price may encounter resistance from the nearby descending trend line and the dynamic pivot point of the 100 Simple Moving Average (SMA), which could trigger a pullback before the upward trend gains momentum.

At the same time, the indicated area of interest on the chart shows where sellers could take a stand, but continued buying pressure outside this area suggests buyers are ready to take control. A strong break above the descending trend line and the moving averages could pave the way for a move towards higher levels. Regarding moving averages, the 100-day SMA remains below the 200-day SMA, indicating that the path of least resistance is still bearish, or that downward momentum may continue. However, the gap between the indicators appears to be narrowing, suggesting a potential bullish crossover is on the horizon. Furthermore, this confirms increasing buyer interest.

The Stochastic indicator for EUR/USD performance is hovering near the overbought zone, reflecting strong upward momentum at the moment. A decline of the oscillator from this area could signal buyer exhaustion, potentially leading to a rebound. On the other hand, if the Stochastic remains high, it would indicate that buyers are still in control. The Relative Strength Index (RSI) is also trending higher, so the price may continue to follow the same approach with buyers having the upper hand. However, the oscillator has limited room to climb before reaching the overbought zone, meaning that the upward momentum may start to fade soon.

Trading Tips:

Keep in mind that the rebound in the Euro/Dollar price still lacks strong momentum to confirm its occurrence, and the 1.1800 resistance will remain the most crucial to confirm an upward shift. Therefore, carefully monitor the factors influencing the currency exchange rate.

Dollar Retreats After Federal Reserve Signals

According to Forex currency market trading, the U.S. dollar fell after the Federal Reserve’s “Beige Book” report boosted expectations for further U.S. interest rate cuts. The report showed slowing economic growth, persistently weak labor market conditions, and rising prices for input costs. Indicators of tariff implementation varied, with some companies keeping selling prices unchanged, while others reported an increase in import costs.

According to expert views on the report, the “Beige Book” generally reinforces the view that the economic outlook has not changed much since the Fed’s September meeting. They suggest that this keeps the Fed on track to cut U.S. interest rates by 25 basis points later this month, and likely again in December.

According to reliable trading company platforms, the U.S. Dollar Index (DXY) fell by 0.2% to 98.596 after recording a one-week low of 98.417 on Wednesday.

Ready to trade our daily Forex forecast? Here’s a list of some of the best regulated forex brokers to check out.

Source link

16 10, 2025

Demand for Taurine in EU | Global Market Analysis Report

By |2025-10-16T16:07:18+03:00October 16, 2025|Dietary Supplements News, News|0 Comments


Demand for Taurine in EU: Outlook and Forecast (2025-2035)

The EU taurine market is anticipated to expand from USD 79.2 million in 2025 to USD 137.9 million by 2035, advancing at a CAGR of 5.7%. This growth reflects rising consumption across dietary supplements, beverages, and pharmaceutical applications as taurine becomes increasingly recognized for its functional and therapeutic properties. Food and beverage manufacturers continue to incorporate taurine for energy-enhancing, metabolic, and cellular protection benefits. As per FMI’s latest global food industry intelligence, widely referenced in health and ingredients studies, expanding pharmaceutical utilization and growing pet nutrition applications are further accelerating market development, positioning taurine as a high-value amino acid additive integral to Europe’s health, nutrition, and wellness manufacturing ecosystem.

Quick Stats for Taurine Market in EU

  • Taurine in EU Value (2025): USD 79.2 million
  • Taurine in EU Forecast Value (2035): USD 137.9 million
  • Taurine in EU Forecast CAGR (2025–2035): 5.7%
  • Leading Segment of Taurine: Food Grade (46.0% by 2035)
  • Top Applications of Taurine: Dietary Supplements and Beverages
  • Key Growth Regions of Taurine: Germany, France, Italy, Spain, Netherlands
  • Market Drivers of Taurine: Rising supplement usage, pet food fortification, and energy drink demand

Demand for Taurine in EU Key Takeaways

Between 2025 and 2030, EU taurine sales are expected to grow from USD 79.2 million to USD 104.3 million, adding USD 25.1 million, which represents roughly 36% of the total decade expansion. This period will be characterized by stronger supplement production, increased energy beverage manufacturing, and enhanced taurine integration in functional food formulations. From 2030 to 2035, the market will add USD 33.7 million, driven by pharmaceutical innovation and plant-based taurine technologies. Historical performance between 2020 and 2025 showed steady 5.0% CAGR growth, underscoring taurine’s increasing acceptance in nutrition, healthcare, and functional beverage applications across European manufacturing ecosystems.

From 2030 to 2035, sales in the Taurine Market in the EU are forecast to grow from USD 104.3 million to USD 137.9 million, adding another USD 33.7 million, which constitutes 57.3% of the overall ten-year expansion. This period is expected to be characterized by further adoption of bio-fermentation-derived taurine, broader pharmaceutical integration, and growing pet nutrition enrichment targeting diverse health and performance requirements. The increasing focus on clean-label amino acids, coupled with beverage and supplement manufacturer commitment to functional fortification, will drive demand for high-purity taurine products that ensure consistent bioavailability, verified safety, and strict pharmaceutical and nutraceutical regulatory compliance.

Between 2020 and 2025, EU taurine sales experienced steady expansion at a CAGR of 5.0%, rising from USD 62.1 million to USD 79.2 million. This phase was fueled by expanding energy drink production, increasing dietary supplement consumption, and greater awareness of taurine’s role in cellular hydration and antioxidant defense. The market matured as pharmaceutical companies and nutritional product formulators recognized taurine’s commercial and therapeutic potential. Product innovations, improved purity control, and manufacturing efficiency strengthened supplier credibility, helping establish taurine as a reliable and widely accepted functional amino acid across European pharmaceutical and nutritional applications.

Why is the Demand for Taurine in EU Growing?

Industry expansion is being supported by the rapid increase in health-conscious consumers across European countries and the corresponding demand for functional, performance-enhancing, and nutritionally beneficial ingredients with scientifically validated efficacy in energy metabolism, cardiovascular health, and cellular protection. Modern food, beverage, and pharmaceutical manufacturers rely on taurine as an essential ingredient for dietary supplements, fortified drinks, and therapeutic formulations, driving demand for products that deliver consistent purity, proven bioavailability, and stable performance across applications. Even basic fortification requirements—such as energy support, hydration enhancement, or antioxidant protection—continue to drive comprehensive taurine adoption to maintain product quality and consumer trust.

The growing awareness of taurine’s physiological benefits and increasing recognition of its formulation versatility are driving demand for high-purity taurine from certified manufacturers with validated quality systems and regulatory compliance capabilities. European regulatory authorities are establishing clear specifications for amino acid quality, purity testing, and labeling requirements to ensure product safety and health claim accuracy. Scientific and clinical studies are providing robust evidence supporting taurine’s cardioprotective, neuroprotective, and metabolic advantages, reinforcing its inclusion in supplements, energy beverages, and pet nutrition formulations. This requires specialized manufacturing controls and standardized quality protocols for optimal purity, appropriate solubility, and validated performance profiles, including identity verification and bioavailability certification.

Segment Analysis

Sales are segmented by grade, end-use application, distribution channel, nature, and country. By grade, taurine demand is divided into Food Grade, Feed Grade, Pharmaceutical Grade, and Others. Based on end-use application, sales are categorized into Food, Beverage, Animal Feed, Dietary Supplements, Cosmetics & Personal Care, Agriculture, and Pharmaceuticals. In terms of distribution channel, demand is segmented into B2B (ingredient supply to manufacturers) and Direct-to-Consumer. By nature, sales are classified into Synthetic (conventional) and Plant-based (bio/fermentation-derived). Regionally, taurine demand is focused on Germany, France, Italy, Spain, the Netherlands, and the Rest of Europe.

By Grade, Food Grade Segment Accounts for 48.0% Share

The food-grade taurine segment is projected to account for 48.0% of EU taurine sales in 2025, moderating slightly to 46.0% by 2035, establishing itself as the leading material class across European food and supplement manufacturing. This dominance is supported by taurine’s functional versatility, clean taste, and compatibility with beverages, supplements, and fortified foods. Food-grade taurine provides manufacturers with stable, soluble, and high-purity formulations suitable for both dry-blend and liquid applications.It benefits from mature processing technology, broad acceptance in food safety frameworks, and extensive adoption among functional beverage brands, dietary supplement producers, and nutraceutical manufacturers emphasizing performance consistency and regulatory assurance.

By Application, Dietary Supplements Segment Accounts for 24.0% Share

Demand For Taurine In Eu Analysis By Application

Dietary supplements are positioned to represent 24.0% of total taurine demand in 2025, growing slightly to 23.0% by 2035, reflecting steady leadership despite rising pharmaceutical usage. This significant share demonstrates taurine’s essential role in energy metabolism, cardiovascular support, and antioxidative health formulations. European supplement manufacturers increasingly incorporate taurine into performance blends, nootropic complexes, and electrolyte formulations, targeting health-conscious consumers seeking functional efficacy. The segment benefits from continuous product innovation in powders, capsules, and ready-to-drink formats, all requiring consistent amino-acid quality and bioavailability. Although pharmaceutical use expands faster, supplements will remain taurine’s core commercial domain through 2035.

By Distribution Channel, B2B Segment Accounts for 97.0% Share

Demand For Taurine In Eu Analysis By Distribution Channel

The B2B distribution channel controls approximately 97.0% of EU taurine sales in 2025, marginally declining to 96.0% by 2035 as direct-to-consumer growth gains minimal traction.B2B dominance reflects taurine’s nature as an industrial input for food, beverage, pharmaceutical, and pet-food producers requiring verified quality documentation, technical support, and batch traceability. European manufacturers prefer sourcing through established ingredient suppliers and amino-acid distributors offering GMP-certified production and logistics reliability. B2B suppliers deliver validated purity, analytical data, and regulatory certifications, ensuring compliance with EFSA and EMA standards.Despite minor D2C expansion, taurine remains primarily an ingredient-centric B2B commodity.

By Nature, Synthetic Segment Accounts for 96.0% Share

Synthetic taurine dominates EU supply, contributing 96.0% of total sales in 2025 and gradually declining to 90.0% by 2035 as plant-based and fermentation-derived taurine technologies gain maturity. Synthetic production remains the most cost-efficient and scalable method for achieving pharmaceutical-grade purity. It serves high-volume applications such as energy drinks, supplements, and pet food where consistency, cost control, and regulatory clarity are crucial. The emerging bio-fermentation segment, though smaller, is gaining traction among clean-label and sustainability-focused manufacturers.As bio-derived taurine proves comparable in stability and bioavailability, it will capture niche premium markets while synthetic retains dominance.

What are the Drivers, Restraints, and Key Trends?

EU taurine sales are advancing steadily due to growing consumer interest in functional nutrition, expanding use in energy and sports beverages, and increasing pharmaceutical adoption for cardiovascular and neurological health applications. The industry faces several challenges, including import dependence from Asian manufacturers, raw material price fluctuations, and regulatory scrutiny over taurine dosage and labeling in food and drink formulations. Continued innovation in bio-fermentation production technologies, clean-label amino acid development, and pharmaceutical-grade quality assurance remains central to industry progression and long-term competitiveness across the European taurine market.

Expansion of Bio-Fermentation and Clean-Label Production Technologies

The rapidly accelerating development of bio-fermentation technologies is transforming taurine manufacturing from synthetic chemical processes into sustainable, plant-based amino acid production, enabling purity and performance characteristics comparable to conventional taurine. Advanced biotechnology platforms utilizing microbial fermentation, enzyme catalysis, and green chemistry allow producers to deliver taurine with verified traceability, reduced carbon footprint, and improved environmental compliance. These innovations prove particularly valuable for pharmaceutical and nutraceutical manufacturers seeking natural ingredient positioning, reduced environmental impact, and consistent bioavailability.

Major taurine producers are investing in fermentation process optimization, European production localization, and quality certification programs, recognizing that bio-fermentation-derived taurine represents a breakthrough solution to sustainability, purity, and import-dependence challenges. Manufacturers collaborate with biotechnology companies, research institutions, and regulatory agencies to develop scalable production platforms that achieve synthetic-grade performance while aligning with EU sustainability goals, REACH regulations, and consumer clean-label expectations.

Integration of Taurine into Functional Foods and Nutritional Fortification

Modern food, beverage, and supplement manufacturers are increasingly incorporating taurine as a fortification ingredient to enhance energy metabolism, mental focus, and cellular protection in consumer health products. Strategic integration of taurine into energy beverages, dietary supplements, and fortified functional foods allows companies to deliver products offering measurable health benefits validated by clinical research. Taurine’s inclusion enables nutritional fortification and functional performance similar to leading amino acids such as L-carnitine and creatine, creating opportunities for differentiated health-focused formulations.

Manufacturers implement bioavailability testing, stability validation, and purity verification protocols ensuring taurine efficacy across multiple product types. These validation efforts support nutrition claims, promote scientific credibility, and facilitate product registration under EU food and supplement regulations. Nutrient integration programs and research-backed positioning continue to strengthen taurine’s profile as a key functional ingredient supporting energy balance, cardiovascular protection, and metabolic optimization.

Growing Emphasis on Sustainability, Traceability, and Ethical Sourcing

European consumers and manufacturers increasingly prioritize sustainable taurine sourcing, emphasizing verified environmental credentials, transparent supply chains, and compliance with ethical manufacturing standards. This sustainability trend allows suppliers to achieve competitive differentiation through traceable production, renewable feedstocks, and environmentally responsible chemistry. Sustainability initiatives are particularly relevant to pharmaceutical, pet nutrition, and nutraceutical brands, where ingredient provenance and production ethics directly influence brand reputation and market acceptance.

The development of eco-friendly taurine production programs, including waste minimization, energy-efficient synthesis, and green solvent utilization, is expanding manufacturers’ ability to meet environmental performance benchmarks without compromising cost or quality. Companies collaborate with regulatory agencies, environmental certification bodies, and academic partners to balance environmental accountability with production scalability. These collaborative frameworks strengthen consumer trust, support compliance with EU sustainability directives, and reinforce taurine’s position as a responsibly manufactured, high-value amino acid in the European health and nutrition ecosystem.

Analyzing Demand for Taurine in EU by Key Countries

Demand For Taurine In Eu Cagr Analysis By Country


Country CAGR % (2025–2035)
Germany 5.4%
France 5.8%
Italy 5.9%
Spain 6.0%
Netherlands 6.2%
Rest of Europe 6.1%

Germany Leads European Sales with Advanced Pharmaceutical Capacity

Revenue from taurine in Germany is projected to exhibit steady growth with a CAGR of 5.4% through 2035, supported by its world-class pharmaceutical manufacturing base, extensive nutraceutical infrastructure, and established amino acid research and production facilities. Germany’s pharmaceutical and dietary supplement sectors demonstrate a sophisticated understanding of taurine’s physiological value, driving consistent incorporation into pharma-grade formulations, functional supplements, and fortified wellness beverages. The country’s leadership in pharmaceutical innovation, clinical research, and export-oriented ingredient production ensures taurine’s continued role as a critical amino acid supporting both therapeutic and preventive health applications across regulated EU markets.

France Demonstrates Robust Growth with Expanding Nutraceutical Demand

The demand for taurine in France is forecast to grow at a CAGR of 5.8%, supported by expanding nutraceutical production, energy beverage innovation, and rising consumer awareness of amino acid supplementation for wellness and vitality. French nutraceutical companies and beverage producers are increasingly incorporating taurine to enhance functional benefits in performance and mental-focus formulations. The nation’s growing wellness culture and demand for premium, clinically validated supplements are accelerating taurine adoption in capsule, drink, and powder formats. Taurine’s clean-label adaptability and safety record strengthen its appeal among French consumers seeking science-backed, bioavailable functional ingredients for daily nutrition.

Italy Maintains Strong Growth Through Pet Nutrition and Functional Foods

Revenue from taurine in Italy is expanding at a CAGR of 5.9%, underpinned by growth in pet food manufacturing, functional food fortification, and pharmaceutical adoption. Taurine plays a vital role in cat and dog nutrition, driving consistent demand from Italy’s robust pet food industry. The functional food and beverage brands are incorporating taurine into energy snacks, fortified waters, and wellness beverages, reflecting growing consumer interest in health-enhancing amino acids. Italy’s combination of pharmaceutical innovation and pet nutrition leadership ensures taurine maintains a balanced demand profile across multiple industrial segments, from supplement production to veterinary formulations.

Spain Focuses on Beverage and Sports Nutrition Expansion

Demand for taurine in Spain is projected to grow at a CAGR of 6.0%, fueled by the rapid expansion of energy and sports drink markets, nutritional supplement innovation, and increasing youth-oriented wellness consumption. Spanish beverage manufacturers are major taurine consumers, integrating the ingredient into energy formulations, isotonic beverages, and fortified drinks targeting performance and alertness benefits. Retail growth through major chains and e-commerce channels accelerates access to taurine-enriched products. Spain’s fitness and wellness culture, coupled with expanding contract manufacturing capacity, positions the country as a key growth driver for taurine’s commercial utilization in Southern Europe.

Netherlands Strengthens Growth with Innovation and Distribution Leadership

Revenue from taurine in the Netherlands is expected to grow at a CAGR of 6.2%, reflecting its role as a strategic European distribution hub and innovation testing ground for new functional ingredient applications. Dutch companies leverage taurine in dietary supplements, beverages, and export formulations, supported by efficient logistics, advanced R&D infrastructure, and regulatory clarity. The Netherlands’ highly developed nutraceutical trade network and pharmaceutical logistics systems facilitate taurine imports and re-export across the EU. Dutch innovation ecosystems, particularly in clean-label, plant-based, and fermentation-derived taurine, reinforce the country’s position as a leader in next-generation amino acid development.

Rest of Europe Demonstrates Emerging Growth Through Market Development

The Rest of Europe segment is forecast to grow at a CAGR of 6.1%, reflecting taurine’s expanding presence in Central and Eastern European markets, where dietary supplement and pharmaceutical production capacity continues to mature. These emerging markets are increasing taurine imports for integration into energy beverages, over-the-counter products, and pet food formulations. Rising consumer awareness of taurine’s health benefits and government interest in nutrition standardization support long-term adoption. The region’s improving industrial base and alignment with EU quality standards position it as an evolving growth frontier within the broader European taurine landscape.

Europe Market Split by Country

Demand For Taurine In Eu Europe Country Market Share Analysis, 2025 & 2035

EU taurine sales are projected to grow from USD 79.2 million in 2025 to USD 137.9 million by 2035, registering a CAGR of 5.7% over the forecast period. Growth will be driven by expanding nutraceutical production, rising pharmaceutical adoption, and energy beverage fortification across major European economies. Germany is expected to demonstrate the strongest growth trajectory, supported by its advanced pharmaceutical manufacturing ecosystem, extensive supplement industry, and well-established amino acid research networks. France follows closely, driven by growing nutraceutical innovation, functional food integration, and expanding consumer awareness of taurine’s health-enhancing and metabolic support benefits.

Germany maintains the largest share at 38.7% in 2025, reflecting its dominance in taurine consumption through pharmaceutical and supplement channels. France holds 30.8%, supported by expanding energy drink and dietary supplement markets. Italy accounts for 17.0%, emphasizing taurine’s role in pet nutrition and fortified foods. Spain represents 10.2%, driven by beverage sector growth, while the Netherlands contributes 3.3%, benefiting from strong distribution and import infrastructure. All major countries maintain an average 5.7% CAGR, underscoring steady, uniform expansion and consistent taurine adoption across the European Union.

Competitive Landscape

Demand For Taurine In Eu Analysis By Company

The EU taurine market is moderately consolidated and defined by competition among amino acid producers, nutraceutical suppliers, and pharmaceutical-grade manufacturers. Companies focus on bio-fermentation innovation, purity optimization, and strategic distribution alliances to ensure high-quality, sustainable taurine solutions. Leading participants include Ajinomoto Co., Inc. (12%), leveraging its pharmaceutical partnerships, research integration, and extensive European footprint to deliver high-purity taurine across supplements, beverages, and medical formulations. Kyowa Hakko Bio Co., Ltd. (10%) emphasizes biotechnology-based taurine production with superior purity and sustainability credentials, supporting Europe’s clean-label standards. QianjiangYongan Pharmaceutical (8%), a key Chinese exporter, supplies bulk taurine for energy drinks and supplements through cost-efficient, validated channels.

The Honjo Chemical Corporation (5%) supports growth via pharmaceutical collaborations and clinical-grade taurine applications across therapeutic formulations. Remaining participants, collectively holding 65%, include regional distributors, nutraceutical producers, and emerging fermentation startups. These firms compete on regulatory compliance, documentation, and sustainability credentials, reflecting Europe’s demand for transparent, bioavailable, and ethically sourced ingredients. Competitive success increasingly depends on supply reliability, EU pharmacopoeia conformity, and clean-label innovation, positioning taurine as a vital amino acid supporting Europe’s evolving nutraceutical, beverage, and pharmaceutical manufacturing ecosystem.

Key Players

  • Stauber USA
  • Foodchem International Corporation
  • The Honjo Chemical Corporation
  • Qianjiang Yongan Pharmaceutical Co. Ltd.
  • New Zealand Pharmaceutical Ltd.
  • Ajinomoto Co. Inc.
  • Kyowa Hakko Bio Co. Ltd.
  • Jiangsu Yuanyang Chemical Co. Ltd.
  • Funchi Pharmaceutical Co., Ltd.
  • Penta Manufacturing Company
  • Mitsui Chemicals, Inc.
  • AuNutra Industries Inc.

Report Scope


Item Value
Quantitative Units USD 137.9 million
Product Type Food Grade, Pharmaceutical Grade, Feed Grade, Others (Cosmetic/Industrial/Reagent)
Application Dietary Supplements, Beverage (Energy/Caffeinated/Soft), Food (Dairy/Infant/Bakery/Cereal), Pharmaceuticals, Pet Food (Cat/Dog), Pet Supplements, Cosmetics & Personal Care, Animal Feed (Aqua/Poultry), Agriculture
Distribution Channel B2B (Ingredient Supply to Manufacturers), Direct-to-Consumer (D2C), Ingredient Distributors & Wholesalers
Nature Synthetic (Conventional), Plant-based (Bio/Fermentation-derived), Pharmaceutical-grade (GMP-certified)
Countries Covered Germany, France, Italy, Spain, the Netherlands, and the Rest of Europe
Key Companies Profiled Ajinomoto Co., Inc.; Kyowa Hakko Bio Co., Ltd.; QianjiangYongan Pharmaceutical; The Honjo Chemical Corporation; European taurine import distributors; Bio-fermentation technology developers; Nutraceutical formulators
Additional Attributes Dollar sales by grade, application, distribution channel, and nature; regional demand trends across major European economies; competitive landscape analysis with established amino-acid manufacturers and emerging bio-fermentation entrants; buyer preferences for synthetic versus bio-derived taurine; integration with nutraceutical and pharmaceutical formulation workflows; innovations in fermentation-derived taurine and traceability systems; adoption across supplement, beverage, pharmaceutical, and pet-nutrition channels; regulatory framework analysis for amino-acid purity, labeling, and health claims (EFSA/EMA considerations); supply chain strategies including import dependence, European production localization, and inventory/lead-time risk mitigation; penetration analysis for clinical, sports-nutrition, and mainstream consumer segments.


Source link

16 10, 2025

DOT Price Prediction: Polkadot Eyes $4.01 Recovery Despite Current Bearish Momentum

By |2025-10-16T15:37:50+03:00October 16, 2025|Crypto News, News|0 Comments


Zach Anderson
Oct 16, 2025 05:20

DOT price prediction points to $4.01 medium-term target as Polkadot trades near $3.13 with bearish momentum but oversold RSI suggesting potential reversal ahead.


DOT Price Prediction Summary

DOT short-term target (1 week): $3.37 (+7.7% from current levels) • Polkadot medium-term forecast (1 month): $4.01-$4.44 range representing 28-42% upside potential • Key level to break for bullish continuation: $4.44 immediate resistance • Critical support if bearish: $2.81 Bollinger Band lower support

Recent Polkadot Price Predictions from Analysts

The latest DOT price prediction consensus from major analysts shows a cautiously optimistic outlook despite current market weakness. CoinCodex leads with the most bullish short-term Polkadot forecast at $3.37, while AMB Crypto presents a more conservative $3.12 target. The divergence becomes more pronounced in medium-term projections, with InvestingHaven’s DOT price prediction ranging from $4.01 to an ambitious $13.90, and PricePredictions.com targeting $10.62.

The analytical consensus reveals interesting contrarian opportunities. While most sources acknowledge bearish sentiment reflected in the Fear & Greed Index at 38, the technical setup suggests Polkadot may be approaching oversold conditions that historically precede recoveries. Changelly’s emphasis on the falling 50-day moving average aligns with our current technical picture, where DOT trades below all major moving averages.

DOT Technical Analysis: Setting Up for Potential Reversal

Current Polkadot technical analysis reveals a cryptocurrency in transition, with several indicators suggesting the recent decline may be nearing exhaustion. The RSI at 35.70 sits in neutral territory but trending toward oversold conditions, historically a precursor to price rebounds in DOT.

The MACD histogram at -0.0927 confirms bearish momentum, but the narrowing gap between MACD (-0.2509) and signal line (-0.1583) suggests momentum is decelerating. This deceleration often precedes trend reversals, particularly when combined with oversold conditions.

Polkadot’s position at 0.16 within the Bollinger Bands indicates the price is trading much closer to the lower band ($2.81) than the upper band ($4.76), suggesting oversold conditions. The daily ATR of $0.41 shows moderate volatility, providing sufficient movement for meaningful price swings in either direction.

Volume analysis shows healthy trading interest with $26.8 million in 24-hour Binance spot volume, indicating sufficient liquidity for institutional participation in any potential reversal.

Polkadot Price Targets: Bull and Bear Scenarios

Bullish Case for DOT

The primary bullish DOT price target sits at $4.01, representing the lower end of InvestingHaven’s medium-term forecast. This target aligns with technical resistance levels and would require breaking above the current pivot point at $3.19 and immediate resistance at $4.44.

For this Polkadot forecast to materialize, DOT needs to reclaim the SMA 20 at $3.79, which would signal the beginning of trend reversal. A decisive break above $4.44 immediate resistance would open the path toward the 52-week high region near $5.31, representing a potential 70% gain from current levels.

The critical $14.04 Fibonacci level mentioned by analysts represents the ultimate bullish DOT price target for 2025, though reaching this level would require a fundamental shift in market dynamics and broader crypto market recovery.

Bearish Risk for Polkadot

The primary downside risk centers on the $2.81 Bollinger Band lower support. A break below this level would target the 52-week low at $2.95, essentially testing the absolute floor for DOT. The bearish scenario becomes more probable if the RSI drops below 30 into oversold territory without triggering a bounce.

Secondary support exists at the identified $0.63 level, though reaching this DOT price target would represent a catastrophic decline of approximately 80% and would likely require broader market capitulation.

Should You Buy DOT Now? Entry Strategy

Based on current Polkadot technical analysis, a staged entry approach offers the best risk-reward profile. The first entry point targets the $3.10-$3.15 range, capitalizing on potential support near current levels with a stop-loss at $2.75.

A second entry opportunity exists on any break above $3.37, confirming the bullish DOT price prediction from CoinCodex. This breakout entry should target the $4.01-$4.44 resistance zone with a stop-loss at $3.00.

Position sizing should remain conservative given the current bearish momentum, with maximum allocation of 2-3% of portfolio until clear trend reversal signals emerge. The decision to buy or sell DOT ultimately depends on individual risk tolerance and belief in the medium-term Polkadot forecast.

DOT Price Prediction Conclusion

Our comprehensive DOT price prediction suggests Polkadot is approaching a critical juncture where oversold conditions may trigger a relief rally toward $3.37-$4.01 over the next 4-6 weeks. The confluence of analyst targets around these levels increases confidence in this Polkadot forecast.

Confidence Level: Medium – The prediction relies on technical reversal patterns that historically have 60-65% success rates in similar market conditions.

Key indicators to monitor include RSI breaking above 40 for bullish confirmation or below 30 for continued bearish pressure. Volume expansion above $35 million daily would confirm institutional interest in any breakout move. The timeline for this DOT price prediction to materialize spans the next 30-45 days, with initial confirmation signals expected within the next week.

The critical decision point arrives at the $2.81 support level – a hold here validates the bullish case, while a break below would necessitate reassessing the entire Polkadot forecast framework.

Image source: Shutterstock


Source link

16 10, 2025

XAG/USD stands tall above $52.50 in cautious markets

By |2025-10-16T14:15:59+03:00October 16, 2025|Forex News, News|0 Comments


Silver (XAG/USD) rally was capped a few cents below the $55.00 level on Wednesday, pulling lower on profit-taking. However, downside attempts remain limited amid cautious markets, which is keeping the precious metal supported above the $52.50 area, not far from four-week highs.

The fundamental context remains supportive for precious metals, as escalating trade tensions between the US and China continue to fuel safe-haven demand. Beyond that, the market is practically fully pricing a rate cut by the Fed in late October, which is adding bearish pressure on the US Dollar.

Technical analysis: Consolidating gains within a broader bullish trend

Silver is in a period of consoñlidatiion after the last bullish run to the $55.00 area. The 4-hour RSI is showing some bearish divergence, but the pair appears unlikely to undergo a significant correction unless the fundamental background undergoes a substantial change.

To the downside, support levels at 52.43 (Intraday low) and at the bottom of the ascending channel, now around Wednesday’s low in the $51.25 area, are likely to hold bears. Below here, negative pressure would increase, aiming for the October 14 low, at $50.30.

Upside attempts are likely to meet resistance at the channel top, in the area of $54,00 and Wednesday’s high, at $54.85. Further up, the 161.8% Fibonacci extension of the October 9-14 rally, at $56.65 emerges as a plausible target.

Silver FAQs

Silver is a precious metal highly traded among investors. It has been historically used as a store of value and a medium of exchange. Although less popular than Gold, traders may turn to Silver to diversify their investment portfolio, for its intrinsic value or as a potential hedge during high-inflation periods. Investors can buy physical Silver, in coins or in bars, or trade it through vehicles such as Exchange Traded Funds, which track its price on international markets.

Silver prices can move due to a wide range of factors. Geopolitical instability or fears of a deep recession can make Silver price escalate due to its safe-haven status, although to a lesser extent than Gold’s. As a yieldless asset, Silver tends to rise with lower interest rates. Its moves also depend on how the US Dollar (USD) behaves as the asset is priced in dollars (XAG/USD). A strong Dollar tends to keep the price of Silver at bay, whereas a weaker Dollar is likely to propel prices up. Other factors such as investment demand, mining supply – Silver is much more abundant than Gold – and recycling rates can also affect prices.

Silver is widely used in industry, particularly in sectors such as electronics or solar energy, as it has one of the highest electric conductivity of all metals – more than Copper and Gold. A surge in demand can increase prices, while a decline tends to lower them. Dynamics in the US, Chinese and Indian economies can also contribute to price swings: for the US and particularly China, their big industrial sectors use Silver in various processes; in India, consumers’ demand for the precious metal for jewellery also plays a key role in setting prices.

Silver prices tend to follow Gold’s moves. When Gold prices rise, Silver typically follows suit, as their status as safe-haven assets is similar. The Gold/Silver ratio, which shows the number of ounces of Silver needed to equal the value of one ounce of Gold, may help to determine the relative valuation between both metals. Some investors may consider a high ratio as an indicator that Silver is undervalued, or Gold is overvalued. On the contrary, a low ratio might suggest that Gold is undervalued relative to Silver.


Source link

16 10, 2025

GBP/JPY Forecast 16/10: Finds Support (Chart)

By |2025-10-16T14:14:45+03:00October 16, 2025|Forex News, News|0 Comments

  • The British pound initially fell during the trading session on Wednesday, breaking below the ¥200 level, only to turn around and show signs of life.
  • The market ends up forming a hammer on both Tuesday and potentially Wednesday now, suggesting that the buyers are in fact starting to fight back.
  • The Japanese yen got a little bit of a boost after some members of the Bank of Japan suggested that perhaps they would have to do something about the weakness of the Japanese yen, but at this point in time the Japanese cannot afford higher interest rates of any real circumstance, as the Japanese economy is far too indebted to carry that load.

Pullback

I think this pullback makes a certain amount of sense considering that the ¥205 level offered significant resistance that we are now seeing a bit of a pullback. The question is whether or not we can pick up any momentum to the upside. If we do, then I’m a buyer of this pair because of the pullback giving me an opportunity to get involved in a obvious move to the upside, and of course a massive amount of interest rate differential that comes into the picture. The 50 Day EMA currently sits at the ¥200 level, so that makes that level even more important, and I think it’ll be interesting to see if we can stay above there. As long as we stay above the ¥200 level, then I think it’s a “buy on the dips” market, but I don’t necessarily think I would throw a ton of money into this market right away.

I think this is the beginning of something bigger, and the question will be how much further can it go to the upside? I think at this point in time the ¥210 level is a very reasonable target, surprise me if we end up going much higher than that. I have no interest in shorting this market until we break down below the ¥198 level, something that doesn’t seem very likely at the moment.

Begin trading our daily forecasts and analysis. Here is a list of Forex brokers in Japan to work with.

Christopher Lewis has been trading Forex and has over 20 years experience in financial markets. Chris has been a regular contributor to Daily Forex since the early days of the site. He writes about Forex for several online publications, including FX Empire, Investing.com, and his own site, aptly named The Trader Guy. Chris favours technical analysis methods to identify his trades and likes to trade equity indices and commodities as well as Forex. He favours a longer-term trading style, and his trades often last for days or weeks.

Source link

16 10, 2025

Ba’ndo’s identity for Japanese matcha brand Nippon turns to tradition, not trends

By |2025-10-16T14:06:43+03:00October 16, 2025|Dietary Supplements News, News|0 Comments


When shaping Nippon’s visual tone, the agency aimed to preserve the simplicity, calmness and depth of meaning inherent in matcha making, building a brand that felt loyal to its roots yet unmistakably modern – “an identity that carries the ritual of the past into the rhythm of today”, Emrah summarises. To reinforce this balance the team went for a type pairing of Maison Neue Extended and Eros: “one confident, bold, and contemporary; the other, a subtle nod to traditional Japanese calligraphy”, Emrah continues.

The brand’s logo also brings the ‘O’ into focus as a symbol of the product’s origin. With a soft shifting gradient, the shape references Japan title as ‘Land of the Rising Sun’, as well as connoting the traditional matcha bowl used for preparing the tea. A secondary logo of a stamp-like form also marks the brands physical applications and packaging, which was Bando’s take on a traditional Japanese Hanko stamp for Nippon: a personalised name stamp or seal, traditionally used in Japan as a substitute for a handwritten signature.

A big part of shaping the personality of Nippon for Ba’ndo beyond these considered logo marks was their use of soft, minimal illustrations. The team created a character to guide users through the entire journey of the drink “from its cultivation and preparation to serving and consumption”, says Emrah, introducing a tactile motion element that allowed this friendly character to dissolve and dissipate. “We envisioned a motion system inspired by the light, dynamic, and transient nature of matcha powder. Each floating particle captures the spirit of the Japanese concept ‘ichigo ichie’ — a moment that appears briefly, then disappears, never to be repeated. To achieve the effect, the design team at Ba’ndo combined 2D illustrations with digital particle simulations based on the real, natural movement of the powder.


Source link

16 10, 2025

Dogecoin Price Prediction: DOGE Tests $0.22 as Binance Launches $400M Trader Relief Initiative

By |2025-10-16T13:37:25+03:00October 16, 2025|Crypto News, News|0 Comments

Binance has announced a $400 million relief program for traders devastated by October’s liquidation event, distributing $300 million in vouchers, plus $100 million in low-interest loans, despite stating it accepts no liability for losses. The initiative is an attempt to rebuild confidence after above $19 billion in leveraged positions vanished during the crash.

Meanwhile, Dogecoin price consolidates near $0.20 after shedding ground during the selloff, but the Dogecoin forecast suggests a climb toward above $0.30 remains possible if meme coin momentum returns.

Nevertheless, traders hunting bigger multipliers are looking to DeepSnitch AI, a presale at $0.01877 that raised above $419,000. The project will launch five AI agents to monitor whales, screen contracts, and push alpha directly into Telegram, solving the intelligence deficit that costs retail traders millions.

Binance deploys $400M as analysts predict Ether rally

Binance faced criticism after mid-October’s chaos, with traders reporting technical glitches that prevented position closures and pricing discrepancies in stablecoins. Multiple altcoins temporarily displayed $0 prices due to oracle data issues. Combined with earlier measures, Binance and BNB Chain have committed above $728 million in recovery efforts.

Its $400 million program targets users who suffered forced liquidations in mid-October, requiring losses of at least $50, which represent above 30% of total net assets. Token vouchers ranging from $4 to $6,000 are set to be distributed, and a $100 million loan fund will address liquidity pressures for ecosystem and institutional participants.

Meanwhile, prominent analysts Tom Lee and Arthur Hayes doubled down on predictions that Ether will hit $10,000 by year-end despite the recent crash. Lee emphasized that ETH has been “basing for four years” since its 2021 peak, suggesting the breakout wouldn’t represent froth but rather price discovery at new levels. Historical Q4 data shows average returns of 21% for Ether during the period.

These recovery signals suggest markets are stabilizing, but for meme coins like DOGE, the path forward depends on risk appetite returning. Dogecoin price prediction points to above $0.30 as achievable, but traders seeking 100x returns need earlier entry points, and DeepSnitch AI at $0.01877 offers that opportunity with surveillance tools built for crypto’s chaos.

Top cryptos to buy now

DeepSnitch AI: Five surveillance agents for retail traders

DeepSnitch AI will deploy SnitchFeed to track whale wallet movements and social sentiment shifts before they move markets. When major holders start accumulating or dumping, retail typically finds out too late, but once DeepSnitch AI launches, this agent will monitor activity around the clock, flagging significant transfers and crowd emotion changes in real time.

That’s just one among five of the AI agents DeepSnitch will launch. Another, SnitchScan, screens new token launches using layered filters, which include developer history and on-chain metrics that separate legitimate projects from pump-and-dump schemes. This is different from other traders, who generally lack the technical skills to audit contracts themselves, creating an information gap scammers exploit daily.

Right now, the presale sits at $0.01877 with Coinsult and SolidProof audits complete, removing the security risks that derail most early projects. The fact that the presale is above $419,000 committed validates that there is clear demand for tools that actually solve real trader problems.

If the Dogecoin forecast pointing toward above $0.30 represents 50% upside from current levels, DeepSnitch AI could multiply 5,000% when listings hit exchanges.

Dogecoin: Consolidating below key resistance

Dogecoin price has been holding above the $0.19 support zone but failing to reclaim $0.22 resistance. The meme coin dropped about 20% over the prior week, underperforming Bitcoin’s smaller decline. With RSI near 48, there’s neutral momentum, and neither bulls nor bears are controlling direction.

68f0ba0313a6c Gra4

Price predictions range between about $0.20 and $0.35 through year-end. The upper target here is a contingency, though, requiring volume expansion and sustained meme coin interest. October historically treats DOGE well, but its market cap above $30 billion will limit how fast gains can accumulate.

Corporate backing provides fundamental support, as Trump-linked entities have invested over $50 million in Dogehash mining operations. Real-world acceptance through Shopify, Tesla, and others also affirms that the project’s utility is more than speculation.

But for traders chasing the dream of exhilarating returns, DOGE is much less likely to deliver the multiples that DeepSnitch AI at $0.01877 still has serious potential to provide.

Shiba Inu: Testing support after correction

Bouncing from the above $0.0000094 support level tested during the previous Friday’s crash, Shiba Inu hovered near $0.000011 on October 14. The token gained about 8% in 24 hours as buyers returned, but resistance at $0.000012 capped the recovery. Volume remained below recent averages, suggesting still-cautious participation from buyers.

68f0ba32da845 Gra2

The SHIB forecast for October suggests prices could reach between about $0.000010 and above $0.000015 if broader meme momentum makes a comeback. The Shibarium network has crossed 1 billion transactions since its launch in August 2023, which speaks to its technical robustness. Ecosystem development continues with ShibaSwap updates and metaverse expansion.

Nevertheless, at a market cap above $6 billion at the time of writing, SHIB faces scaling limitations similar to DOGE’s. Even the most successful execution will lead to linear gains, not exponential ones. That’s why DeepSnitch AI, which combines meme energy with AI tools traders need, remains the better choice for those after more substantial returns.

The bottom line

DeepSnitch AI merges AI surveillance with presale economics that make it a clear and present moonshot. At $0.01877 in Stage 2, with audits checked off and five agents ready to deploy, this opportunity offers the kind of upside that Dogecoin, targeting above $0.30 and comfortably leaning into incremental gains, has now moved away from.

Ethereum at above $4,100 and Bitcoin above $113,000 preserve wealth, but DeepSnitch AI still has plenty of potential to create it.

Visit the presale now.

68f0b8059f2a5 N1m

FAQs

What is the Dogecoin price prediction for October 2025?

Dogecoin price predictions anticipate between $0.25 and $0.35 by late October if meme momentum returns and Bitcoin holds above $110,000. The DOGE price prediction this year depends heavily on broader market conditions.

Can Shiba Inu reach $0.01 this cycle?

The SHIB price prediction suggests $0.01 remains unrealistic given supply dynamics. More achievable targets sit between above $0.000015 and above $0.000020, requiring ecosystem growth and continued burns.

Why is DeepSnitch AI outperforming meme coins?

DeepSnitch AI combines five AI agents that solve real problems with presale pricing at $0.01877. The 100x potential far exceeds what DOGE or SHIB can deliver at multi-billion-dollar market caps, making it the superior choice for exponential returns.

Disclaimer: The content above is presented for informational purposes as a paid advertisement. The Tribune does not take responsibility for the accuracy, validity, or reliability of the claims, offers, or information provided by the advertiser. Readers are advised to conduct their own independent research and exercise due diligence before making any decisions based on its contents and not go by mode and source of publication. Investments in cryptocurrencies are subject to high market risks and volatility; readers should seek professional advice before investing.


Source link

16 10, 2025

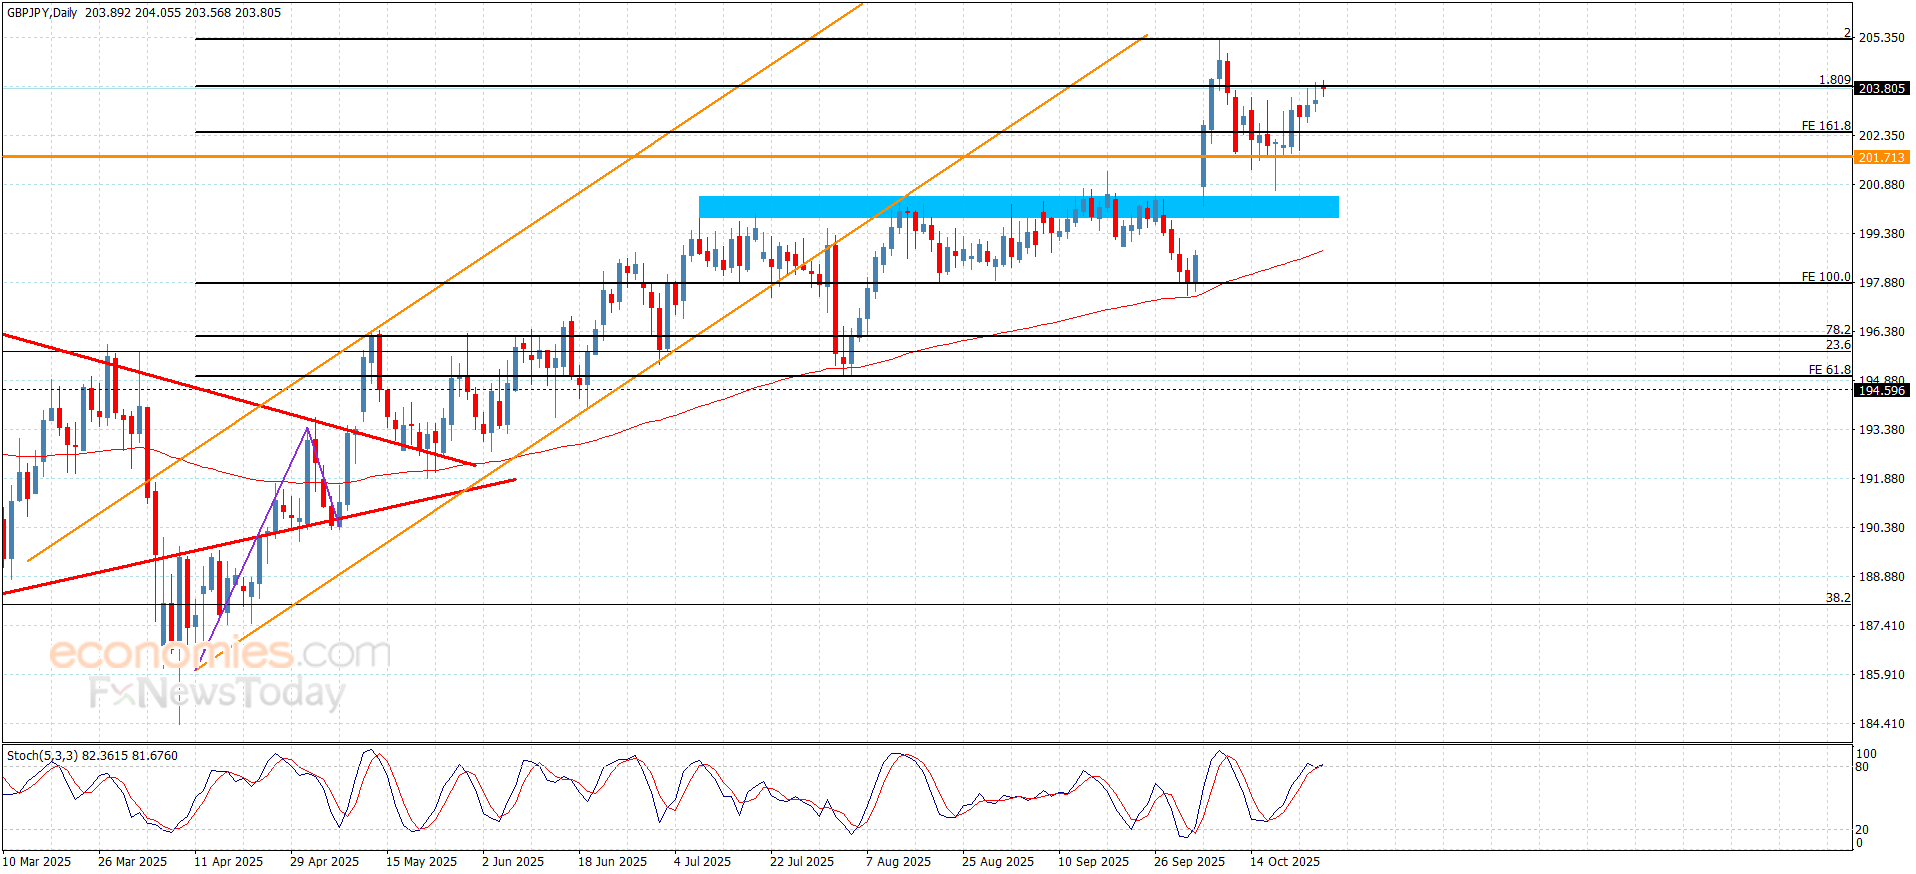
The GBPJPY price resists stochastic negativity– Forecast today – 16-10-2025

By |2025-10-16T12:15:00+03:00October 16, 2025|Forex News, News|0 Comments


The (ETHUSD) price rose in its last trading on the intraday basis, in an attempt to recover some of its previous losses, and attempting to offload its clear oversold conditions on the relative strength indicators, with the emergence of positive overlapping signals, and the dominance of bearish wave on the short-term basis, with the continuation of the negative pressure due to its trading below EMA50, reducing the chances of its recovery in the upcoming period.

VIP Trading Signals Performance by BestTradingSignal.com (6-10 Oct, 2025)


Get high-accuracy trading signals delivered directly to your Telegram. Subscribe to specialized packages tailored for the world’s top markets:


Full VIP signals performance report for 6-10, October 2025:

  View Full Performance Report


Source link

16 10, 2025

The EURJPY remains bullish– Forecast today – 16-10-2025

By |2025-10-16T12:13:51+03:00October 16, 2025|Forex News, News|0 Comments

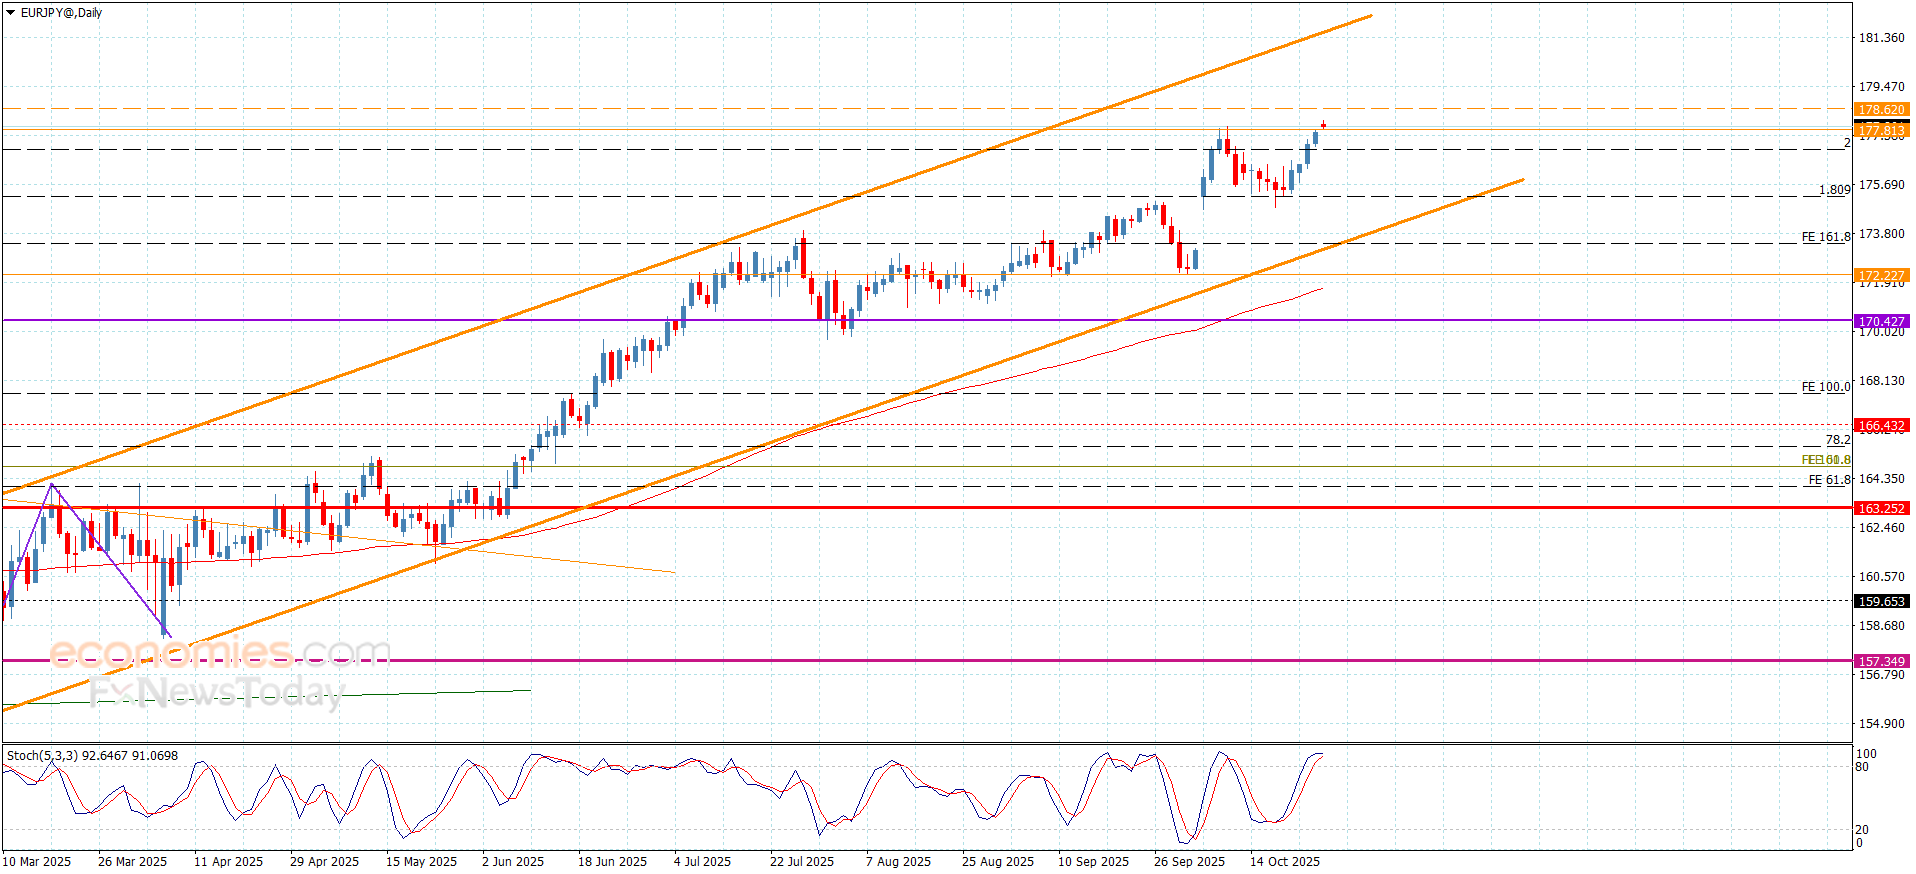
The EURJPY pair confirmed the continuation of the bullish scenario by providing new close above the extra support at 175.20 level, forming bullish moves by reaching 176.00.


Note that the continuation of the main indicators’ contradiction might force the price to provide new sideways fluctuated moves, but its success in surpassing the intraday barrier near 176.45 might increase the efficiency of the bullish track, to target 177.05 level reaching the achieved top at 177.90.


The expected trading range for today is between 175.50 and 176.45


Trend forecast: Fluctuated within the bullish track


Source link

Go to Top