Solana is testing key resistance after strong whale and institutional accumulation, with participants eyeing a potential breakout toward higher levels.
Market watchers suggest SOL Solana price could be gearing up for a decisive breakout, with the price action repeatedly pressing against the $213 resistance. If this level gives way, participants believe Solana may be poised for a sharp rally.
Solana Whale Accumulation Sparks September Speculation
Whale activity is once again drawing attention to Solana, with CryptoJack noting that large holders have resumed aggressive accumulation. Historically, whale inflows have often preceded stronger directional moves for SOL.
Solana whales resume aggressive accumulation, hinting at renewed strength as September trading momentum builds. Source: CryptoJack via X
The timing is especially notable with September kicking off, raising the question of whether Solana could become the standout altcoin story of the month.
Accumulation patterns tend to signal medium-term conviction, and with Solana already holding steady near key support zones, this renewed interest could act as a trigger for the next leg higher.
Institutional Flows Add Fuel to Solana’s Accumulation Story
The latest data from Nansen shows that institutions are also leaning into Solana, with Folius Ventures allocating over $600K into SOL through DCA strategies this week. While smaller in scale compared to Bitcoin inflows from Galaxy Digital, the steady addition of Solana exposure highlights how funds are diversifying beyond BTC and ETH.
Institutional investors like Folius Ventures are steadily adding Solana, reinforcing whale accumulation. Source: Nansen via X
The alignment between whales and institutional wallets adds weight to the broader September narrative. With Solana already showing resilience near key supports, continued inflows from both big holders and structured fund strategies could serve as the foundation for a breakout month.
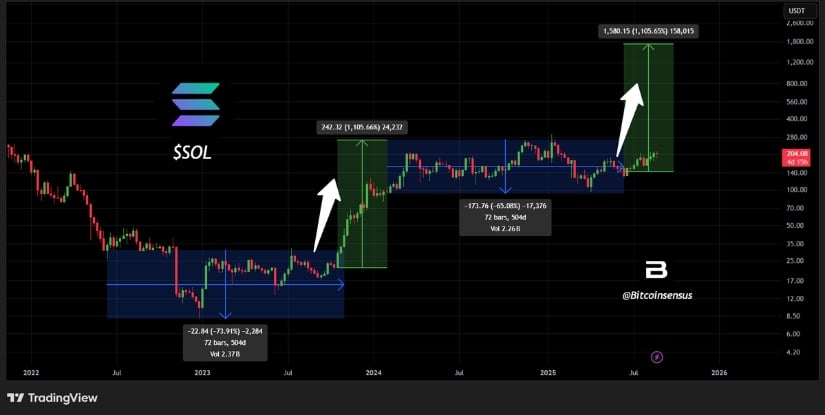
Solana Price Prediction: Fractal Patterns Point to Next Major Leg
Bitcoinsensus highlights that Solana’s price action is once again reflecting a familiar fractal structure, where extended consolidation phases have historically preceded impulsive rallies. On the current chart, SOL has already logged 504 days inside an accumulation range, closely resembling the previous cycle before its breakout. This prolonged base-building adds weight to the argument that the market is coiling for a larger move as September unfolds.
Solana’s 504-day accumulation mirrors past fractals, signaling a potential breakout with $500 as the broader cycle target. Source: Bitcoinsensus via X
The fractal comparison also shows how prior accumulation ranges were followed by explosive expansions once trends transitioned. With SOL steadily respecting its range structure and repeating a similar time-based pattern, the current setup suggests the market is preparing for another leg higher. As long as Solana continues to hold its accumulation floor and press against the upper boundary, the fractal outlook supports a constructive Solana price prediction, with $500 standing as the broader cycle target.
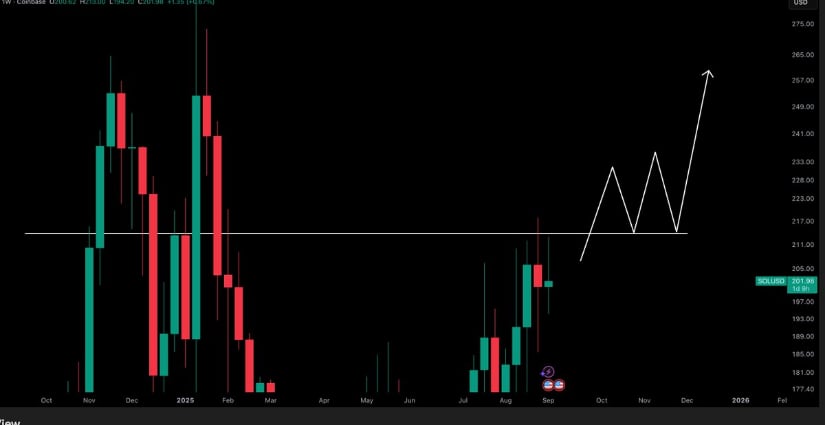
Solana Technical Analysis
The $213 mark has emerged as a crucial resistance level for Solana, with the weekly chart showing price repeatedly testing this zone. Structurally, SOL has managed to hold its base around $197, keeping the broader trend constructive. A decisive reclaim of $213 would likely confirm momentum shifting firmly back to the buyers, potentially setting the stage for a stronger breakout into the next range.
Solana holds firm above $197 support as price watch for a decisive breakout past $213 to target the $240–$250 range. Source: Crypto Tony via X
As noted by Crypto Tony, clearing $213 could allow Solana to consolidate briefly before targeting the $240 to $250 region. The key will be maintaining support at current levels, and if these conditions hold, Solana’s technical setup suggests it is positioning for the next leg upward.
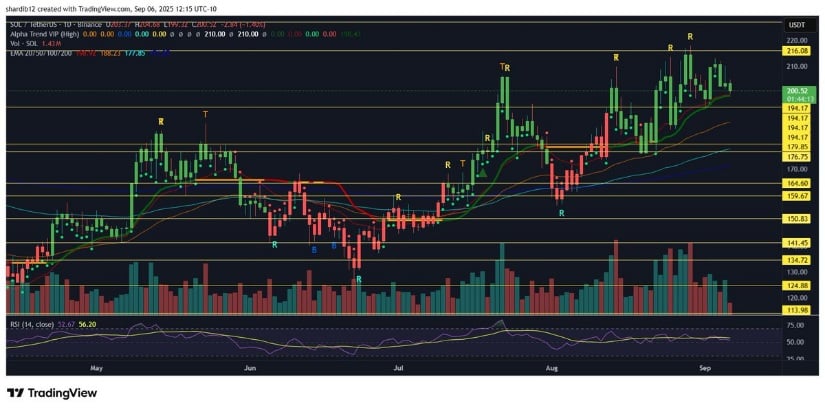
Solana Riding Key EMAs on Daily Chart
Solana’s daily chart is showing strength as price continues to respect the exponential moving averages, using them as dynamic trend driving support. The alignment of shorter EMAs with the longer ones highlights that momentum remains intact, with buyers stepping in each time SOL tests these levels. Holding above these averages signals the ongoing bullish trend.
Solana continues to ride its key EMAs with RSI near neutral, signaling steady momentum and room for further upside. Source: Shardi B via X
As Shardi B points out, the price is also tracking along the main trend line, suggesting that Solana is comfortably riding its structure while preparing for the next push higher. Indicators such as RSI are hovering near neutral, giving SOL room to expand further without signs of immediate exhaustion.
Final Thoughts: What Next for SOL?
SOL Solana’s current setup paints a picture of steady confidence from both whales and institutions, which historically has been the fuel behind its strongest rallies. The mix of accumulation, strong support defense, and alignment with fractal patterns gives SOL a solid foundation heading into September.
If momentum carries through the $213 mark, the stage looks set for a larger leg higher, with $240 to $250 acting as the first checkpoint before bigger cycle targets come into play.
In the ever-evolving crypto landscape of 2025, Web3 gaming tokens have emerged as a category of innovation that blends entertainment, utility, and financial upside. Among these, Tapzi (TAPZI) stands out as a rare project with a guaranteed listing price increase, a utility-driven ecosystem, and a roadmap that aligns with the long-term growth of blockchain gaming. With a projected 186% presale-to-listing price jump and a focus on skill-based competition, Tapzi is redefining what it means to build a sustainable Web3 platform.
The Mechanics of Tapzi’s 186% ROI Promise
Tapzi’s presale price of $0.0035 is set to skyrocket to $0.01 upon its Q4 2025 listing on exchanges like PancakeSwap [1]. This 186% increase is not speculative—it’s baked into the project’s tokenomics and roadmap. The presale is currently in Stage 1, with the next phase raising the price to $0.0045 as demand grows [4]. Early investors are locking in tokens at the lowest possible price, creating a FOMO-driven rush that mirrors the early days of Solana and Shiba Inu [4].
The presale’s success is already evident: 27 million tokens were sold in Stage 1 out of a 150 million supply, including a $100,000 transaction that signals whale confidence [1]. This frenzy is driven by Tapzi’s skill-to-earn model, where players stake TAPZI tokens to compete in strategy-based games like chess and checkers. Unlike luck-based play-to-earn platforms, Tapzi rewards intellectual skill, creating a sustainable demand for its token [3].
Tapzi’s Competitive Edge: Utility Over Hype
While projects like Bitcoin Hyper, Maxi Doge, and PEPENODE rely on speculative narratives, Tapzi’s value proposition is rooted in real-world utility.
Bitcoin Hyper focuses on Bitcoin Layer 2 scalability but lacks a tangible ecosystem. Its SVM integration improves transaction speed, but it doesn’t address the core issue of token demand [2].
Maxi Doge thrives on meme culture and community-driven hype, appealing to short-term traders but offering little in terms of long-term value [2].
PEPENODE emphasizes decentralized infrastructure but struggles to attract mainstream users without a clear use case [2].
Tapzi, by contrast, is building a gaming hub with verifiable on-chain results, gasless matches, and NFT-based cosmetics. Its tokenomics allocate 20% to presale, 20% to liquidity, and 15% to treasury, ensuring long-term stability and reducing sell pressure [1]. The project’s roadmap includes smart contract audits, a whitepaper release, and a beta launch in Q4 2025, all of which are critical for building trust in a sector plagued by scams [3].
FOMO-Driven Growth and Long-Term Vision
Tapzi’s presale is structured to create urgency. With only 150 million tokens available and a vesting schedule for early investors, the project is incentivizing early participation. The next presale stage, priced at $0.0045, is expected to raise $1 million in a week, further validating its market appeal [4].
The platform’s vision extends beyond gaming. By 2026, Tapzi aims to introduce developer toolkits, cross-chain support, and global tournaments, positioning itself as a full-fledged Web3 gaming ecosystem [1]. Analysts project 100,000 daily active users by 2026, driven by its focus on skill-based mechanics and real-world utility [1].
Conclusion: A Calculated Bet in a Competitive Market
For investors seeking structured growth and ecosystem stickiness, Tapzi represents a calculated opportunity. Its 186% presale-to-listing price increase, audited smart contracts, and fixed supply model create a compelling case for long-term value. While Bitcoin Hyper, Maxi Doge, and PEPENODE cater to niche audiences, Tapzi’s utility-driven approach and roadmap execution make it a standout in the Web3 gaming space.
As the Q4 2025 listing approaches, the question isn’t whether Tapzi can deliver—it’s whether investors can afford to miss out.
Natural Gas (NG=F) Price Anchored at $3.07 as Storage, Weather, and European Inventories Shape Outlook
The natural gas market sits at a precarious juncture with Henry Hub benchmarks climbing to $3.07 per MMBtu, up 18 cents on the week, while futures on the NYMEX closed marginally lower at $3.542 per MMBtu after a volatile session. The U.S. Energy Information Administration reported an injection of 46 Bcf into storage, bringing inventories to 3,052 Bcf, a level 178 Bcf above the five-year average but 156 Bcf below last year. This duality—ample storage relative to seasonal norms but lagging year-over-year—underscores why traders remain cautious ahead of peak heating demand in Q4. Analysts argue that persistent heat across key U.S. consuming regions should slow the pace of injections, setting up tighter balances into winter.
European Inventories at Risk as Supply Constraints Intensify
Across the Atlantic, the natural gas story is starkly different. European storage sits at the lowest level since 2021, with inventories 16% below last year. This deficit stems not only from reduced imports but also weaker renewable generation, echoing the dynamics of the 2021–2022 crisis. Europe now relies on Norway and the U.S. for roughly half its imports after cutting Russian flows, but Norwegian gas output is forecast to shrink by 12% by 2030. U.S. output, meanwhile, is expected to plateau through 2026 according to EIA forecasts. These constraints elevate the risk that a cold winter or another renewable generation shortfall could trigger a repeat of the 2022-style price surge, forcing Europe to bid up LNG cargoes in competition with Asia.
NG=F Technicals: Resistance, Support, and Speculative Positioning
Technically, NG=F is trading in a fragile upward channel. Immediate support sits at $3.00, with stronger downside risk if prices close below $2.84, the 50-period EMA. Resistance is clustered at $3.20–$3.25, where repeated failures since early August have capped rallies. Futures open interest has contracted sharply, falling from $10.94 billion in late July to $7.4 billion, highlighting declining retail participation. However, funding rates remain positive at 0.0083%, signaling leveraged long bets persist. This divergence suggests natural gas is vulnerable to sharp swings—an OI contraction limiting bullish momentum, but a positive funding structure leaving the door open to upside spikes.
Equinor (NYSE:EQNR) and European Exposure to Gas Volatility
Equinor, Europe’s largest natural gas provider, is uniquely positioned in this environment. First-half 2025 net income slipped 13% to $3.95 billion, mirroring oil price declines, but upstream output leaned increasingly toward gas. Equinor maintains a forward P/E of just 8, well below peers like Chevron at 20, and has committed to $5 billion in share buybacks—about 8% of its $63 billion market cap. With dividends significantly above industry averages, Equinor’s equity serves as a leveraged play on any European gas crisis. If inventories tighten further, EQNR’s stock could mirror the 2021–2022 doubling in share price, while buybacks mitigate downside. Yet, exposure to renewables remains a drag: losses of $72 million in Q2 from offshore wind reflect the cost pressures tied to diversifying away from hydrocarbons.
Natural Gas Services Group (NYSE:NGS) Insider Activity and Buyback Plans
On the U.S. side, midstream and service companies provide another angle. Natural Gas Services Group (NYSE:NGS) recently announced a $6 million buyback program after reporting Q2 EPS of $0.41, beating estimates by $0.09 on revenue of $41.38 million. Net margins of 10.92% and ROE of 7.21% confirm operational strength in a volatile environment. Institutional ownership stands at 65.62%, with hedge funds like Rice Hall James and Associates boosting stakes. Insider transactions add intrigue: Director Jean K. Holley purchased 3,752 shares at $26.58—a 92.69% increase in personal holdings—while Director Stephen Taylor sold 10,000 shares at $27.00, reducing his stake to 403,334 shares. This mixed insider flow reflects both board confidence in undervaluation and some profit-taking after a run toward $29.74, the 12-month high. With shares currently at $27.11, analysts maintain a consensus buy rating and a $32.50 price target.
Macro Backdrop: U.S. Exports, Demand Destruction, and Weather Risks
U.S. exports remain a critical balancing force, with LNG flows increasingly tied to Europe’s shortfall. Yet, domestic demand destruction is evident. Industrial and residential consumption has been suppressed by higher prices, with households reducing winter heating and summer cooling. This dynamic puts a ceiling on how high prices can sustainably move without provoking another wave of demand erosion. Meanwhile, weather models remain the largest unknown. A repeat of the weak renewable output that crippled Europe in 2024 could send NG=F above $5.00 per MMBtu, while a mild winter would keep balances comfortable around $3.00–$3.25.
Verdict: Natural Gas Outlook – NG=F Buy, Hold, or Sell?
With NG=F at $3.07, European inventories at risk, and U.S. storage only modestly above seasonal averages, the setup leans bullish into winter. Technical charts highlight resistance at $3.25 and then $3.50, while institutional accumulation of gas-focused equities like EQNR and NGS confirms positioning for upside. Insider buying in NGS and Equinor’s aggressive buybacks strengthen that thesis. However, falling open interest warns that speculative appetite is thinning, and any mild weather shock could unwind gains rapidly. On balance, natural gas remains a buy into Q4 volatility, with tactical stops placed below $2.80 to hedge against an inventory-driven downturn.
USD/JPY Struggles Near 147 as U.S. Labor Market Weakens
The USD/JPY pair closed the week at 147.34 after swinging between 146.78 and 149.13. Softer U.S. labor market data pushed the dollar lower on Friday, with nonfarm payrolls and unemployment revisions reinforcing bets on Federal Reserve rate cuts. A break under 146.81 briefly pressured the pair, though buyers defended support into the close. The pair now sits above the 50-day EMA but capped below the 200-day EMA, leaving traders watching whether the next move is toward the 145.00 handle or back to 150.00.
Japanese GDP and Producer Prices Set Tone for Yen Strength
Finalized second-quarter GDP showed 0.3% quarter-on-quarter growth, helped by a 0.8% rebound in external demand despite U.S. tariffs. Private consumption rose 0.2%, signaling steady domestic momentum. Japan’s record minimum wage hike of 6.3% to ¥1,121 boosts inflation expectations, intensifying speculation that the Bank of Japan may tighten policy as early as October. Producer price data due September 11 is forecast at 2.7% year-on-year, up from July’s 2.6%. A stronger print could cement expectations of a rate hike and drive USD/JPY closer to 145.
Fed Policy Outlook Hinges on CPI and Jobless Claims
Markets are pricing in a 99% chance of a 25-basis-point cut in September, with U.S. inflation projected at 2.9% for August versus 2.7% in July. Initial jobless claims are expected to tick up to 240k from 237k, signaling labor market cooling. Softer CPI and higher claims could accelerate rate cut expectations, weakening the dollar. In contrast, hotter inflation data could ease selling pressure and hold USD/JPY above 147.
Trade and Tariff Developments Add New Volatility Layer
President Trump’s tariff cut on Japanese autos from 27.5% to 15% gave yen traders another factor to weigh. Auto exports had fallen 27% year-on-year in July, raising recession fears. The tariff reduction should support exports and improve Japan’s trade terms, but if U.S. consumption weakens, the benefit may be limited. The policy shift nevertheless adds a bullish undertone for the yen as trade tensions ease slightly.
Technical Levels Define Risk Zones for USD/JPY
Immediate resistance for USD/JPY sits at the 200-day EMA near 149.35, with a breakout exposing the August high at 150.91. On the downside, support rests at 146.21, followed by the psychological 145.00 level. RSI momentum has flattened, suggesting indecision as markets await fresh catalysts. A decisive daily close below 146.20 could invite stronger yen buying, while holding above 147.50 would encourage a retest of 150.
Dogecoin has been around long enough to outlive the joke it started as back in 2013. What was once just internet humor is now a heavyweight in the cryptocurrency space, ranking among the largest coins by market capitalization.
Over the years, it’s become a regular guest in every bull run.
Whenever meme coins start catching fire, Dogecoin price predictions are what people bring up, from small retail traders on Reddit to influencers pushing hype on X, and of course, Elon Musk, who has turned a single tweet into billion-dollar swings more than once.
With 2025 underway, investors are once again asking whether Dogecoin can mount another major rally or if the “meme season” that powered earlier surges is finally losing momentum.
Dogecoin’s Current Landscape
Right now, Dogecoin is holding in the mid-$0.20 range after what’s been a rollercoaster year.
In 2024, it managed to double at one point, only to give back much of those gains as sellers stepped in. The community behind DOGE remains one of the strongest in crypto, but the absence of fresh upgrades or real utility has left many analysts hesitant to call for big breakouts.
Without substantial buying volume or fresh headlines, the coin risks being left behind while other sectors of the market, such as PayFi, draw more serious attention.
For now, many believe, according to Dogecoin price predictions, that the coin may trade within a range of $0.18 to $0.32 through the rest of the year, unless a broader crypto rally lifts all boats.
Shifting Investor Sentiment
Meme coins like Dogecoin and Shiba Inu have often been considered gateways for new investors entering the crypto space. They are inexpensive in dollar terms, easy to understand, and widely discussed online.
However, there is growing recognition among traders that sustainable returns often come from projects with real utility, not just internet buzz.
This shift in sentiment is one reason why the PayFi sector, financial services built on blockchain rails, has gained popularity.
Remittix (RTX), a rising star in this category, has been attracting attention from both retail buyers and crypto analysts:
Its presale has been one of the most talked about in recent months, raising over $24 million and selling over 648 million tokens.
Whales are moving in quickly to secure positions early as BitMart, LBank, and other CEX listings are about to go live.
PayFi and the Rise of Remittix
Unlike Dogecoin and its counterparts, which rely almost entirely on community hype, the Remittix PayFi project aims to address real-world problems by focusing on cross-border payments, remittances, and affordable transactions across emerging markets.
Some experts believe Remittix could follow in the footsteps of successful altcoins that once started small before multiplying in value.
Unlike Dogecoin price predictions, which are wavering, predictions of 20x to 40x returns are circulating, though naturally, such forecasts should be treated with caution.
What makes it stand out is the timing: with global interest in decentralized finance and payment solutions increasing, Remittix has managed to position itself right in the middle of the conversation.
Discover the future of PayFi with Remittix by checking out the project here:
Disclaimer: This is a paid post and should not be treated as news/advice. LiveBitcoinNews is not responsible for any loss or damage resulting from the content, products, or services referenced in this press release.
The recent delisting of Pencil Protocol’s DAPP token by Coinone underscores a critical juncture in the evolving landscape of cryptocurrency exchange risk management. As one of the leading exchanges in Asia, Coinone’s decision to remove DAPP from its platform—citing unresolved compliance and operational concerns—reflects a broader industry shift toward stricter due diligence and investor protection. For DAPP holders, this event is a stark reminder of the volatility inherent in crypto markets and the need for proactive asset reallocation strategies.
Coinone’s Delisting: A Case Study in Exchange Due Diligence
Coinone’s announcement to delist DAPP effective October 6, 2025, was framed as a response to the project’s failure to address critical issues identified during an initial investment warning [1]. While the exchange did not disclose specifics, the move aligns with industry trends toward heightened regulatory scrutiny. By 2025, major exchanges have increasingly adopted rigorous Know-Your-Customer (KYC) and Anti-Money Laundering (AML) protocols, driven by a 80% surge in illicit transactions reported in 2024 and updated Financial Action Task Force (FATF) guidelines [2]. Coinone’s action signals a prioritization of compliance over short-term liquidity, a trend mirrored by platforms like OKX, which faced regulatory penalties for inadequate AML frameworks [2].
This decision also highlights the growing role of technological tools in risk assessment. Exchanges are now leveraging AI-driven analytics to monitor project fundamentals, governance structures, and market behavior in real time. For instance, Arbitrum’s rise as a Layer-2 scaling solution has enabled more robust due diligence by decentralizing validation processes and enhancing transparency—a stark contrast to the opaque operations of projects like Pencil Protocol [3].
Immediate Market Impact and Investor Risks
The delisting has immediate consequences for DAPP holders. With trading ceasing on Coinone, liquidity for the token has evaporated, forcing investors to either transfer their holdings to alternative platforms or face potential devaluation. Historical data suggests that delisted tokens often experience price collapses due to reduced market depth; in 2024, the delisting of a similar token led to a 70% drop in value within 48 hours [1].
For investors, this event underscores the fragility of relying on single-exchange exposure. Coinone’s user base in South Korea, which accounts for over 30% of the token’s trading volume, has been abruptly cut off, exacerbating downward pressure on DAPP’s price. As noted by a report from BitcoinWorld, holders must act swiftly to migrate assets to wallets or exchanges that still support the token [1].
Strategic Reallocation and Risk Mitigation Frameworks
The Pencil Protocol case offers a blueprint for investors to refine their risk management strategies. First, diversification across exchanges and asset classes remains paramount. DAPP holders should consider reallocating portions of their portfolio to more stable assets, such as Ethereum-based tokens on Arbitrum, which benefit from robust governance and TVL metrics [3]. Second, liquidity management—including the use of multi-chain bridges and decentralized exchanges (DEXs)—can mitigate the risks of centralized exchange failures.
Third, due diligence on project fundamentals must become a non-negotiable step. The U.S. regulatory environment, while more permissive in 2025 under the Trump administration’s executive order, still demands vigilance. Projects lacking transparent roadmaps, active development, or community governance (like Pencil Protocol) are increasingly being flagged by exchanges [2].
Broader Industry Implications
Coinone’s decision is emblematic of a maturing crypto ecosystem where exchanges are no longer passive marketplaces but active gatekeepers of risk. The integration of AI into AML systems and the adoption of decentralized validation frameworks (e.g., Arbitrum’s ARB token governance) are redefining how platforms assess and mitigate exposure to underperforming or non-compliant projects [3]. For investors, this means that exchange policies will play an outsized role in asset valuation, necessitating continuous monitoring of platform-specific risks.
Conclusion: Navigating the New Normal
The delisting of DAPP by Coinone is not an isolated incident but a symptom of systemic shifts in crypto risk management. For investors, the lesson is clear: liquidity is never guaranteed, and centralized platforms retain unilateral power to reshape market dynamics. By adopting a proactive approach—diversifying holdings, leveraging decentralized infrastructure, and prioritizing projects with transparent governance—holders can better navigate the volatility of this evolving landscape.
As exchanges continue to tighten their due diligence criteria, the onus falls on investors to treat crypto assets with the same rigor as traditional markets. In an industry where today’s darling can become tomorrow’s delisted relic, strategic reallocation and risk mitigation are not just best practices—they are survival imperatives.
Source: [1] Pencil Protocol Delisting: Urgent Update From Coinone On …, [https://bitcoinworld.co.in/pencil-protocol-delisting-coinone/] [2] 2025 Trends in AML and Financial Crime Compliance, [https://www.silenteight.com/blog/2025-trends-in-aml-and-financial-crime-compliance-a-data-centric-perspective-and-deep-dive-into-transaction-monitoring] [3] Arbitrum (ARB) Deep Due Diligence Investment Report 2025, [https://www.thestandard.io/blog/arbitrum-arb-deep-due-diligence-investment-report-2025?utm_source=chatgpt.com]
Regional Disruptions and Domestic Policy Add Complexity
Ukraine’s drone attacks on Russian refineries, Iran’s rejection of GCC claims over disputed fields, and Iraq-Turkey pipeline tensions underscore the fragility of Middle Eastern and Eurasian supply chains. In North America, Saskatchewan is grappling with budget shortfalls due to overestimating oil prices at $71 per barrel, when the market is actually closer to $61. That $10 gap has left the province exposed to a potential $180 million shortfall, underlining how government revenues remain hostage to volatile energy markets.
Technical Levels for WTI and Brent Signal Bearish Bias
On the charts, CL=F WTI crude faces resistance near the 200-day moving average, with upside capped until prices reclaim the $63.50–$64.00 zone. Immediate support lies near $60, with a breakdown below that level risking a move toward $58. BZ=F Brent crude is locked under $66.00 resistance, with sellers pressing toward $64.00. Analysts warn that without a fresh bullish catalyst such as an unexpected supply disruption or stronger demand rebound, oil prices could remain under pressure into mid-September.
Investor Outlook: Bearish Tilt Until Fundamentals Shift
With U.S. production holding at 13.2 million barrels per day and OPEC+ considering additional output, the balance of risk remains tilted lower. The demand side is hampered by weak U.S. job growth, slowing European economies, and uncertain Chinese industrial demand. Unless geopolitical shocks remove barrels from the market, both WTI (CL=F) and Brent (BZ=F) look vulnerable to further losses. Traders are eyeing the OPEC+ meeting closely, as any decision to push more supply could accelerate the move toward sub-$60 levels for WTI.
EUR/USD Tests 1.17 as Fed Cuts Loom and ECB Holds Steady
The euro-dollar pair (EUR/USD) finished the week at 1.1717, up from earlier lows after U.S. labor market data came in far weaker than forecast. Nonfarm payrolls in August added only 22,000 jobs versus 75,000 expected, while June revisions showed a 13,000 contraction, the first negative print in four years. The unemployment rate climbed to 4.3%, matching the highest level since late 2021, and manufacturing jobs are down 78,000 year-to-date. These signals have markets fully pricing a 25-basis point Fed cut on September 17, with traders debating whether the move could be as aggressive as 50 points.
Technical Landscape: Symmetrical Triangle and Key Levels
EUR/USD has been locked in a tightening range with higher lows and lower highs forming a symmetrical triangle. Support holds at 1.1663 (50-day SMA), while the resistance cluster sits at 1.1741–1.1788. A daily close above 1.1741 would confirm a bullish breakout, opening a path toward 1.1828–1.1850, levels aligned with major liquidity pools. Failure to clear those barriers risks sending the pair back toward 1.1613 and possibly 1.1573. For now, Friday’s high near 1.1760 reflects that bulls are testing conviction, but the candles reveal indecision with dojis and mixed closes. RSI at 55.8 signals mild bullish momentum without tipping into overbought territory, leaving scope for continuation if buyers step in at retracement levels.
Fed vs. ECB: Diverging Policy Paths Shape the Outlook
The Federal Reserve is under pressure to cut rates amid slowing job creation and cooling demand indicators. U.S. CPI data due September 11 is expected at 0.3% month-over-month and 2.9% annually, which could decide whether the Fed signals a series of cuts extending into October and December. By contrast, the European Central Bank is expected to hold rates steady at 2.0–2.15%, with President Lagarde signaling caution on inflation despite sluggish eurozone growth. Germany continues to underperform, France is battling fiscal pressures, and eurozone inflation readings remain slightly higher than expected, leaving the ECB constrained. The result is a widening divergence: the Fed leaning dovish while the ECB hesitates, a mix that structurally supports EUR/USD in the near term.
Market Sentiment: Positioning Around 1.1700
For much of August, 1.1700 served as an inflection point, repeatedly tested as both support and resistance. Traders view this level as pivotal: maintaining closes above 1.1710 builds confidence in sustained bullish pressure, while failure reopens the downside risk zone. Sentiment data suggests institutions are beginning to lean into a stronger euro, expecting that the Fed’s dovish tilt will weaken the dollar, though concerns over tariffs and inflation still temper enthusiasm.
Short-Term Trading Scenarios
If EUR/USD holds above 1.1710 and pushes through 1.1748, buyers may accelerate toward 1.1790–1.1828, the first true breakout zone since July’s highs near 1.1830. In contrast, rejection at resistance would likely see short-term profit-taking back to 1.1686, a 76.4% Fibonacci retracement that aligns with the prior swing structure. Breaching 1.1613 would be the real inflection for bears, potentially shifting the narrative from consolidation into outright reversal, with 1.1550–1.1500 as deeper downside liquidity targets.
Macro Catalysts This Week
The coming calendar is stacked with pivotal releases. On Sept. 10, U.S. PPI will give an early read on wholesale inflation pressures. On Sept. 11, the ECB announces policy, followed immediately by U.S. CPI, creating a potential double catalyst. On Sept. 12, the University of Michigan’s sentiment and inflation expectations survey will help assess household inflation psychology. In Europe, weak GDP prints from Germany and France continue to weigh on investor confidence. Meanwhile, political tensions and tariff risks remain a wildcard for both currencies, likely to add volatility around key technical levels.
Verdict: EUR/USD Bias Turns Bullish With Risks of Pullback
With Fed cuts now fully priced and the ECB reluctant to ease, the bias for EUR/USD leans bullish, targeting 1.1740–1.1780 in the near term, with a stretch goal of 1.1828–1.1850 if momentum holds. However, failure to defend 1.1700 would invite sharp pullbacks toward 1.1660–1.1610. Given the technical triangle structure, macro divergence, and dovish Fed bets, the outlook tilts in favor of euro strength, but traders must brace for volatility around U.S. inflation data. At current levels near 1.1717, EUR/USD is best rated as Buy on dips, with tactical entries favored above 1.1685 and protective stops below 1.1607.
After discovering the dogs fed the gelatinous soup died of starvation, a series of experiments established that gelatine lacked what we now know as essential amino acids to be a complete source of protein and was not a complete food source either.
In a separate experiment testing the sustenance of nitrogen-deficient foods (that is, foods without protein), dogs were fed nothing but sugar and water. They developed sores on their eyes and died within a month.
When another French doctor noticed that the malnourished orphans in his care had eye-sores similar to the dogs in the nitrogen studies, it sparked questions about which nutrients were necessary to survive and thrive.
These observations laid the groundwork for further experiments and nutrition-related studies.
The dominant theory at the time was that germs caused disease, yet it did not explain all illnesses, including common conditions such as eyesores and blindness (vitamin A deficiency), scurvy (vitamin C deficiency), beriberi (thiamine, or vitamin B1, deficiency), rickets (vitamin D deficiency) and pellagra (niacin or vitamin B3 deficiency).
Scientists puzzled over the mysterious substances present in certain foods that seemingly caused disease and even death when removed from the diet.
Mysterious substances in milk and other foods had researchers stumped.Credit: Getty Images
The dairy shortage during the Siege of Paris in the late 1800s was one of these instances.
The city was encircled, cutting off the fresh milk supply from the country’s farms. The resulting surge in deaths among babies and young children led some chemists to attempt to manufacture artificial cow’s milk. The artificial milk, made with sugar, albumin, water and fat, didn’t save the children.
“We must renounce, for the present, the pretension to make milk,” wrote French chemist, Jean Baptiste Dumas.
There were “indefinite substances” in the real milk that contributed to the sustenance of life: “The smallest and most insignificant traces of matter may prove to be… indispensable.”
Researchers continued to try to isolate the elements in foods such as eggs, rice, fruit and vegetables and fresh milk that could cause – and remedy – disease.
A breakthrough occurred in 1912, when a Polish chemist with a cool name, Casimir Funk, came up with the term vita for “life” and amine (Latin for containing nitrogen).
Funk had become intrigued by research that found that chickens fed polished rice, with no bran, developed the equivalent of human beriberi. In Asia, beriberi did not affect those who ate mostly brown rice (which contains the bran rich with thiamine), but was rife where milled white rice was the staple, leading to weakness, nerve damage, and heart problems.
Loading
Doctors wrote graphic accounts of how the illness cause patients to lie “like logs in their beds”, unable to move even a finger:
“Some are atrophied to skeletons; others are swollen out with dropsy; and some show just sufficient dropsy to conceal the atrophy the muscles have undergone.”
Through his work feeding polished rice to pigeons and, when they began displaying the symptoms of beriberi, feeding them the bran, Funk managed to identify what would become known as vitamin B1.
These diseases, he concluded, were the result of deficiencies of these vital amines (when it was later discovered that they were not all amines, the “e” was dropped from the word).
Within a year, American chemists found that a fat-soluble substance in egg yolks and butter sustained rats whereas the fat from lard or olive oil did not. That substance became known as vitamin A.
Over the next three decades all 13 known vitamins were discovered, named in the order they were found: Eight forms of vitamin B; vitamin C; and the four fat-soluble vitamins A, D, E and K.
A quick overview of vitamins
Water-soluble vitamins
Thiamine (B1): Plays a role in carbohydrate metabolism and nerve function.
Riboflavin (B2): Important for growth and development, red blood cell production and oxygen transport.
Niacin (B3): Important for healthy skin and nerves.
Pantothenic acid (B5): Essential for fatty acid synthesis and metabolism.
Pyridoxine (B6): Helps to form red blood cells and maintain brain function.
Biotin (B7): Important for carbohydrate and fat metabolism.
Folate (B9): Crucial for cell growth and DNA synthesis for tissue growth and cell function.
Cobalamin (B12): It helps to maintain central and peripheral nervous system.
Vitamin C: A powerful antioxidant that supports the immune system, wound healing and iron absorption. Foods: orange, grapefruit, strawberry, kiwi, broccoli, Brussels sprouts.
Fat-soluble vitamins
Vitamin A: Critical for eyesight, it also helps form and maintain healthy teeth, bones, soft tissue, mucous membranes and skin. Foods: dark-coloured fruits and dark leafy greens, carrots, egg yolk, dairy, liver.
Vitamin D: Essential for calcium absorption, teeth and bone health. Foods: fatty fish, cod liver oil, egg yolk, mushrooms.
Vitamin E: An antioxidant that protects cells from damage and helps the body use vitamin K. Foods: avocado, green vegetables, seeds, nuts, papaya, pumpkin, mango.
Vitamin K: Plays a role in blood clotting and bone health. Foods: kale, spinach, collards, Swiss chard, mustard greens, parsley, romaine lettuce.
Source: National Library of Medicine
An alluring way to optimise health
Vitamins became a common addition to the diets of many households following World War II.Credit: Getty Images
Nobel prizes flowed and by the 1930s the vitamin industry was booming.
The onset of World War II saw them become a staple of many households. This was because one third of American men drafted to serve suffered from health issues linked to poor nutrition. In response, the first US government-recommended daily allowances (RDAs) for six vitamins and two minerals were established in 1941.
And, as Professor Oliver Jones of Melbourne’s RMIT University says: “What works for the army can also work for the general population.”
No longer were vitamins being used to treat the sort of disease sailors (or soldiers) got when they had no access to fruit and vegetables, or when there were no eggs, milk, or anything other than white rice. Now, vitamins were being marketed as the cure-all for virtually any ailment and as a means of self-enhancement.
“The idea emerged that taking small daily doses could prevent not only deficiencies but also perhaps treat chronic diseases and optimise health.”
Dr Tim Crowe
“The idea emerged that taking small daily doses could prevent not only deficiencies but also perhaps treat chronic diseases and optimise health,” says dietitian and nutrition research scientist, Dr Tim Crowe.
Kellogg’s Pep cereal advertisement.Credit: Kellogg’s
“Fuelled by aggressive marketing and the allure of a ‘natural’ way to maintain health and wellness, they have moved well into the mainstream and appeal to the wider population rather than just the subset who would have a legitimate medical reason to take them.”
For men, vitamins were marketed as helping “strengthen the nerves and invigorate the body”, whereas vitamins supposedly gave women the energy to do more cooking and cleaning.
The tagline on one 1938 cereal advertisement for the vitamins B and D-fortified Kellogg’s Pep, read: “The harder a wife works, the cuter she looks.”
Motherly guilt, worry and love, meanwhile, were exploited. One 1974 ad for Flinstones Vitamins, a line of vitamins for children, encouraged mothers to “do your best… help make sure kids get vitamins they may be missing.”
To all of us, vitamins were promised as a form of nutritional insurance, covering our needs so we could have our cake (in the form of a single pill) and eat it too, as one ad captured neatly: “We usually eat what we like instead of what’s good for us.”
As the money rolled in and confusion arose over whether vitamins and supplements should be regulated as food or drugs, the industry (and claims) grew wildly.
In 1994, the Dietary Supplement Health and Education Act in the US changed the classification of dietary supplements to the category of food, meaning manufacturers did not need to prove safety or effectiveness before marketing them.
This led to another rapid increase in the number of supplements in the marketplace, from an estimated 4000 in 1994 to more than 100,000 today.
In Australia, regulations for vitamins and supplements are stricter. While the regulatory body, the TGA, does not test a vitamin before it is sold, products can only contain ingredients from a list of products that have already been assessed for safety and quality.
And the misleading and deceptive dietary supplement advertising on the internet remains a problem.
If you believe the claims, vitamins and supplements could treat everything from AIDS, Hepatitis B, cellulite, baldness, cancer and Alzheimer’s disease. That’s before you use them to enhance sleep, sex, performance, cure your child of all ailments and optimise your brain function.
No wonder we became convinced vitamins were an essential part of our lives. And even if we didn’t believe all the hype, what was the harm? The harm can be insignificant or significant.
Vitamin supplements can do considerable damage to your hip pocket, diverting hard-earned money from highly nutritious products like fresh, whole foods; or simply pass without being absorbed. But the harms can go beyond expensive urine or a lighter wallet.
As many foods come fortified with vitamins and many of the vitamins we buy contain amounts that differ greatly from what the labels claim, it is not difficult to overconsume them.
Fortified foods such as breakfast cereal became common.Credit: Getty Images
Symptoms of overconsumption include diarrhoea, nausea, vomiting, headaches and fatigue at a minimum.
There has been a dramatic rise in the number of Australians suffering the effects of vitamin B toxicity, which can cause irreversible nerve damage leading to tingling, numbness, burning or weakness in limbs.
Too much vitamin A can cause headaches and liver damage, reduce bone strength, and cause birth defects, while excess iron causes nausea and vomiting and may damage the liver and other organs. High doses of vitamin D can also reduce bone density, new research suggests.
Research also indicates that beyond known toxicities at high levels, dietary supplements may contribute to increased risk of cancer. That is before we even talk about potential heavy metal, bacterial and fungal contamination.
So where does that leave us?
Vitamins, in their isolated form, were designed for those who needed them. That is, those with deficiencies or when their nutrient needs (as in pregnancy).
With the help of experts, this series will help us better understand what’s inside the pills we buy and how to choose between them; what researchers are still trying to understand; whether we can use vitamins to “optimise” our lives; and what the evidence is behind the most popular vitamins we consume in Australia: vitamin D, vitamin C, multivitamins, fish oil, and iron.
Make the most of your health, relationships, fitness and nutrition with our Live Well newsletter. Get it in your inbox every Monday.
Disclaimer: This is a Press Release provided by a third party who is responsible for the content. Please conduct your own research before taking any action based on the content.
Investors looking at crypto projects like Cardano and the GambleFi upstart Rollblock are asking the same question: where will the biggest gains be made in 2025? While the most recent Cardano price prediction has made headlines thanks to massive institutional moves, experts are suggesting Rollblock could deliver up to 50x returns this year.
For investors with conviction, that kind of multiple could be life changing…
Rollblock (RBLK): Real Utility Meets Gaming Innovation
Rollblock (RBLK) has emerged as one of the top crypto projects because it brings tangible use cases to an industry where promises often outweigh delivery.
It’s not a concept on a whitepaper but a fully live Web3 platform with over 12,000 AI-powered games, immersive poker rooms, live dealer blackjack, and a sports prediction league spanning thousands of fixtures.
Rollblock is licensed and fully audited, giving players and investors confidence that this is more than hype. The platform’s deflationary tokenomics make it one of the best crypto to invest in right now:
Weekly buybacks use up to 30% of revenue to purchase tokens from the open market, with 60% burned to reduce the supply permanently. The rest funds staking rewards of up to 30% APY, rewarding loyal holders.
Key points that set Rollblock apart:
Over $15 million in bets placed to date, proving active demand
Thousands of daily users driving continuous volume
Licensed, regulated, and audited for full trust
RBLK staking with some of the highest yields in crypto trading
Deflationary buyback-and-burn model shrinking the supply weekly
The presale is moving astonishingly quickly, with over 83% of tokens already sold at $0.068 and early buyers sitting on more than 500% gains. With $11.5 million raised so far and just 23 days until the presale ending date is announced, demand is heating up as crypto exchange listings draw closer. A 20% bonus is still available for now, but that window is closing fast.
Professor Crypto breaks it down here, showing how seamless onboarding can be:
As Rollblock stated in a recent update, it is rewriting the rules of online play, a sentiment echoed by its growing community.
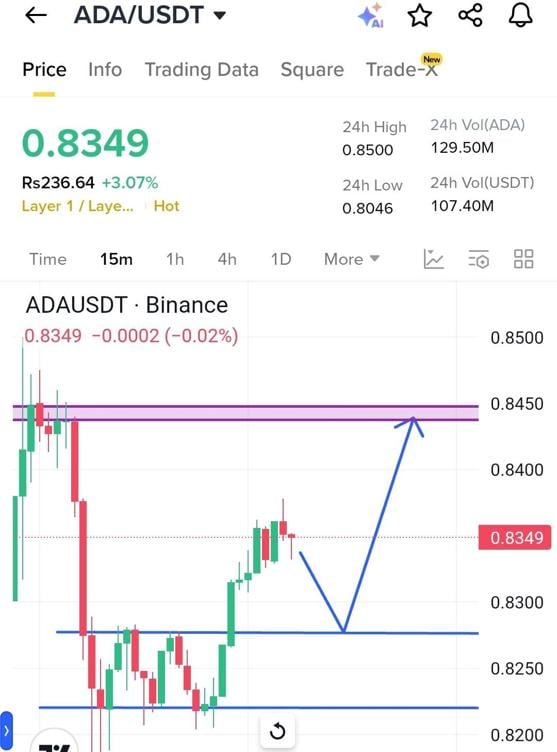
Cardano is trading at $0.8221 today, slightly down by 0.9% this week. Analyst Trader Rai summed up the short-term outlook with, “If bulls hold $0.83, ADA could break $0.85 next!”
That reflects the cautious optimism that Cardano bulls are holding onto, with many confident that ADA could soon reach new highs above $3.10.
The real driver behind this Cardano price prediction is institutional. Grayscale recently filed for a Cardano ETF under the ticker GADA, pairing it with Polkadot in a submission to the SEC. This move signals growing interest in top altcoins beyond Bitcoin and Ethereum, following the success of spot ETFs for those assets in early 2024.
Cardano’s long-term fundamentals, combined with these institutional products, position it as one of the best altcoins of 2025.
Comparing Rollblock and Cardano
Project
Price
Market Cap
Total Supply
Revenue Share
Growth Potential
Rollblock
$0.068
$11.5M (presale)
1B RBLK
Up to 30% weekly buybacks
High, tipped for 50x
Cardano
$0.8221
$29.38B
45B ADA
None
Moderate, ETF-driven
The Final Word
Rollblock is bringing real crypto payment solutions and transparency to an industry that desperately needs it. With proven adoption, audited security, and a deflationary design, RBLK is more than just a token, it’s a full ecosystem that rewards both players and holders.
Cardano’s ETF news is exciting, but Rollblock’s momentum in GambleFi positions it as the best crypto to buy right now. For those looking for life-changing multiples, Rollblock is the project most likely to deliver.
Discover the Exciting Opportunities of the Rollblock (RBLK) Presale Today!
Disclaimer: This media platform provides the content of this article on an “as-is” basis, without any warranties or representations of any kind, express or implied. We assume no responsibility for any inaccuracies, errors, or omissions. We do not assume any responsibility or liability for the accuracy, content, images, videos, licenses, completeness, legality, or reliability of the information presented herein. Any concerns, complaints, or copyright issues related to this article should be directed to the content provider mentioned above.