About Editorial team of BIPNs

Main team of content of bipns.com. Any type of content should be approved by us.
6 10, 2025

Gold Analysis Today 06/10:Analysis Today: Gold Investors

By |2025-10-06T19:48:45+03:00October 6, 2025|Forex News, News|0 Comments


Monday, October 6, 2025. Gold Forecast and Analysis of the price of gold XAU/USD today

Today’s Gold Analysis Overview:

  • The overall of Gold Trend: Strongly Bullish
  • Today’s Gold Support Levels: $3855 – $3800 – $3730 per ounce.
  • Today’s Gold Resistance Levels: $3910 – $3950 – $4020 per ounce.

Today’s Gold Trading Signals:

  • Sell Gold from the resistance level of $3930, with a target of $3700 and a stop-loss at $3980.
  • Buy Gold from the support level of $3770, with a target of $3940 and a stop-loss at $3730.

Technical Analysis of Gold Price (XAU/USD) Today:

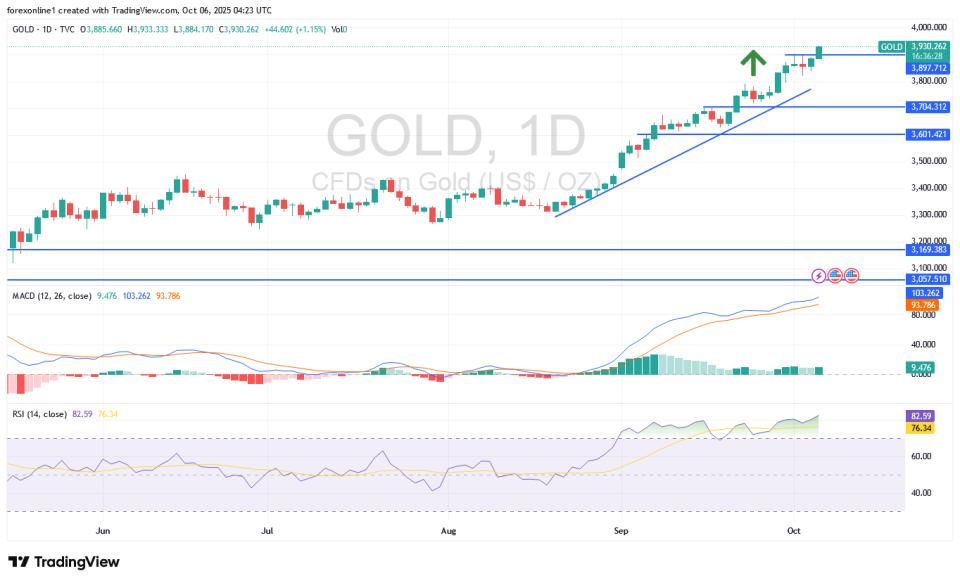
The price of gold at $4000 per ounce is the next target for gold bulls amid the continued strong positive momentum in the market. According to platforms of gold trading companies, momentary gold prices rose to the resistance level of $3897 per ounce, the highest in the history of the yellow metal market. The absence of US job numbers at the end of last week provided enough momentum for gold bulls to hold onto their gains. The US government shutdown joined the factors driving gains in the gold market, leading traders to ignore the fact that all technical indicators had reached sharp overbought levels.

Gold Analysts’ Forecasts Today

According to today’s gold analyst forecasts, the markets in general remain optimistic about gold prices rising, as is their custom after another distinguished performance, with key market investors becoming more optimistic about gold’s potential gains in the coming days. According to platforms of reliable trading companies, the gold price rose for the seventh consecutive week, having declined in only one week since the end of July. Generally, the US government shutdown, increasing talk of Europe re-using Russian reserves, and the trade war in Europe are all factors supporting sentiment. Regarding the most prominent support and resistance levels for gold trading, the near-term support appears to be around $3800, and $4000 per ounce is the closest point in the upward trajectory.

Trading Tips:

Dear TradersUp trader, keep in mind that the gold market is one of the most important safe havens for investors in times of uncertainty, and the situation surrounding the markets and the global economy will support the continued rise in the price of gold.

Will gold prices decline in the coming days?

We expect the new trading week to see a continued rise in gold prices. There are factors that could converge to stop its continuous ascent: the end of the US government shutdown, a peace agreement reached in Gaza, and the ongoing “strike” among Chinese gold buyers. However, the first two factors were not the cause of the gold price rise, so it is logical that they would have no effect if they reversed, while the cessation of Chinese buying—the effects of which are evident in the significant discounts in Shanghai—has been ongoing for some time. Therefore, I believe the gold index will strongly overcome these potential negatives.

According to some trading experts, the government shutdown’s impact on the Federal Reserve’s ability to measure employment rates is minimal, as they don’t believe the Fed relies heavily on government figures, which have been far from forecasts recently. Generally speaking, the Fed should have its own database to track, so I don’t think they’re acting randomly. They should have a good understanding of things.

Recently, we’ve seen some market volatility as a result of dovish Fed statements, but it was short-lived. Gold trading fell sharply when Dallas Fed President Lori Logan said they didn’t want a major interest rate cut and would have to raise them again. “But it looks like things are starting to recover.” Overall, the gold market’s positive outlook has returned significantly. Many metals analysts expect gold prices to rise this week, while none expect a decline. Other analysts expect gold to trade neutrally in the coming days.

Ready to trade our Gold price forecast? We’ve made a list of the best Gold trading platforms worth trading with.


Source link

6 10, 2025

Strong Start Improves the Setup

By |2025-10-06T19:43:44+03:00October 6, 2025|Forex News, News|0 Comments

Lock in today’s rate…

for use at a later date & protect your transfer budget. Secure Rate

Above: Emmanuel Macron. GUE/NGL, accessed Flickr, reproduced under CC Licensing.


Pound sterling starts the new week with a solid advance against the euro, but can it make it stick?

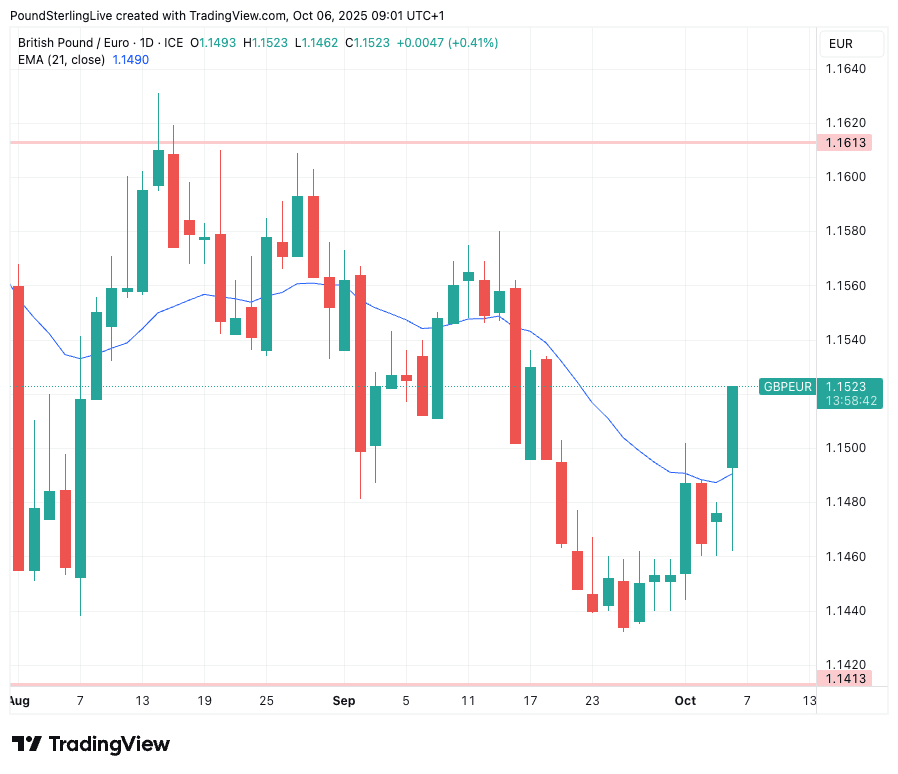
The pound to euro exchange rate (GBP/EUR) starts the new week with a solid 0.36% gain, hitting 1.1521, which is the highest level since September 18.

The move looks to be part of a broader selloff in the euro, as euro-dollar trades nearly two-thirds of a per cent down at 1.1664. In fact, looking at the performance chart, the euro is down against everything apart from the yen (which has some domestic politics on its mind).

We suspect the movement is linked to news of another French Prime Minister resigning: French President Emmanuel Macron last night unveiled his new cabinet which immediately drew criticism from across the political spectrum, most likely because it was broadly the same as the last one.

Prime Minister Sebastien Lecornu announced his resignation this morning, leaving France rudderless and significantly raising uncertainty on multiple fronts.

GBP to EUR Icon

Get More From Your GBP/EUR Transfer

Pound Sterling Live consistently delivers stronger rates than major UK banks.
In July, you could have saved up to €1,720 on a £50,000 transfer thanks to our competitive pricing.

🔎 See How

Based on average GBP/EUR rates observed in July.

France’s economy has been struggling of late as a result of this uncertainty, and today’s news certainly bakes this theme into the outlook.

Concerns will build as to how the country can consolidate its debt amidst a political void, with matters certainly not being helped by further economic underperformance: economies must grow to service their debt.

We will be watching French sovereign debt yields through the day to gauge just how worried markets are. But for now at least, the currency is showing its displeasure.


In response, GBP/EUR rises through 1.15 and above the 21-day exponential moving average (at 1.1490), a key technical level that must be breached and defended if sterling is to enter a short-term uptrend.

If GBP/EUR closes above the 21-day, then 1.1560 becomes achievable in the coming days. Those with FX payment requirements should consider locking in current levels for a portion of their payment, and setting an order for higher levels to ensure they are not missed.

GBP/EUR had been under pressure through the August-September period but ultimately formed a base above 1.1440 in late September and early October.

The jump on Monday underpins that base and could even allow for a short-term rally to form.

However, the UK’s own problems won’t be forgotten and we think GBP/EUR upside could prove limited as a result.

Rally-busting issues include the Bank of England’s desire to raise interest rates at any given opportunity and the government’s inability to control spending, which inevitably boosts inflation and increases the odds of tax rises at the November 26 budget.

“The UK rates market doesn’t fully price a BoE cut until the end of winter, next March. The Eurozone rates market doesn’t price a further ECB cut for a very long time indeed,” says Kit Juckes, FX analyst at Société Générale. “What might happen if we saw an earlier BoE move, due to a deterioration in the economic backdrop. Winter is coming, and so are higher taxes.”

Juckes says such outcomes could press a move in EUR/GBP to 0.90 and GBP/EUR to 1.11.

Starmer at desk

GBP/EUR Investment Bank Consensus Forecasts Cut

The median and mean forecasts, that provide a consensus forecast for GBP/EUR, have fallen.

  • Make smarter timing decisions
  • Get more euros for your pounds
  • Stay ahead of market moves

Pound sterling will keep its soft underbelly thanks to a challenging fundamental narrative linked to the government’s spending policies and the Bank of England’s inability to bring inflation under control.

The budget forecasting process began last week, with the Office for Budget Responsibility (OBR) giving the government an initial ‘pre-measures forecast, one of a number of iterations ahead of the day itself.

OBR downgrades to productivity forecasts, increased social spending and higher debt costs mean the Chancellor will need to raise taxes, raising uncertainty for businesses and households.

For financial markets, the impact this uncertainty has on data will be important. Also, the market will be nervous about whether or not the government passes the credibility test when addressing the UK’s difficult fiscal path.

“Sterling markets will be sensitive to any leaks on its contents,” says a note from Lloyds Bank.

The new week commences with a timely article in Bloomberg that points to rising gold and bitcoin prices, which come at the expense of some currencies. It describes the phenomenon as the “debasement trade”.

Investors are worried about inflation and lax fiscal policies, which ultimately debase traditional currencies.

The pound is a prime example of a currency at risk of debasement: the government has the spending taps turned fully on, ensuring UK inflation is the highest in the G7, and rising. And despite this, the Bank of England continues to insist it must go further with interest rate cuts.

In short, British authorities are doing nothing to protect the currency from debasement, something that will surely have an impact on the pound’s long-term trajectory.

Secure today's exchange rate

Lock in today’s rate…

for use at a later date & protect your transfer budget. Secure Rate

Source link

6 10, 2025

Niagen Bioscience Increases Full Year 2025 Net Sales Outlook to 25% to 30% Year-Over-Year Growth

By |2025-10-06T19:41:45+03:00October 6, 2025|Dietary Supplements News, News|0 Comments


LOS ANGELES–(BUSINESS WIRE)–$NAGE #BiotechNiagen Bioscience, Inc. (NASDAQ: NAGE), the global authority on NAD+ (nicotinamide adenine dinucleotide) with a focus on the science of healthy aging, today announced it has increased its full-year 2025 net sales outlook to 25% to 30% year-over-year growth from 22% to 27%.


“Elevating NAD+ is critical for health, especially as we age, and greater attention to this important area of science is valuable for public health and for Niagen Bioscience,” remarked Rob Fried, CEO of Niagen Bioscience. “We believe the FDA’s latest reversal of previous rulings on the DSHEA drug preclusion rule relating to NMN could serve to increase awareness of the NAD+ precursor market overall and the safety and efficacy of Niagen, in particular. Also, it is important to note that NMN products being sold on the market infringe upon an existing patent portfolio.”

  • Niagen is the gold standard NAD+ booster, superior to NAD+ and NMN. Niagen (patented nicotinamide riboside, NR) is rigorously studied, manufactured in the U.S. under the highest quality standards, and backed by multiple safety notifications. Unlike nicotinamide mononucleotide (NMN), which must first be converted into NR before entering human cells, Niagen NR is directly bioavailable, ensuring superior efficacy in raising NAD+ levels in humans. Furthermore, three in four NMN products failed to meet label claims (NutraIngredients USA), with similar quality issues observed internationally (NutraIngredients Asia).
  • NMN products on the market infringe on existing intellectual property (IP). Niagen Bioscience’s market surveillance program has tested the NMN, NAD+, and NR products on the market and revealed that every NMN supplement tested infringes upon a robust patent portfolio related to NMN crystallization.
  • Growing awareness of the NAD+ supplementation market. Even under the FDA’s previous exclusion, NMN supplements remained widely available, underscoring that regulatory shifts have had minimal impact on Niagen Bioscience’s business due to differentiation in bioavailability, science, quality, and IP.

For more information about Niagen, please visit www.niagenbioscience.com.

About Niagen Bioscience

Niagen Bioscience, Inc. (NASDAQ: NAGE), formerly ChromaDex Corp., is the global leader in NAD+ (nicotinamide adenine dinucleotide) science and healthy-aging research. As a trusted pioneer of NAD+ discoveries, Niagen Bioscience™ is dedicated to advancing healthspan through precision science and innovative NAD+-boosting solutions.

The Niagen Bioscience team, composed of world-renowned scientists, works with independent investigators from esteemed universities and research institutions around the globe to uncover the full potential of NAD+. A vital coenzyme found in every cell of the human body, NAD+ declines with age and exposure to everyday lifestyle stressors. NAD+ depletion is a key contributor to age-related changes in health and vitality.

Distinguished by state-of-the-art laboratories, rigorous scientific and quality protocols, and collaborations with leading research institutions worldwide, Niagen Bioscience sets the gold standard for research, quality, and innovation. There’s a better way to age.

At the heart of its clinically proven product portfolio is Niagen® (patented nicotinamide riboside, or NR), the most efficient, well-researched, high-quality, and legal NAD+ booster available. Niagen powers the Company’s consumer supplement, Tru Niagen®, the number one NAD+ boosting oral supplement in the United States (available at www.truniagen.com), and Niagen Plus™, featuring pharmaceutical-grade intravenous (IV) and injectable Niagen products (www.niagenplus.com). Pharmaceutical-grade Niagen IV and injections are compounded and distributed by U.S. FDA-registered 503B outsourcing facilities and are available exclusively at clinics with a prescription.

Niagen Bioscience’s robust patent portfolio protects NR and other NAD+ precursors. Niagen Bioscience maintains a website at www.niagenbioscience.com, where copies of press releases, news, and financial information are regularly published.

Based on the top-selling dietary supplement brands by revenue per the largest U.S. e-commerce marketplace (as of 1/1/2024 – 12/31/2024).

Forward Looking Statements:

This release contains forward-looking statements within the meaning of Section 27A of the Securities Act of 1933, as amended, and Section 21E of the Securities and Exchange Act of 1934, as amended. Statements that are not a description of historical facts constitute forward-looking statements and may often, but not always, be identified by the use of such words as “expects,” “anticipates,” “intends,” “estimates,” “plans,” “potential,” “possible,” “probable,” “believes,” “seeks,” “may,” “will,” “should,” “could” or the negative of such terms or other similar expressions, and include statements about 2025 net sales and the impact of recent and potential future regulatory shifts and potential impact of third-party patent rights. Forward-looking statements are based on current expectations and assumptions and are subject to risks and uncertainties that could cause actual results to differ materially from those described. These risks and uncertainties include, but are not limited to, the possibility or outcome of future legal action regarding the FDA’s regulatory shift or regarding enforcement activity by the third-party owner of the patent portfolio related to the crystallization of NMN; the impact of the FDA’s regulatory shift on the Company’s business in light of customer preference and behavior; the scientific, regulatory, and commercial challenges inherent in dietary supplements and healthy-aging research; the acceptance of the Company’s products and educational initiatives; the outcome of ongoing or future clinical studies; protection of intellectual property; competition; and other risks described in Niagen Bioscience’s filings with the Securities and Exchange Commission, including the most recent Annual Report on Form 10-K and Quarterly Reports on Form 10-Q. Readers are cautioned not to place undue reliance on these forward-looking statements, which speak only as of the date hereof, and actual results may differ materially from those suggested by these forward-looking statements. All forward-looking statements are qualified in their entirety by this cautionary statement and Niagen Bioscience undertakes no obligation to revise or update this release to reflect events or circumstances after the date hereof.

Contacts

Niagen Bioscience Media Contact:

Kendall Knysch, Senior Director of Public Relations & Communications

(310) 405-5227

kendall.knysch@niagenbio.com

Niagen Bioscience Investor Relations Contact:

ICR, LLC

Reed Anderson

(646) 277-1260

Stephanie Carrington

(646) 277-1282

niagenir@icrinc.com


Source link

6 10, 2025

BTC Price Sets New All-Time High at $125.7K as ETF Inflows Surge

By |2025-10-06T19:21:45+03:00October 6, 2025|Crypto News, News|0 Comments

Bitcoin price (BTC) climbed to a new all-time high overnight, reaching about $125,700 during Sunday’s Asia session before pulling back to the low $123,000 range.

The rally extended an eight-day winning streak and came as spot ETF inflows surged alongside a weaker US dollar amid renewed concerns over a potential government shutdown.

The move surpassed Bitcoin’s previous mid-August peak, marking another milestone in the asset’s strongest run since early 2024. Price action turned volatile near 12:45 a.m. ET, when BTC spiked to new highs before slipping a few thousand dollars.

A major catalyst behind the move has been continued buying through US spot Bitcoin ETFs.

CoinGlass data shows roughly $+985.10M in net inflows as of today, the second-largest since their January launch, coinciding with Bitcoin’s climb to fresh records.

(Source: Coinglass)

On-chain data support the bullish setup: exchange-held BTC has dropped to around 2.83 million coins, the lowest level in six years.

Analysts believe that the decline in available supply can restrain selling, which will support the broader bearish trade story as investors hedge against a weaker dollar.

Trader Skew noted on X that the rally might be “bait” for overconfident longs, observing that “passive shorts” are building near current highs, a sign that bearish bets are quietly stacking up despite the bullish headlines.

In the short term, the question for Bitcoin is whether ETF inflows and macroeconomic tailwinds will be able to sustain the breakout or if the market will heat up into a new consolidation period.

EXPLORE: Best Crypto To Buy in Q4 2025

CoinGlass data indicated that traders were gearing up for higher volatility, and liquidity was being sucked out across the order book.

(Source: Coinglass)

Weekend trading tends to exaggerate price movements due to thinner volumes, making recent price swings less reliable as indicators of long-term direction.

Analyst CrypNuevo highlighted the 50-period EMA on the four-hour chart now sitting just above $118,000 as a possible short-term support if Bitcoin’s pullback deepens.

That level, he said, could act as a “cooling zone” where the market resets before any new leg higher.

(Source: X)

At the same time, Rekt Capital pointed out that Bitcoin’s rejection near $124,000 wasn’t unusual.

He noted that this level served as resistance in past cycles, once leading to a 13% drop.

The next few sessions will be important. Traders are watching whether BTC can stabilize above key support or slide into a deeper correction as the market cools.

(Source: X)

Bitcoin has technically exited a declining channel that contained price action since August.

It represents a similar breakout that occurred earlier in the year, characterized by a solid upward movement following several weeks of horizontal action.

In a chart posted by Bitbull, there were two parallel tracks, each with steep rallies. At approximately $124,700, he estimates that he can extend to around $135,000-$140,000 in the near future.

Bitbull even opined that the current cycle would reach a peak of up to $160,000 by November, as the market had not yet reached its maximum.

In another analysis by Daan Crypto, a clear indicator of strength in Bitcoin on the weekly chart is the rebound of the Bull Market Support Band.

Following a few weeks of consolidating around that area, BTC shot up over $124,000, affirming a rejuvenation of the larger uptrend. In the past, that band has usually been the beginning of big bull runs.

The analyst indicated that the rebound out of this zone reinforces the bullish construction of Bitcoin.

(Source: X)

Without losing the support band, he added, the trend is still headed upwards as long as the buyers are in charge.

DISCOVER: 15+ Upcoming Coinbase Listings to Watch in 2025

Read original story Bitcoin Price Prediction: BTC Price Sets New All-Time High at $125.7K as ETF Inflows Surge by jrmiller at 99bitcoins.com

Source link

6 10, 2025

Euro sellers take action as French political issues resurface

By |2025-10-06T17:42:45+03:00October 6, 2025|Forex News, News|0 Comments

EUR/USD stays under heavy bearish pressure in the European session on Monday and trades below 1.1700. In the absence of high-impact data releases, investors are likely to remain focused on political developments in the United States (US) and France.

Euro Price Today

The table below shows the percentage change of Euro (EUR) against listed major currencies today. Euro was the weakest against the Australian Dollar.

USD EUR GBP JPY CAD AUD NZD CHF
USD 0.37% 0.07% 0.59% -0.07% -0.25% -0.07% 0.21%
EUR -0.37% -0.41% 0.14% -0.47% -0.63% -0.48% -0.20%
GBP -0.07% 0.41% 0.65% -0.06% -0.26% -0.07% 0.21%
JPY -0.59% -0.14% -0.65% -0.59% -0.87% -0.71% -0.41%
CAD 0.07% 0.47% 0.06% 0.59% -0.14% -0.01% 0.28%
AUD 0.25% 0.63% 0.26% 0.87% 0.14% 0.19% 0.47%
NZD 0.07% 0.48% 0.07% 0.71% 0.00% -0.19% 0.28%
CHF -0.21% 0.20% -0.21% 0.41% -0.28% -0.47% -0.28%

The heat map shows percentage changes of major currencies against each other. The base currency is picked from the left column, while the quote currency is picked from the top row. For example, if you pick the Euro from the left column and move along the horizontal line to the US Dollar, the percentage change displayed in the box will represent EUR (base)/USD (quote).

News of French Prime Minister Sebastien Lecornu having resigned after taking that position just a few weeks ago triggered a Euro (EUR) selloff in the European session on Monday. France’s CAC 40 Index is down about 2% following this headline, as markets grow increasingly concerned over a deepening political crisis in France.

Lecornu was reportedly facing mounting pressure from leftist lawmakers over his budget plans, per Reuters.

Meanwhile, the US government shutdown continues with no apparent progress toward a funding agreement in sight. Over the weekend, White House National Economic Council Director, Kevin Hassett, noted that layoffs could start if President Donald Trump decided that negotiations are “absolutely going nowhere.”

In the absence of high-impact data releases, investors could refrain from placing themselves for a Euro recovery because of the political drama in France.

Later in the American session, European Central Bank (ECB) President Christine Lagarde will deliver a statement before the Committee on Economic and Monetary Affairs of the European Parliament.

EUR/USD Technical Analysis

The Relative Strength Index (RSI) indicator on the 4-hour chart dropped below 40 and EUR/USD pierced through the 200-period Simple Moving Average (SMA), reflecting a buildup in bearish momentum.

On the downside, 1.1640 (Fibonacci 50% retracement of the latest uptrend) aligns as the first support level for EUR/USD ahead of 1.1580 (Fibonacci 61.8% retracement) and 1.1500 (round level, Fibonacci 78.6% retracement). Looking north, resistance levels could be spotted at 1.1700-1.1715 (Fibonacci 38.2% retracement, 200-period SMA) and 1.1750-1.1760 (100-period SMA, Fibonacci 23.6% retracement).

Euro FAQs

The Euro is the currency for the 19 European Union countries that belong to the Eurozone. It is the second most heavily traded currency in the world behind the US Dollar. In 2022, it accounted for 31% of all foreign exchange transactions, with an average daily turnover of over $2.2 trillion a day.
EUR/USD is the most heavily traded currency pair in the world, accounting for an estimated 30% off all transactions, followed by EUR/JPY (4%), EUR/GBP (3%) and EUR/AUD (2%).

The European Central Bank (ECB) in Frankfurt, Germany, is the reserve bank for the Eurozone. The ECB sets interest rates and manages monetary policy.
The ECB’s primary mandate is to maintain price stability, which means either controlling inflation or stimulating growth. Its primary tool is the raising or lowering of interest rates. Relatively high interest rates – or the expectation of higher rates – will usually benefit the Euro and vice versa.
The ECB Governing Council makes monetary policy decisions at meetings held eight times a year. Decisions are made by heads of the Eurozone national banks and six permanent members, including the President of the ECB, Christine Lagarde.

Eurozone inflation data, measured by the Harmonized Index of Consumer Prices (HICP), is an important econometric for the Euro. If inflation rises more than expected, especially if above the ECB’s 2% target, it obliges the ECB to raise interest rates to bring it back under control.
Relatively high interest rates compared to its counterparts will usually benefit the Euro, as it makes the region more attractive as a place for global investors to park their money.

Data releases gauge the health of the economy and can impact on the Euro. Indicators such as GDP, Manufacturing and Services PMIs, employment, and consumer sentiment surveys can all influence the direction of the single currency.
A strong economy is good for the Euro. Not only does it attract more foreign investment but it may encourage the ECB to put up interest rates, which will directly strengthen the Euro. Otherwise, if economic data is weak, the Euro is likely to fall.
Economic data for the four largest economies in the euro area (Germany, France, Italy and Spain) are especially significant, as they account for 75% of the Eurozone’s economy.

Another significant data release for the Euro is the Trade Balance. This indicator measures the difference between what a country earns from its exports and what it spends on imports over a given period.
If a country produces highly sought after exports then its currency will gain in value purely from the extra demand created from foreign buyers seeking to purchase these goods. Therefore, a positive net Trade Balance strengthens a currency and vice versa for a negative balance.

Source link

6 10, 2025

PepsiCo Recalls More Than 34,000 Bottles of This Popular Drink in 10 States

By |2025-10-06T17:40:30+03:00October 6, 2025|Dietary Supplements News, News|0 Comments


PepsiCo has issued a recall for 2,854 cases of Lipton Green Tea Citrus because the bottles inside do not bear the correct label. The outer cases are labeled as Lipton Green Tea Citrus, but the bottles, which do contain Lipton Green Tea Citrus, are labeled as Lipton Diet Green Tea Mixed Berry. Therefore, the nutrition information printed on the individual bottles, including the sugar amount, is not correct. 

PepsiCo initiated this recall on Sept. 17, and the U.S. Food and Drug Administration (FDA) classified it as a Class II recall, meaning consuming the recalled product “may cause temporary or medically reversible adverse health consequences,” on Oct. 2.

How To Identify the Recalled Lipton Green Tea Citrus

The bottles were sold in shelf-stable 12-pack cases at stores in Arizona, Colorado, New Mexico, Utah, Texas, Kansas, Nebraska, Oklahoma, Wyoming, and South Dakota. Both the individual bottle and cases can be identified by the sell-by date of Dec. 1, 2025, and code HHMM DW 08035 printed on the label.

What To Do if You Have the Recalled Lipton Green Tea Citrus

PepsiCo is recalling its Lipton Green Tea Citrus products because the label on the individual bottles does not reflect the correct ingredients in the actual tea, including the sugar amount. The Lipton Diet Green Tea Mixed Berry label claims the product contains zero sugar, when the Lipton Green Tea Citrus that is actually inside the bottle contains 25 grams of sugar. But the ingredients listed on the outer case are all correct.

If you are someone who monitors sugar intake for health reasons, the Lipton Green Tea Citrus may not be safe for you to consume. Instead, you should throw the product away or return it to the place of purchase for a refund or replacement. 

If you don’t monitor your sugar amounts, you do not need to do anything regarding this recall. The product is not inherently harmful to consume, but has been recalled due to a manufacturing and packaging error. However, if you prefer, you are also eligible for a refund or replacement at the place of purchase.


Source link

6 10, 2025

Dogecoin (DOGE) Price Prediction: This New Crypto Could Replicate DOGE’s 2021 Surge

By |2025-10-06T17:21:12+03:00October 6, 2025|Crypto News, News|0 Comments

Dogecoin’s 2021 explosion still haunts the dreams of crypto traders: what if you’d held on? Fast forward to today, and some believe we could see a repeat, at least in magnitude, for a newer project.

In this piece, we’ll dissect DOGE’s past, set a realistic mid-term forecast, and then pivot to that “new crypto” hoping to channel the same kind of upside, especially by 2027.

Dogecoin (DOGE)

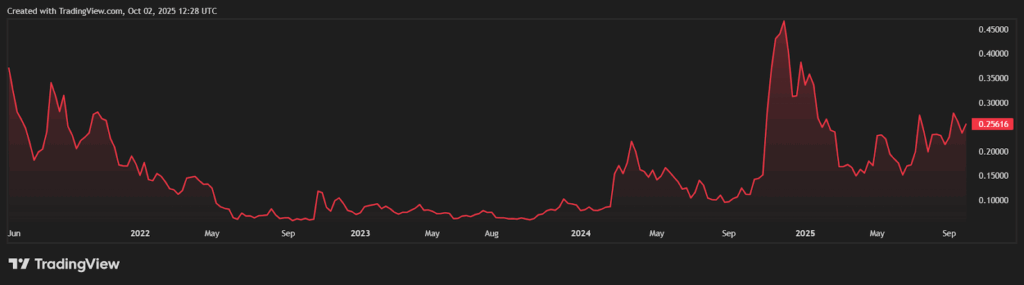
At present, DOGE trades near $0.25–$0.28 USD. Its market cap hovers around $35–40 billion. Its most famous run came in 2021, when meme energy, Elon Musk mentions, and speculative mania combined.

Dogecoin’s price peaked at roughly $0.74 in May 2021. That represented a phenomenal leap from its earlier baseline, on the order of over 10000% when measured from sub-cent levels. But that run was driven largely by hype, community coordination, and social momentum, factors notoriously hard to repeat, especially now with so much scrutiny and competition.

Because Dogecoin’s supply is extremely large and its utility minimal, sustaining a similar surge today would demand massive capital inflow and renewed speculative zeal. Given market maturity and competition, such magnitude is less plausible now.

That said, more modest gains are not off the table. A 150–175% increase over the next 12–24 months, doubling or nearly tripling from current levels, is within the spectrum of what meme-coin momentum might still deliver if sentiment revives.

New Crypto That Could Echo DOGE’s Move

Mutuum Finance (MUTM) is a DeFi protocol purpose-built for lending and borrowing, with demand mechanics embedded into its architecture. Running on Ethereum in a non-custodial model, the protocol ensures that users always retain control of their assets while every action on the platform, whether it’s supplying liquidity, borrowing against collateral, or staking tokens, feeds directly back into MUTM’s demand cycle. 

The presale has followed a carefully structured trajectory. Launched in early 2025 at just $0.01 in Phase 1, MUTM has since advanced through multiple phases, now standing at $0.035 in Phase 6. That translates into 250% appreciation for the earliest participants, while still offering fresh entrants a clear pathway toward gains with the $0.06 listing price fixed in the roadmap.

To date, Mutuum Finance has raised more than $16.8 million, allocated over 740 million tokens, and built a community of 16,700 holders, a scale that demonstrates both momentum and trust.

MUTM vs DOGE

In the short run, Mutuum Finance (MUTM) has several advantages that Dogecoin (DOGE) no longer enjoys. One of the most notable is its commitment to launching a working beta platform at the exact moment the token lists. This means holders will not be left waiting for months to see functionality; instead, they can immediately begin supplying assets, borrowing, and staking, generating real activity and volume from day one.

Another advantage lies in its dual lending markets. The protocol will support both Peer-to-Contract (P2C) pooled markets for mainstream assets such as ETH and stablecoins, as well as Peer-to-Peer (P2P) isolated agreements for higher-risk or less liquid tokens. This combination creates flexibility by serving multiple use cases while ensuring that the wider ecosystem remains insulated from the risks associated with volatile assets.

Once these mechanics gain adoption early and are supported by exchange listings that provide liquidity, analysts believe MUTM could realistically establish a trading range of $0.20 to $0.30 within its first 6 to 12 months of launch. This would place it well above the official listing price of $0.06, while still requiring steady traction to unlock its full potential.

Mid-Term Drivers

For the mid term, Mutuum Finance (MUTM) shows its real strength through the way incentives are built into the protocol. Liquidity providers receive mtTokens, which not only accrue interest but can also be staked in the safety module. This creates multiple layers of utility and encourages users to remain active, locking liquidity into the system rather than treating the token as something to flip quickly.

Another powerful mechanism is the buy-and-distribute model. A share of protocol fees is used to purchase MUTM directly from the open market, and those purchased tokens are then redistributed to mtToken stakers. This design creates a self-reinforcing loop where increased platform activity naturally leads to more buy pressure and higher rewards, aligning user participation with token value growth.

Once adoption builds steadily and users continue to engage with these mechanics, analysts suggest that a mid-term valuation in the range of $0.60 to $1.00 is realistic under bullish execution. From today’s presale price of $0.035, that represents 10x to 30x upside potential, a figure that underscores why investors see MUTM as more than just another DeFi presale.

Long-Term Catalysts & Supportive Structure

Looking ahead to 2027, the larger drivers of Mutuum Finance (MUTM) start to come into focus. One of the most anticipated milestones is the launch of an overcollateralized stablecoin, which would provide the ecosystem with its own native unit of account. By anchoring liquidity internally rather than depending entirely on external stable assets, this step could deepen lending and borrowing activity while creating a more self-sustaining economy.

Equally important is the plan to expand onto Layer-2 networks. Lowering transaction costs and reducing friction is key for frequent interactions such as lending, rebalancing, and refinancing. By scaling in this way, Mutuum Finance could open the door to far greater adoption, as users who might hesitate at high fees on Ethereum would have a smoother entry point on faster, cheaper networks.

When these factors converge, stablecoin adoption, active staking, expanding usage, and secure scaling, analysts suggest MUTM could realistically enter the $1.50 to $2.00 range by 2027. That kind of appreciation would rival the percentage multiples seen during Dogecoin’s early surge, but with the critical difference that MUTM’s growth would be rooted in structural utility rather than sentiment alone.

Final Thoughts

The project has already completed a CertiK audit with a strong 90/100 Token Scan score and launched a $50,000 bug bounty across multiple reward tiers to ensure rigorous third-party testing. Transparency has been another focus, with a live presale dashboard, contributor leaderboards, and a $100,000 community giveaway helping to build trust well before mainnet launch. These measures give Mutuum Finance (MUTM) a foundation of credibility that many early-stage projects lack.

Dogecoin’s 2021 surge was remarkable, but replicating that kind of parabolic move under current market conditions is unlikely. Analysts view a 150–175% rise as far more realistic than another 10,000% run.

Mutuum Finance, however, positions itself differently. Instead of chasing cultural momentum, it is constructing the infrastructure for lending and borrowing in DeFi, creating demand through mechanics like dual markets, staking, and fee redistribution. This structural approach gives it the potential for sustained appreciation where meme coins depend only on sentiment.

For more information about Mutuum Finance (MUTM) visit the links below:

Disclaimer: This content does not have journalistic/editorial involvement of Trade Brains Team. Readers are encouraged to conduct their own research before making any decisions.

Source link

6 10, 2025

XAG/USD holds gains at multi-year highs above $48.30

By |2025-10-06T15:45:58+03:00October 6, 2025|Forex News, News|0 Comments


Silver (XAG/USD) appreciates for the second consecutive day on Monday, to reach fresh 4-year highs at $48.75, with downside attempts contained so far above last week’s highs at $48.30.
 

Precious metals are thriving on Monday as a combination of a US government shutdown, which looks to be an extended one, expectations of a looser monetary policy in Japan, and the growing political uncertainty in France, have prompted investors to find alternative assets.

Technical analysis: Key resistance lies right above $49.00

From a technical perspective, the pair remains trading higher within an ascending channel from id September lows. The 4-Hour RSI, however, is showing some bearish divergence, which should act as a warning for buyers.

Bulls are likely to be challenged at $ 49.24-$49.30, where the 161.8% of the September 17 to September 24 range meets the top of the ascending channel. Further up, the $50.00 psychological level emerges as the next bullish target..

Downside attempts are being contained above $48.30 (September 3 high) for now. Below here, the 47.60 area (Intra-day support and trendline support, at $46.90 would come into focus.

Silver FAQs

Silver is a precious metal highly traded among investors. It has been historically used as a store of value and a medium of exchange. Although less popular than Gold, traders may turn to Silver to diversify their investment portfolio, for its intrinsic value or as a potential hedge during high-inflation periods. Investors can buy physical Silver, in coins or in bars, or trade it through vehicles such as Exchange Traded Funds, which track its price on international markets.

Silver prices can move due to a wide range of factors. Geopolitical instability or fears of a deep recession can make Silver price escalate due to its safe-haven status, although to a lesser extent than Gold’s. As a yieldless asset, Silver tends to rise with lower interest rates. Its moves also depend on how the US Dollar (USD) behaves as the asset is priced in dollars (XAG/USD). A strong Dollar tends to keep the price of Silver at bay, whereas a weaker Dollar is likely to propel prices up. Other factors such as investment demand, mining supply – Silver is much more abundant than Gold – and recycling rates can also affect prices.

Silver is widely used in industry, particularly in sectors such as electronics or solar energy, as it has one of the highest electric conductivity of all metals – more than Copper and Gold. A surge in demand can increase prices, while a decline tends to lower them. Dynamics in the US, Chinese and Indian economies can also contribute to price swings: for the US and particularly China, their big industrial sectors use Silver in various processes; in India, consumers’ demand for the precious metal for jewellery also plays a key role in setting prices.

Silver prices tend to follow Gold’s moves. When Gold prices rise, Silver typically follows suit, as their status as safe-haven assets is similar. The Gold/Silver ratio, which shows the number of ounces of Silver needed to equal the value of one ounce of Gold, may help to determine the relative valuation between both metals. Some investors may consider a high ratio as an indicator that Silver is undervalued, or Gold is overvalued. On the contrary, a low ratio might suggest that Gold is undervalued relative to Silver.


Source link

6 10, 2025

US Dollar Rallies Against JPY

By |2025-10-06T15:41:18+03:00October 6, 2025|Forex News, News|0 Comments

  • The US dollar rallied against the Japanese yen during the early hours on Friday, but we have seen a certain amount of resistance in this market, as this pair continues to be very noisy.
  • That doesn’t surprise me, because it has been very choppy for months, even though we at one point got a bit of a “false break out.” The candlestick for the Friday session looks like it is going to close positive, but I also recognize that the 200 Day EMA has offered significant resistance, and therefore it suggests that perhaps the market isn’t quite ready to take off to the upside, and we may be stuck in the same consolidation for a while.

Technical Analysis

The technical analysis for this market is very sideways and has been for a while, with the brief exception of a quick attempt to break out and above the ¥149 level. The market continues to see a lot of noisy behavior but that makes sense because quite frankly there are a lot of questions out there as to whether or not we are going to see risk appetite pick up or drop. Furthermore, you also have to keep in mind that recently we have been bouncing around between the ¥146 level on the bottom, and the ¥149 level on the top. As we try to break out of there, we have seen a complete repudiation of that, but we have not broken down below the ¥146 level with any significance to show signs of potentially continued bearishness.

Ultimately, I still like the idea of buying short-term dips looking for collecting swaps at the end of each day, as interest rate differential still most certainly favors the United States dollar. If we get any type of “risk on move” in the overall markets, then it’s likely that this pair will rally as well. I still favor the upside but I fully admit that this is a very noisy and choppy market.

Want to trade our USD/JPY forex analysis and predictions? Here’s a list of forex brokers in Japan to check out.

Christopher Lewis has been trading Forex and has over 20 years experience in financial markets. Chris has been a regular contributor to Daily Forex since the early days of the site. He writes about Forex for several online publications, including FX Empire, Investing.com, and his own site, aptly named The Trader Guy. Chris favours technical analysis methods to identify his trades and likes to trade equity indices and commodities as well as Forex. He favours a longer-term trading style, and his trades often last for days or weeks.

Source link

6 10, 2025

Vitamin B12 Ingredient Market | Global Market Analysis Report

By |2025-10-06T15:39:51+03:00October 6, 2025|Dietary Supplements News, News|0 Comments


Vitamin B12 Ingredient Market Size and Share Forecast Outlook 2025 to 2035

The global vitamin B12 ingredient market is projected at USD 0.3 million in 2025 and is anticipated to reach USD 0.5 million by 2035, expanding at a CAGR of 5.8% over the forecast period. A breakpoint analysis highlights key inflection points where market growth experiences noticeable shifts, reflecting both demand surges and periods of relative stabilization. In the initial phase, from USD 0.2 million to USD 0.3 million, the market shows steady gains driven by early adoption in dietary supplements, fortified foods, and nutraceutical applications. This stage represents the first breakpoint, marking the transition from niche utilization to broader incorporation in health-oriented formulations.

As the market progresses from USD 0.3 million to USD 0.4 million, incremental growth reflects rising consumer awareness about vitamin B12’s role in energy metabolism, neurological health, and vegetarian or vegan dietary needs, establishing the second breakpoint where adoption accelerates slightly. In the later phase, from USD 0.4 million to USD 0.5 million, the market reaches maturity, with adoption stabilized across supplements, functional beverages, and specialized health products, reflecting consistent demand but limited scope for sudden spikes. Overall, the breakpoint analysis demonstrates that the vitamin B12 ingredient market experiences measured growth punctuated by identifiable adoption points, emphasizing the gradual shift from early-stage acceptance to steady integration into mainstream nutritional products.

Quick Stats for Vitamin B12 Ingredient Market

  • Vitamin B12 Ingredient Market Value (2025): USD 0.3 million
  • Vitamin B12 Ingredient Market Forecast Value (2035): USD 0.5 million
  • Vitamin B12 Ingredient Market Forecast CAGR: 5.8%
  • Leading Segment in Vitamin B12 Ingredient Market in 2025: Cyanocobalamin (39.7%)
  • Key Growth Regions in Vitamin B12 Ingredient Market: North America, Asia-Pacific, Europe
  • Top Key Players in Vitamin B12 Ingredient Market: Adisseo, BASF SE, DSM Nutritional Products, Gnosis by Lesaffre, Jubilant Life Sciences, Lonza, Merck KGaA, NOW Foods, NutraGenesis, Nutrilo, Pharmavit, Rousselot, Spectrum Chemical Manufacturing, Thermo Fisher Scientific, Zhejiang Shengda Bio-Pharm

Vitamin B12 Ingredient Market Key Takeaways


Metric Value
Vitamin B12 Ingredient Market Estimated Value in (2025 E) USD 0.3 million
Vitamin B12 Ingredient Market Forecast Value in (2035 F) USD 0.5 million
Forecast CAGR (2025 to 2035) 5.8%

The vitamin B12 ingredient market is closely influenced by five interconnected parent markets that collectively drive its adoption and long-term growth. The largest contributor is the dietary supplements and nutraceuticals market, which accounts for about 40% share, as vitamin B12 is widely used in capsules, tablets, powders, and liquid formulations targeting energy support, cognitive health, and anemia prevention. The functional food and beverage sector contributes around 25%, driven by the fortification of products such as energy drinks, breakfast cereals, dairy alternatives, and meal replacements to meet increasing consumer demand for health-promoting ingredients. The pharmaceutical and clinical nutrition market holds close to 15% influence, supported by prescription and over-the-counter formulations that utilize vitamin B12 for treating deficiency-related conditions and supporting metabolic functions.

The animal feed and pet nutrition industry adds nearly 12%, as vitamin B12 is incorporated into livestock and companion animal feed to ensure proper growth, reproduction, and overall health. The biotechnology and fermentation technology sector contributes close to 8%, as advanced microbial fermentation processes are employed to produce high-purity, bioavailable vitamin B12 ingredients efficiently. The distribution of market influence shows that dietary supplements and functional foods form the backbone of this market, while pharmaceutical, animal nutrition, and biotech innovations continue to expand its commercial relevance.

Why is the Vitamin B12 Ingredient Market Growing?

The vitamin B12 ingredient market is witnessing steady expansion, driven by rising consumer awareness regarding micronutrient deficiencies and their impact on metabolic and neurological health. The current landscape reflects a growing incorporation of vitamin B12 in fortified foods, dietary supplements, and clinical nutrition, spurred by an aging population and the increasing prevalence of vegan and vegetarian diets that typically lack sufficient cobalamin intake.

Regulatory frameworks and nutritional guidelines recommending regular B12 intake have further supported market penetration, particularly in pharmaceutical and nutraceutical formulations. Moreover, the scalability of vitamin B12 production through both biosynthetic and chemical synthesis methods has contributed to improved availability and cost efficiency across regions.

Future market growth is expected to be underpinned by enhanced clinical research, continued product innovation, and strategic investments by ingredient manufacturers in high-purity and bioavailable B12 variants. As global health initiatives continue emphasizing preventative nutrition, the vitamin B12 ingredient market is projected to evolve as a vital component of the broader health and wellness ecosystem.

Segmental Analysis

The vitamin b12 ingredient market is segmented by form, source, application, end use, and geographic regions. By form, vitamin b12 ingredient market is divided into Cyanocobalamin, Methylcobalamin, Hydroxocobalamin, and Adenosylcobalamin. In terms of source, vitamin b12 ingredient market is classified into Animal-Based and Plant-Based. Based on application, vitamin b12 ingredient market is segmented into Pharmaceuticals, Dietary Supplements, Medications, Food and Beverages, Fortified Foods, Energy Drinks and Shots, Infant Formula, Cosmetics and Personal Care, Skin Care Products, Hair Care Products, Oral Care Products, and Animal Feed and Nutrition. By end use, vitamin b12 ingredient market is segmented into Human Nutrition and Animal Nutrition. Regionally, the vitamin b12 ingredient industry is classified into North America, Latin America, Western Europe, Eastern Europe, Balkan & Baltic Countries, Russia & Belarus, Central Asia, East Asia, South Asia & Pacific, and the Middle East & Africa.

Insights into the Cyanocobalamin Segment

Vitamin B12 Ingredient Market Analysis By Form

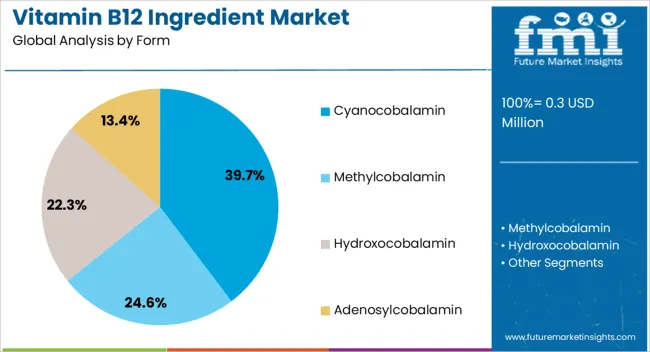
The cyanocobalamin segment leads the form category within the vitamin B12 ingredient market, contributing approximately 39.7% to the overall share. Its dominance is attributed to widespread industrial preference due to its chemical stability, long shelf life, and compatibility with multiple delivery formats such as tablets, capsules, and injectables.

Cyanocobalamin is the most commonly used synthetic form of vitamin B12 in fortified foods and supplements, favored for its cost-effectiveness and ease of mass production. Despite emerging interest in alternative bioactive forms like methylcobalamin, cyanocobalamin continues to outperform in terms of commercial scalability and regulatory acceptance across key markets.

Its reliable absorption and proven efficacy in treating B12 deficiency further reinforce its position in both therapeutic and preventive health segments. As innovation in formulation and delivery systems advances, the segment is expected to sustain its leadership, driven by persistent demand from manufacturers prioritizing formulation stability and affordability.

Insights into the Animal-Based Segment

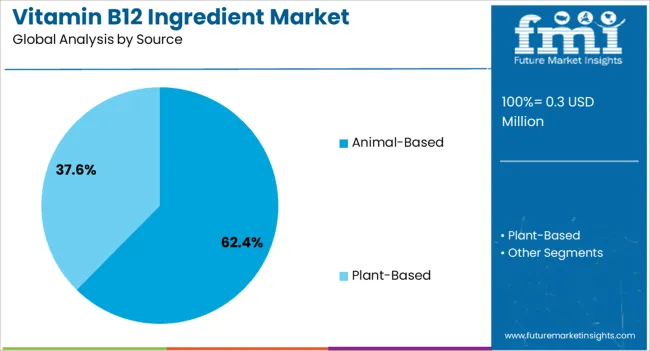
Vitamin B12 Ingredient Market Analysis By Source

The animal-based segment dominates the source category, accounting for approximately 62.4% of the total vitamin B12 ingredient market. This leadership is primarily supported by the historically established extraction processes from animal tissues and the high bioavailability associated with naturally derived B12 compounds.

The segment benefits from regulatory trust and consumer confidence in the efficacy of animal-origin ingredients, particularly within clinical and pharmaceutical applications. Moreover, established supply chains and processing infrastructure contribute to the cost-effectiveness and consistent quality of animal-based B12 production.

Despite the rise of fermentation-derived and plant-based alternatives targeting vegan demographics, animal-derived sources continue to lead due to their compatibility with high-potency formulations and extensive clinical validation. Given their established usage and superior efficacy in critical deficiency treatments, animal-based vitamin B12 ingredients are anticipated to maintain a dominant share, particularly in applications where therapeutic precision and proven absorption rates are essential.

Insights into the Pharmaceuticals Segment

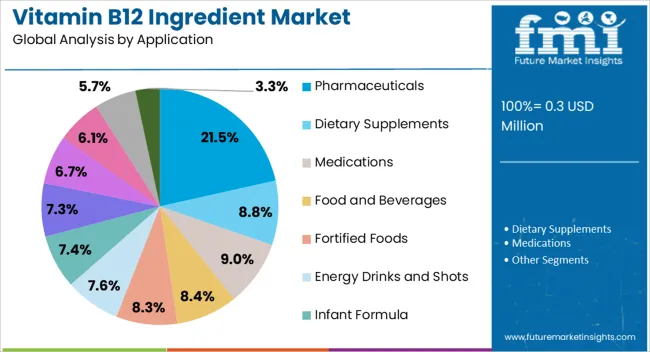
Vitamin B12 Ingredient Market Analysis By Application

The pharmaceuticals segment leads the application category in the vitamin B12 ingredient market, holding a share of approximately 21.5%. This prominence stems from the essential role of vitamin B12 in treating conditions such as pernicious anemia, neuropathy, and other B12-deficiency-related disorders.

Pharmaceutical-grade B12 is utilized in various delivery forms including injectables, oral tablets, and sublingual formulations, driven by strong clinical demand and reimbursement support in several countries. The segment also benefits from a steady increase in chronic disease incidence, aging populations, and heightened awareness among healthcare professionals about the neurological implications of prolonged B12 deficiency.

Rigorous regulatory standards and high product purity requirements further reinforce the segment’s reliance on well-established, bioavailable B12 compounds. As global healthcare systems continue prioritizing early diagnosis and micronutrient supplementation, the pharmaceutical segment is expected to retain its leading market share, supported by continuous clinical research and therapeutic innovation.

What are the Drivers, Restraints, and Key Trends of the Vitamin B12 Ingredient Market?

The Vitamin B12 ingredient market is shaped by rising demand from dietary supplements, expansion in functional foods and fortified beverages, advances in production and formulation technologies, and regional market growth supported by consumer awareness. Increasing prevalence of B12 deficiency, interest in preventive healthcare, and adoption of plant-based diets are driving ingredient adoption. Enhanced delivery systems and stable formulations are improving product effectiveness and versatility. Retail, e-commerce, and regional partnerships are ensuring accessibility and market penetration. Together, these dynamics are fostering steady growth, expanding applications across nutraceutical, food, and beverage sectors, and strengthening the role of Vitamin B12 as a critical nutritional ingredient globally.

Growing Demand from Nutraceutical and Dietary Supplements

The market is witnessing growth due to rising consumer interest in dietary supplements and nutraceutical products. Vitamin B12 is essential for nerve function, red blood cell formation, and energy metabolism, making it a key ingredient in multivitamins, fortified foods, and beverages. Increasing awareness of deficiency-related health issues, particularly among vegetarians, vegans, and aging populations, is driving adoption. Manufacturers of dietary supplements are incorporating B12 in tablets, capsules, gummies, and liquid formulations to meet diverse consumer needs. The growth of preventive healthcare and wellness-oriented products is creating consistent demand, supporting market expansion globally.

Expansion in Functional Foods and Fortified Beverages

Vitamin B12 is being increasingly added to functional foods, fortified beverages, and plant-based alternatives to enhance nutritional value. Breakfast cereals, energy drinks, protein powders, and dairy substitutes are commonly enriched with B12 to meet daily dietary requirements. Food and beverage manufacturers are leveraging consumer demand for convenient nutrition solutions that support energy, immunity, and overall wellness. Regulatory guidelines for fortification and labeling are being followed to ensure quality and consumer trust. The incorporation of B12 in diverse product categories is broadening its application base and driving ingredient adoption across health-focused food and beverage segments worldwide.

Advances in Production and Formulation Technologies

Market players are investing in advanced production and formulation techniques to improve stability, bioavailability, and compatibility of Vitamin B12 ingredients. Microencapsulation, powder formulations, and liquid delivery systems are enhancing shelf life and absorption efficiency. Fermentation-based and synthetic production methods are being optimized to meet large-scale demand while maintaining cost-effectiveness. Ingredient manufacturers are focusing on consistency, purity, and regulatory compliance to appeal to nutraceutical, food, and beverage sectors. Technological improvements in formulation and delivery mechanisms are expanding the versatility of B12 applications and supporting wider adoption in both mainstream and specialty product segments.

Regional Market Expansion and Consumer Awareness

The Vitamin B12 ingredient market is growing across North America, Europe, and Asia-Pacific due to increasing health awareness and nutritional supplementation trends. Rising incidence of B12 deficiency and adoption of plant-based diets in urban populations are encouraging fortification and supplementation. Regional manufacturers and distributors are partnering with global ingredient suppliers to improve availability and reduce lead times. Retail expansion, online sales, and e-commerce platforms are enhancing consumer access to B12-enriched products. Educational campaigns and promotional activities are increasing awareness of the health benefits of B12, driving adoption and reinforcing the market’s growth trajectory across multiple regions.

Analysis of Vitamin B12 Ingredient Market By Key Countries

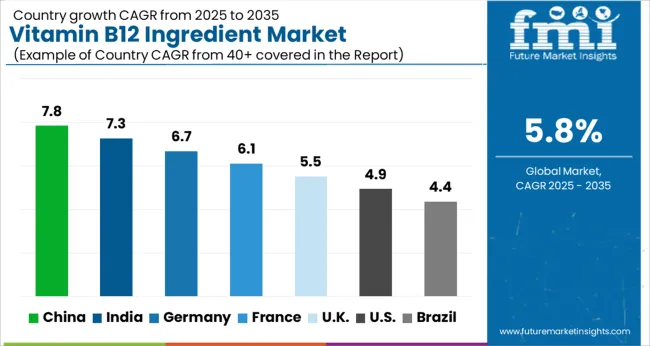
Vitamin B12 Ingredient Market Cagr Analysis By Country


Country CAGR
China 7.8%
India 7.3%
Germany 6.7%
France 6.1%
UK 5.5%
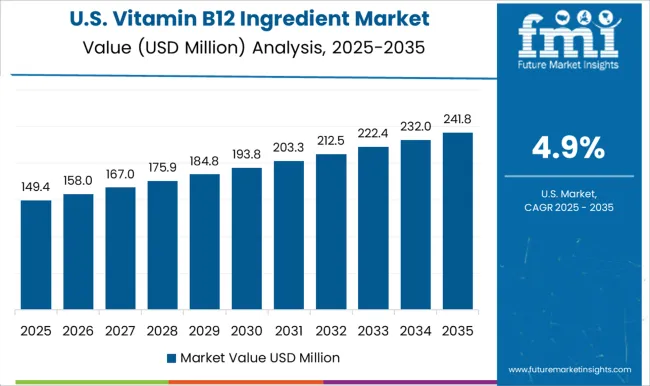
USA 4.9%
Brazil 4.4%

The global vitamin B12 ingredient market is projected to grow at a CAGR of 5.8% from 2025 to 2035. China leads with 7.8%, followed by India at 7.3%, Germany at 6.7%, the UK at 5.5%, and the USA at 4.9%. Growth is driven by increasing demand for dietary supplements, fortified foods, and functional beverages, alongside rising consumer awareness of vitamin deficiencies. BRICS countries, particularly China and India, are scaling fermentation production, ingredient standardization, and distribution networks to meet domestic and export demand. OECD nations such as Germany, the UK, and the USA emphasize quality control, regulatory compliance, and formulation innovations to enhance efficacy and market penetration. The analysis spans over 40+ countries, with the leading markets detailed below.

Growth Analysis of Vitamin B12 Ingredient Market in China

The vitamin B12 ingredient market in China is projected to grow at a CAGR of 7.8% from 2025 to 2035, driven by increasing demand for fortified foods, dietary supplements, and functional beverages. Rising awareness about vitamin deficiencies, particularly among aging populations and urban consumers, supports the adoption of B12-enriched products. Nutraceutical and pharmaceutical companies are incorporating vitamin B12 in formulations targeting energy metabolism, cognitive health, and overall wellness. Growth in e-commerce and modern retail channels enhances accessibility for consumers. Government regulations on nutrient fortification and food safety further strengthen market adoption and drive product innovation.

  • Fortified foods and dietary supplements boosting demand
  • Consumer awareness about vitamin deficiencies driving adoption
  • Regulatory support encouraging product innovation and fortification

Sales Outlook of Vitamin B12 Ingredient Market in India

The vitamin B12 ingredient market in India is expected to grow at a CAGR of 7.3% from 2025 to 2035, supported by rising health consciousness and increased consumption of fortified foods and dietary supplements. The vegetarian population in India creates higher demand for B12-fortified products, as natural sources are limited. Pharmaceutical and nutraceutical manufacturers are incorporating vitamin B12 in energy boosters, cognitive health supplements, and functional beverages. Growth in e-commerce platforms and modern retail stores enhances product availability across urban and semi-urban regions. Government initiatives promoting nutritional awareness and food fortification further support market growth.

  • High vegetarian population increasing B12-fortified product demand
  • Fortified foods and supplements supporting health-conscious consumers
  • E-commerce and retail expansion enhancing market accessibility

Growth Analysis of Vitamin B12 Ingredient Market in Germany

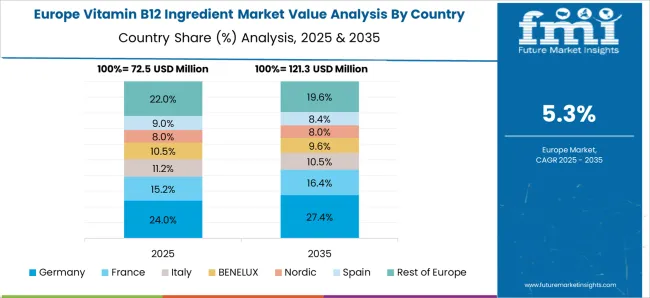
Vitamin B12 Ingredient Market Europe Country Market Share Analysis, 2025 & 2035

The vitamin B12 ingredient market in Germany is projected to grow at a CAGR of 6.7% from 2025 to 2035, driven by strong demand for dietary supplements, functional foods, and nutraceutical products. Aging population and growing awareness of vitamin deficiencies encourage consumption of B12-enriched formulations. The pharmaceutical and food industries are actively incorporating vitamin B12 in capsules, beverages, and fortified snacks. Regulatory compliance with EU food fortification standards ensures product safety and quality, fostering consumer confidence. Trends toward vegan and vegetarian diets further increase reliance on fortified products, strengthening market adoption.

  • Dietary supplements and functional foods driving growth
  • Aging population increasing vitamin B12 consumption
  • Vegan and vegetarian trends boosting fortified product demand

Demand Prospects of Vitamin B12 Ingredient Market in the United Kingdom

The vitamin B12 ingredient market in the UK is expected to grow at a CAGR of 5.5% from 2025 to 2035, supported by increasing interest in dietary supplements, fortified foods, and functional beverages. Consumer awareness about energy metabolism, cognitive health, and nutritional deficiencies drives adoption. Pharmaceutical and nutraceutical companies are incorporating vitamin B12 in energy boosters, wellness products, and specialized formulations for targeted health benefits. Retail expansion, e-commerce growth, and health-focused marketing campaigns enhance product accessibility. Government regulations on food fortification, labeling, and supplement quality further encourage safe and effective usage.

  • Dietary supplements and fortified foods boosting adoption
  • Consumer awareness about cognitive and energy health
  • Retail and e-commerce growth improving product availability

Future Insights into Vitamin B12 Ingredient Market in the United States

Vitamin B12 Ingredient Market Country Value Analysis

The vitamin B12 ingredient market in the USA is projected to grow at a CAGR of 4.9% from 2025 to 2035, driven by high demand for dietary supplements, functional beverages, and fortified foods. Consumers increasingly focus on energy support, cognitive function, and overall wellness, creating strong adoption of B12-enriched products. Nutraceutical and pharmaceutical companies are innovating with capsule, powder, and beverage formulations to cater to diverse consumer needs. Expansion of online retail and health-focused stores enhances accessibility nationwide. Regulatory standards ensuring safety, quality, and accurate labeling strengthen consumer trust and drive market expansion.

  • High consumer demand for supplements and functional foods
  • Focus on energy and cognitive health driving B12 adoption
  • Retail and online channels expanding accessibility nationwide

Competitive Landscape of Vitamin B12 Ingredient Market

Vitamin B12 Ingredient Market Analysis By Company

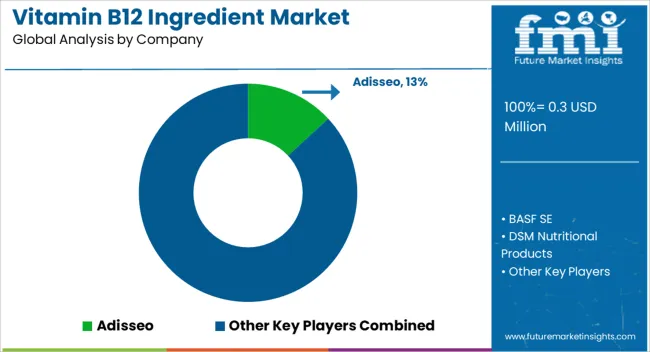
Competition in the vitamin B12 ingredient market is shaped by production technology, purity standards, and application versatility. Adisseo, BASF SE, DSM Nutritional Products, Gnosis by Lesaffre, Jubilant Life Sciences, Lonza, Merck KGaA, NOW Foods, NutraGenesis, Nutrilo, Pharmavit, Rousselot, Spectrum Chemical Manufacturing, Thermo Fisher Scientific, and Zhejiang Shengda Bio-Pharm lead by offering high-purity cyanocobalamin, methylcobalamin, and adenosylcobalamin for use in dietary supplements, fortified foods, beverages, and pharmaceutical applications. Product differentiation is achieved through fermentation-based or chemical synthesis methods, advanced encapsulation technologies, stability enhancement, and compliance with global quality standards such as USP, FCC, and ISO. Mid-tier and regional players focus on customized formulations, small-batch production, and rapid delivery services for nutraceutical and functional food manufacturers, catering to demand for personalized nutrition solutions.

Strategies across leading companies emphasize research-driven product innovation, regulatory compliance, and diversified application portfolios. Microencapsulation, slow-release technologies, and co-formulation with other vitamins and minerals are leveraged as critical differentiators to enhance bioavailability, stability, and consumer appeal. Differentiation is further strengthened through proprietary production methods, supply chain transparency, and tailored ingredient solutions for food, beverage, and supplement manufacturers. Companies strive to strike a balance between cost efficiency and high-quality standards, ensuring consistent potency, safety, and stability while meeting regulatory requirements across multiple regions. The market reflects strong competition based on purity, bioavailability, and versatility, where global and regional players maintain leadership by delivering high-quality vitamin B12 ingredients with reliable supply chains and application support. Continuous innovation in fermentation, synthesis, and delivery systems drives growth, while customer-centric strategies, customized solutions, and regulatory expertise reinforce competitive positioning. The vitamin B12 ingredient market exhibits a dynamic landscape characterized by technological advancements, product differentiation, and growing demand for nutraceuticals and fortified foods.

Key Players in the Vitamin B12 Ingredient Market

  • Adisseo
  • BASF SE
  • DSM Nutritional Products
  • Gnosis by Lesaffre
  • Jubilant Life Sciences
  • Lonza
  • Merck KGaA
  • NOW Foods
  • NutraGenesis
  • Nutrilo
  • Pharmavit
  • Rousselot
  • Spectrum Chemical Manufacturing
  • Thermo Fisher Scientific
  • Zhejiang Shengda Bio-Pharm

Scope of the Report


Item Value
Quantitative Units USD 0.3 Million
Form Cyanocobalamin, Methylcobalamin, Hydroxocobalamin, and Adenosylcobalamin
Source Animal-Based and Plant-Based
Application Pharmaceuticals, Dietary Supplements, Medications, Food and Beverages, Fortified Foods, Energy Drinks and Shots, Infant Formula, Cosmetics and Personal Care, Skin Care Products, Hair Care Products, Oral Care Products, and Animal Feed and Nutrition
End Use Human Nutrition and Animal Nutrition
Regions Covered North America, Europe, Asia-Pacific, Latin America, Middle East & Africa
Country Covered United States, Canada, Germany, France, United Kingdom, China, Japan, India, Brazil, South Africa
Key Companies Profiled Adisseo, BASF SE, DSM Nutritional Products, Gnosis by Lesaffre, Jubilant Life Sciences, Lonza, Merck KGaA, NOW Foods, NutraGenesis, Nutrilo, Pharmavit, Rousselot, Spectrum Chemical Manufacturing, Thermo Fisher Scientific, and Zhejiang Shengda Bio-Pharm
Additional Attributes Dollar sales, share, form demand (capsule, powder, liquid), regional adoption, end-use segments, competitor landscape, pricing trends, fortification and supplementation trends, bioavailability focus, regulatory compliance, functional food applications, nutraceutical growth.


Source link

Go to Top