About Editorial team of BIPNs

Main team of content of bipns.com. Any type of content should be approved by us.
26 09, 2025

XAU/USD awaits the US PCE inflation for fresh impetus

By |2025-09-26T19:20:11+03:00September 26, 2025|Forex News, News|0 Comments


  • Gold returns to the red below $3,750 early Friday, eyeing US PCE inflation.   
  • US Dollar sits at three-week highs as US economic resilience counters Trump’s fresh tariffs.  
  • Technically, Gold remains a ‘buy-the-dips’ trade but the upcoming US data holds the key.

Gold is back on its corrective journey below $3,750 in Friday’s Asian trades, after having staged a tepid bounce on Thursday. All eyes now remain on the US core Personal Consumption Expenditures (PCE) Price Index due later in the day for a fresh directional impetus.

Will US PCE inflation revive the Gold record rally?

Reduced bets for aggressive interest rate cuts by the US Federal Reserve (Fed) this year offset renewed jitters fuelled by US President Donald Trump’s latest round of tariffs, helping the US Dollar (USD) holds its recent uptrend at the expense of Gold.

Encouraging US data released on Thursday highlighted the economic resilience, pouring cold water on aggressive Fed easing expectations.

US Gross Domestic Product rose by an upwardly revised rate of 3.8% from April through June, higher than 3.3% initially reported.

Meanwhile, the Labour Department reported 218,000 seasonally adjusted filings for the week ending September 20, down 14,000 from the prior week’s upwardly revised figure and below the consensus estimate of 235,000.

Additionally, Durable Goods Orders rebounded firmly by 2.9% in August versus the previously revised -2.7% and -0.5% expected.

Trump on Thursday announced tariffs of up to 100% on imports of branded and patented pharmaceutical drugs, starting October 1. Trump also slapped 50% tariffs on imports of kitchen cabinets and bathroom vanities, 30% on upholstered furniture, and 25% on heavy trucks.

Markets weigh the latest Trump’s tariffs, while gearing up for the critical US PCE inflation data due later this Friday. The data will confirm whether the Fed will remain on track for two rate cuts this year.

The Fed’s preferred inflation measure, the core PCE Price Index, is expected to rise by 2.9% in August, at the same pace seen in July. The headline annual PCE inflation is set to tick higher to 2.7% in the same period, against July’s 2.6%.

An upside surprise to the core PCE print could bolster the USD rally and weigh further on the non-interest-bearing Gold price. A sudden increase in price pressure could further temper expectations of more Fed cuts.

On the other hand, a softer-than-expected US core PCE reading would be welcomed by the Fed

In the lead-up to the US PCE showdown, the FXStreet Fed Sentiment Index extends its foothold in the hawkish zone, trading near 114 as of writing, up from around 105 levels seen a day ago.

Gold price technical analysis: Daily chart

Technically, the bearish pressures seem to have eased a bit as the 14-day Relative Strength Index (RSI) moves out of the extreme overbought region.

The leading indicator currently trades at 71.50, down from 78 levels seen at the start of the week.

If the pullback regains momentum, the initial support is seen at the $3,700 threshold, below which Monday’s low of $3,684 will offer some comfort.

Further down, the $3,650 psychological barrier could come to the rescue of buyers.

On the other hand, buyers need acceptance above the $3,750 psychological level to revive the record rally.

The next topside hurdle is located at the lifetime high of $3,791, followed by the $3,800 barrier.

A sustained and decisive break above the latter could fuel a fresh advance toward the $3,850 psychological level.

Inflation FAQs

Inflation measures the rise in the price of a representative basket of goods and services. Headline inflation is usually expressed as a percentage change on a month-on-month (MoM) and year-on-year (YoY) basis. Core inflation excludes more volatile elements such as food and fuel which can fluctuate because of geopolitical and seasonal factors. Core inflation is the figure economists focus on and is the level targeted by central banks, which are mandated to keep inflation at a manageable level, usually around 2%.

The Consumer Price Index (CPI) measures the change in prices of a basket of goods and services over a period of time. It is usually expressed as a percentage change on a month-on-month (MoM) and year-on-year (YoY) basis. Core CPI is the figure targeted by central banks as it excludes volatile food and fuel inputs. When Core CPI rises above 2% it usually results in higher interest rates and vice versa when it falls below 2%. Since higher interest rates are positive for a currency, higher inflation usually results in a stronger currency. The opposite is true when inflation falls.

Although it may seem counter-intuitive, high inflation in a country pushes up the value of its currency and vice versa for lower inflation. This is because the central bank will normally raise interest rates to combat the higher inflation, which attract more global capital inflows from investors looking for a lucrative place to park their money.

Formerly, Gold was the asset investors turned to in times of high inflation because it preserved its value, and whilst investors will often still buy Gold for its safe-haven properties in times of extreme market turmoil, this is not the case most of the time. This is because when inflation is high, central banks will put up interest rates to combat it.
Higher interest rates are negative for Gold because they increase the opportunity-cost of holding Gold vis-a-vis an interest-bearing asset or placing the money in a cash deposit account. On the flipside, lower inflation tends to be positive for Gold as it brings interest rates down, making the bright metal a more viable investment alternative.




Source link

26 09, 2025

Euro shows no signs of an extended recovery

By |2025-09-26T19:19:02+03:00September 26, 2025|Forex News, News|0 Comments

  • EUR/USD corrects higher following a sharp two-day decline.
  • The near-term technical outlook doesn’t offer any hints of a reversal.
  • The US economic calendar will feature PCE inflation data for August.

EUR/USD continued to push lower following Wednesday’s decline and closed deep in negative territory on Thursday. The pair stays relatively quiet in the European session on Friday, while the technical outlook suggests that the bearish bias remains intact.

Euro Price Today

The table below shows the percentage change of Euro (EUR) against listed major currencies today. Euro was the weakest against the US Dollar.

USD EUR GBP JPY CAD AUD NZD CHF
USD -0.03% -0.01% -0.04% 0.09% 0.08% 0.17% 0.03%
EUR 0.03% 0.05% 0.05% 0.17% 0.17% 0.27% 0.08%
GBP 0.01% -0.05% 0.08% 0.13% 0.21% 0.21% 0.00%
JPY 0.04% -0.05% -0.08% 0.10% 0.09% 0.18% -0.08%
CAD -0.09% -0.17% -0.13% -0.10% -0.01% 0.11% -0.13%
AUD -0.08% -0.17% -0.21% -0.09% 0.01% 0.09% -0.13%
NZD -0.17% -0.27% -0.21% -0.18% -0.11% -0.09% -0.10%
CHF -0.03% -0.08% 0.00% 0.08% 0.13% 0.13% 0.10%

The heat map shows percentage changes of major currencies against each other. The base currency is picked from the left column, while the quote currency is picked from the top row. For example, if you pick the Euro from the left column and move along the horizontal line to the US Dollar, the percentage change displayed in the box will represent EUR (base)/USD (quote).

The US Dollar (USD) gathered strength against its rivals on Thursday as upbeat macroeconomic data releases eased concerns over an economic downturn.

The US Bureau of Economic Analysis (BEA) announced that it revised the annualized Gross Domestic (GDP) growth for the second quarter to 3.8% from 3.3% in the previous estimate. Other data from the US showed that Durable Goods Orders increased by 2.9% in August, surpassing the market expectation for a decrease of 0.5% by a wide margin, and the weekly Initial Jobless Claims declined to 218,000 from 232,000 in the previous week.

Later in the day, the BEA will publish the Personal Consumption Expenditures (PCE) Price Index data, the Federal Reserve’s (Fed) preferred gauge of inflation, for August. Fed Chairman Jerome Powell said in his last public appearance that they were projecting the PCE Price Index and the core PCE Price Index to rise 2.7% and 2.9% on a yearly basis, respectively.

Unless there is a significant surprise in the monthly core PCE Price Index print, which is expected to rise 0.2%, the market reaction is likely to remain muted.

In the meantime, US stock index futures rise about 0.2% in the European morning on Friday. A bullish action in Wall Street could help EUR/USD hold its ground heading into the weekend.

EUR/USD Technical Analysis

EUR/USD broke below the lower limit of the ascending regression channel and the Relative Strength Index (RSI) indicator on the 4-hour chart dropped toward 30, reflecting a buildup of bearish momentum. Additionally, EUR/USD closed the last four 4-hour candles below the 200-period Simple Moving Average (SMA).

On the downside, 1.1640 (Fibonacci 50% retracement of the latest uptrend) aligns as the first support level before 1.1580 (Fibonacci 61.8% retracement) and 1.1500 (static level, round level). Looking north, resistance levels could be spotted at 1.1690-1.1700 (200-period SMA, Fibonacci 38.2% retracement), 1.1750 (100-period SMA) and 1.1770 (Fibonacci 23.6% retracement).

(This story was corrected on September 26 at 08:38 GMT to say in the first paragraph that the EUR/USD closed deep in negative territory on Thursday, not positive.)

Euro FAQs

The Euro is the currency for the 19 European Union countries that belong to the Eurozone. It is the second most heavily traded currency in the world behind the US Dollar. In 2022, it accounted for 31% of all foreign exchange transactions, with an average daily turnover of over $2.2 trillion a day.
EUR/USD is the most heavily traded currency pair in the world, accounting for an estimated 30% off all transactions, followed by EUR/JPY (4%), EUR/GBP (3%) and EUR/AUD (2%).

The European Central Bank (ECB) in Frankfurt, Germany, is the reserve bank for the Eurozone. The ECB sets interest rates and manages monetary policy.
The ECB’s primary mandate is to maintain price stability, which means either controlling inflation or stimulating growth. Its primary tool is the raising or lowering of interest rates. Relatively high interest rates – or the expectation of higher rates – will usually benefit the Euro and vice versa.
The ECB Governing Council makes monetary policy decisions at meetings held eight times a year. Decisions are made by heads of the Eurozone national banks and six permanent members, including the President of the ECB, Christine Lagarde.

Eurozone inflation data, measured by the Harmonized Index of Consumer Prices (HICP), is an important econometric for the Euro. If inflation rises more than expected, especially if above the ECB’s 2% target, it obliges the ECB to raise interest rates to bring it back under control.
Relatively high interest rates compared to its counterparts will usually benefit the Euro, as it makes the region more attractive as a place for global investors to park their money.

Data releases gauge the health of the economy and can impact on the Euro. Indicators such as GDP, Manufacturing and Services PMIs, employment, and consumer sentiment surveys can all influence the direction of the single currency.
A strong economy is good for the Euro. Not only does it attract more foreign investment but it may encourage the ECB to put up interest rates, which will directly strengthen the Euro. Otherwise, if economic data is weak, the Euro is likely to fall.
Economic data for the four largest economies in the euro area (Germany, France, Italy and Spain) are especially significant, as they account for 75% of the Eurozone’s economy.

Another significant data release for the Euro is the Trade Balance. This indicator measures the difference between what a country earns from its exports and what it spends on imports over a given period.
If a country produces highly sought after exports then its currency will gain in value purely from the extra demand created from foreign buyers seeking to purchase these goods. Therefore, a positive net Trade Balance strengthens a currency and vice versa for a negative balance.

Source link

26 09, 2025

Can ADA Deliver, Or Will A Presale Token Take The Crown?

By |2025-09-26T19:00:49+03:00September 26, 2025|Crypto News, News|0 Comments

How many times has the crypto market given people the chance to turn a small investment into massive returns? The stories of Bitcoin under $100 or Ethereum below $10 created crypto millionaire stories that fuel today’s hunt for the best crypto presale 2025. Now, in September 2025, the search for the next 100x crypto is back, and participants are deciding between safe altcoins under $1 like Cardano or explosive presale crypto projects such as BlockchainFX (BFX).

The urgency is real. While Cardano has built long-term stability, the best presale crypto to buy now is attracting global attention with daily USDT rewards, Visa card integration, and 90% APY passive income potential. For anyone asking which is the best crypto to buy now for 2025, this comparison highlights where stability ends and 1000x growth begins.

Cardano Price Prediction 2025: Is ADA Still the Best Crypto Under $1?

Cardano (ADA) remains one of the most recognized names in the market. At $0.7832 with a $28.04B market cap, it has a loyal base of community members. ADA has consistently ranked among the top crypto to invest in thanks to its scalability and ongoing ecosystem upgrades. For many, ADA represents the best crypto under $1 and a reliable long-term crypto investment.

Price forecasts for 2025 highlight three possible outcomes:

Scenario Cardano Price Prediction 2025 Key Drivers
Bearish $0.50 – $0.70 Market stagnation, weak liquidity
Average $1.20 – $1.50 Steady ecosystem growth
Bullish $2.00+ Strong inflows, viral adoption

For buyers focusing on altcoin undervalued 2025 or best crypto to buy now under $1, ADA still delivers low-entry exposure. However, its growth curve is moderate compared to top crypto presales to watch in 2025 for 100x returns. ADA may reclaim $2, but it lacks the urgency and scarcity that presales create.

Source: TradingView

BlockchainFX Presale: The Best Presale Crypto 2025 With 1000x Potential

If Cardano reflects patience, BlockchainFX (BFX) embodies urgency. BFX is more than a new crypto presale 2025 — it’s already live as a trading super app uniting crypto, stocks, forex, and commodities. With over 10,000 daily users, audits from CertiK, and millions in volume processed, BlockchainFX proves its utility before even listing.

Holders of the BFX token benefit from 70% of trading fees redistributed daily in USDT, creating reliable crypto passive income. Early adopters are earning 4–7% daily returns, with APYs reaching 90%. Add worldwide Visa card access (Gold, Green, Metal), and BFX offers real-world use cases that go beyond speculation.

Can ADA Deliver, Or Will A Presale Token Take The Crown?

ROI Example That Triggers Urgency

At the current presale price of $0.025, a $50,000 entry buys 2 million BFX tokens. By launch at $0.05, that doubles to $100,000. If the token hits $1 as analysts predict, the same entry grows to $2 million. That is the kind of crypto millionaire outcome presale buyers dream of.

This window is closing fast. The early $0.01 stage is gone, and weekly price increases make every delay costly. Using the OCT35code secures an additional 35% more tokens, offering one last way to maximize entries.

Long-Term Growth and Viral Potential

  • Revenue projections: $30M in 2025 → $1.8B by 2030
  • Users: 220K today → 25M by 2030
  • Rewards: $630M in USDT expected for holders
  • Listings: 5 CEX confirmed for launch

Add to this a $500,000 giveaway where winners can share BFX tokens (with first place taking $250,000), and the scarcity-driven narrative becomes stronger. BlockchainFX isn’t just another presale—it’s one of the best crypto presale projects 2025 backed by real usage and tangible rewards.

👉 Secure your entry in the top presale crypto for huge ROI in 2025 before the next Monday price hike.

BFX7357537

Why BlockchainFX Is the Best Crypto to Buy Now for 2025

Cardano provides safe, steady growth under $1. It is ideal for those prioritizing long-term consistency. But for buyers seeking the best crypto presales to invest in September 2025, BlockchainFX offers the unique mix of scarcity, urgency, and explosive ROI potential. With daily USDT payouts, Visa card spending power, and exchange listings ahead, BFX is already outperforming most presale crypto 2025 projects before launch.

Choosing between ADA and BFX boils down to strategy: ADA for gradual gains, BFX for exponential opportunity. With BLOCK30, buyers not only lock in today’s price but also secure 35% extra tokens, making it the best presale crypto to buy now for both short-term flips and long-term staking rewards.

Final Thoughts: Will You Miss the Next 1000x Crypto?

History shows that the biggest fortunes come from timing—getting into the right project before the crowd. ADA will likely climb again, but BFX is offering urgency, scarcity, and next 100x crypto potential all at once. This is not just another presale, but the best crypto under $1 delivering daily USDT rewards, Visa card spending, and exponential growth forecasts.

The regret of missing early Bitcoin or Ethereum is permanent. In 2025, ignoring BlockchainFX could become the same kind of missed chance. With OCT35 adding 35% more tokens and prices set to rise again soon, buyers have a narrow window left.

👉 Don’t wait—claim your spot in the best crypto presale 2025 today and turn this second chance into your crypto millionaire story.

Find Out More Information Here

Website: https://blockchainfx.com/ 

X: https://x.com/BlockchainFXcom

Telegram Chat:https://t.me/blockchainfx_chat

This article is not intended as financial advice. Educational purposes only.

Source link

26 09, 2025

Vitalik Buterin Just Spotlighted This NFT Utility to Watch

By |2025-09-26T17:28:52+03:00September 26, 2025|News, NFT News|0 Comments


Ethereum founder Vitalik Buterin has waded into the debate about the pricing of tickets and how non-fungible tokens (NFTs) can bridge the gap. Buterin’s statement comes as a reaction to comments made by the CEO of Live Nation-Ticketmaster that concert tickets are “underpriced.”

Vitalik Buterin suggests NFTs can replace ticketing

According to Buterin, tickets for these concerts or any event are usually stressful to obtain, as people stay up until 3:00 a.m. just waiting to snap up a slot. He noted that this happens as a result of the gap between demand and supply.

To address this, the Ethereum founder suggests restoration of the demand and supply gap so there can be equilibrium somehow. He stressed that if there are more buyers than available tickets, there needs to be a system to decide who gets them.

Buterin pointed out two possible avenues, which involve selling to those willing to pay the highest price or those ready to spend a long time in queues. According to him, “paying with time is less honest and more destructive.”
 

He believes that the man-hours spent in line produce no value. On the contrary, with higher prices, the money made from transfers can fund more production or any other worthy initiatives. So, if NFTs are used for the sales of these concert tickets, the system could easily extract this transferred money and channel it appropriately.

Buterin also considered people who are not financially buoyant. He suggests allocating tickets to these groups and tying them to a goal. This could be providing proof of volunteering, good grades or any other worthy cause.

“Basically, acknowledge that an auction will exist, but create more ways for people to bid that target diverse constituencies,” Buterin stated.

NFT back in spotlight?

Non-fungible tokens are the first innovations that Ethereum used to showcase its smart contract abilities. However, the emergence of meme coins like Shiba Inu ultimately helped this spotlight to fade.

With Vitalik Buterin always sharing his visions for the Ethereum blockchain, his latest commentary on NFTs might imply there is a grand plan to revive these tokens. 

The dominance war among blockchain protocols is growing, and Ethereum may just be reverting to its core strengths with NFTs.


Source link

26 09, 2025

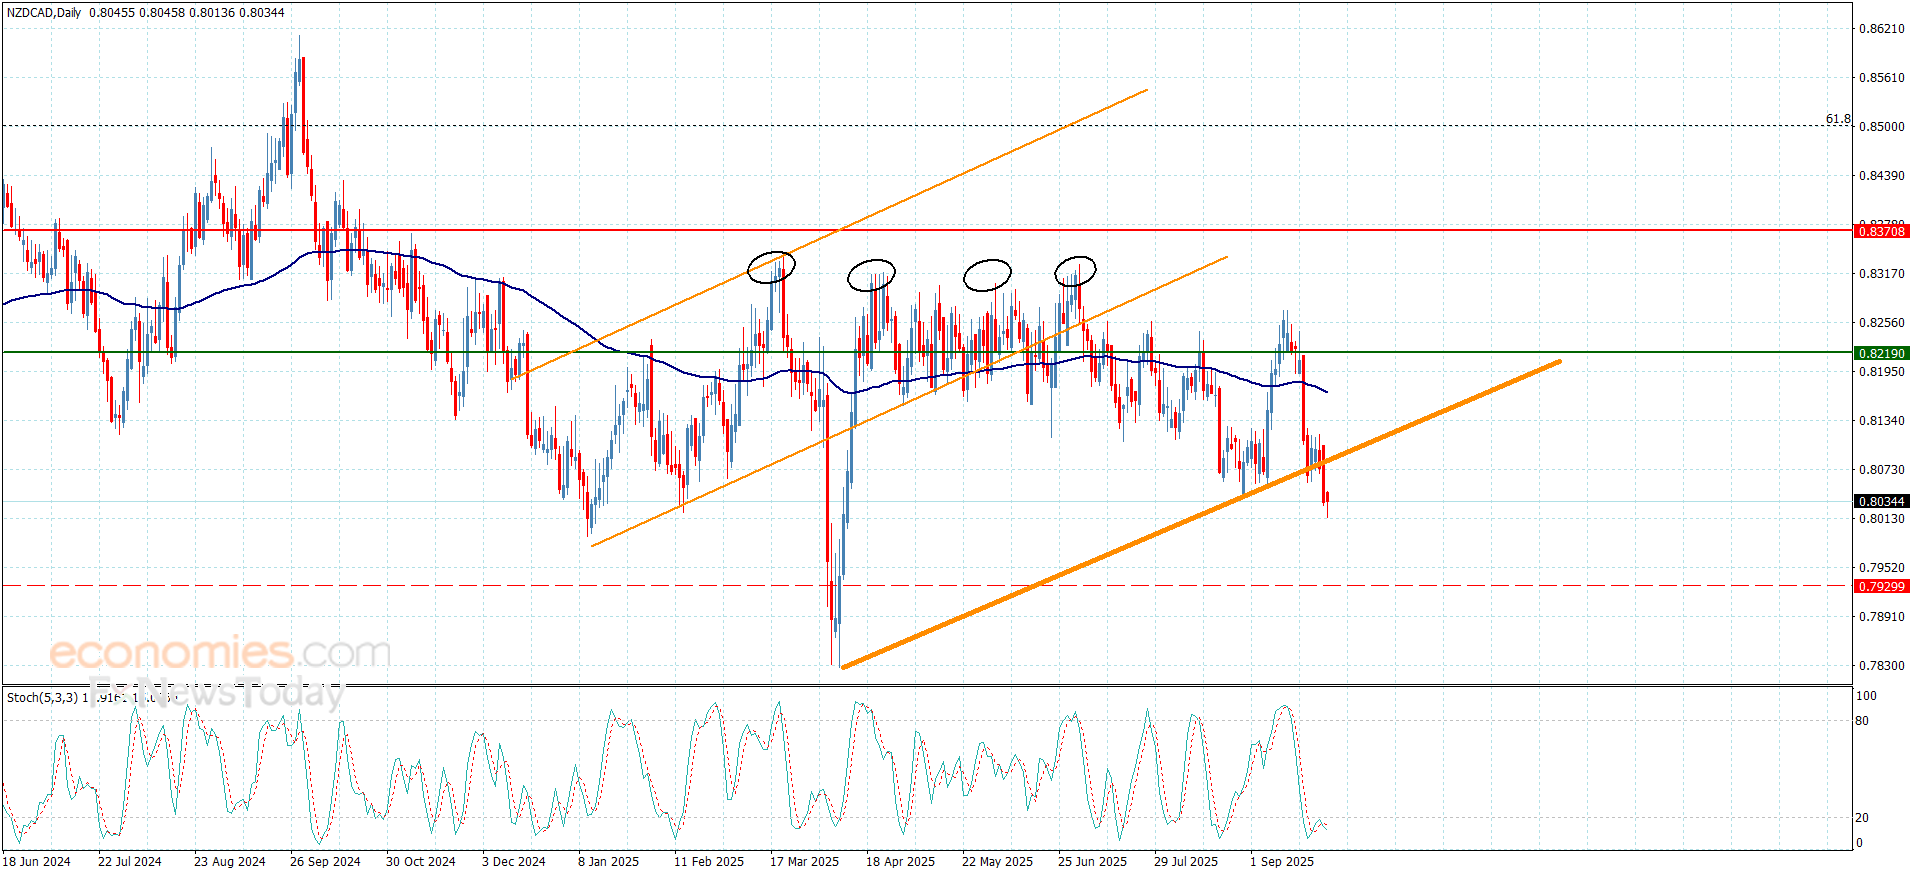
The NZDCAD moves to a new negative track– Forecast today – 26-9-2025

By |2025-09-26T17:18:44+03:00September 26, 2025|Forex News, News|0 Comments


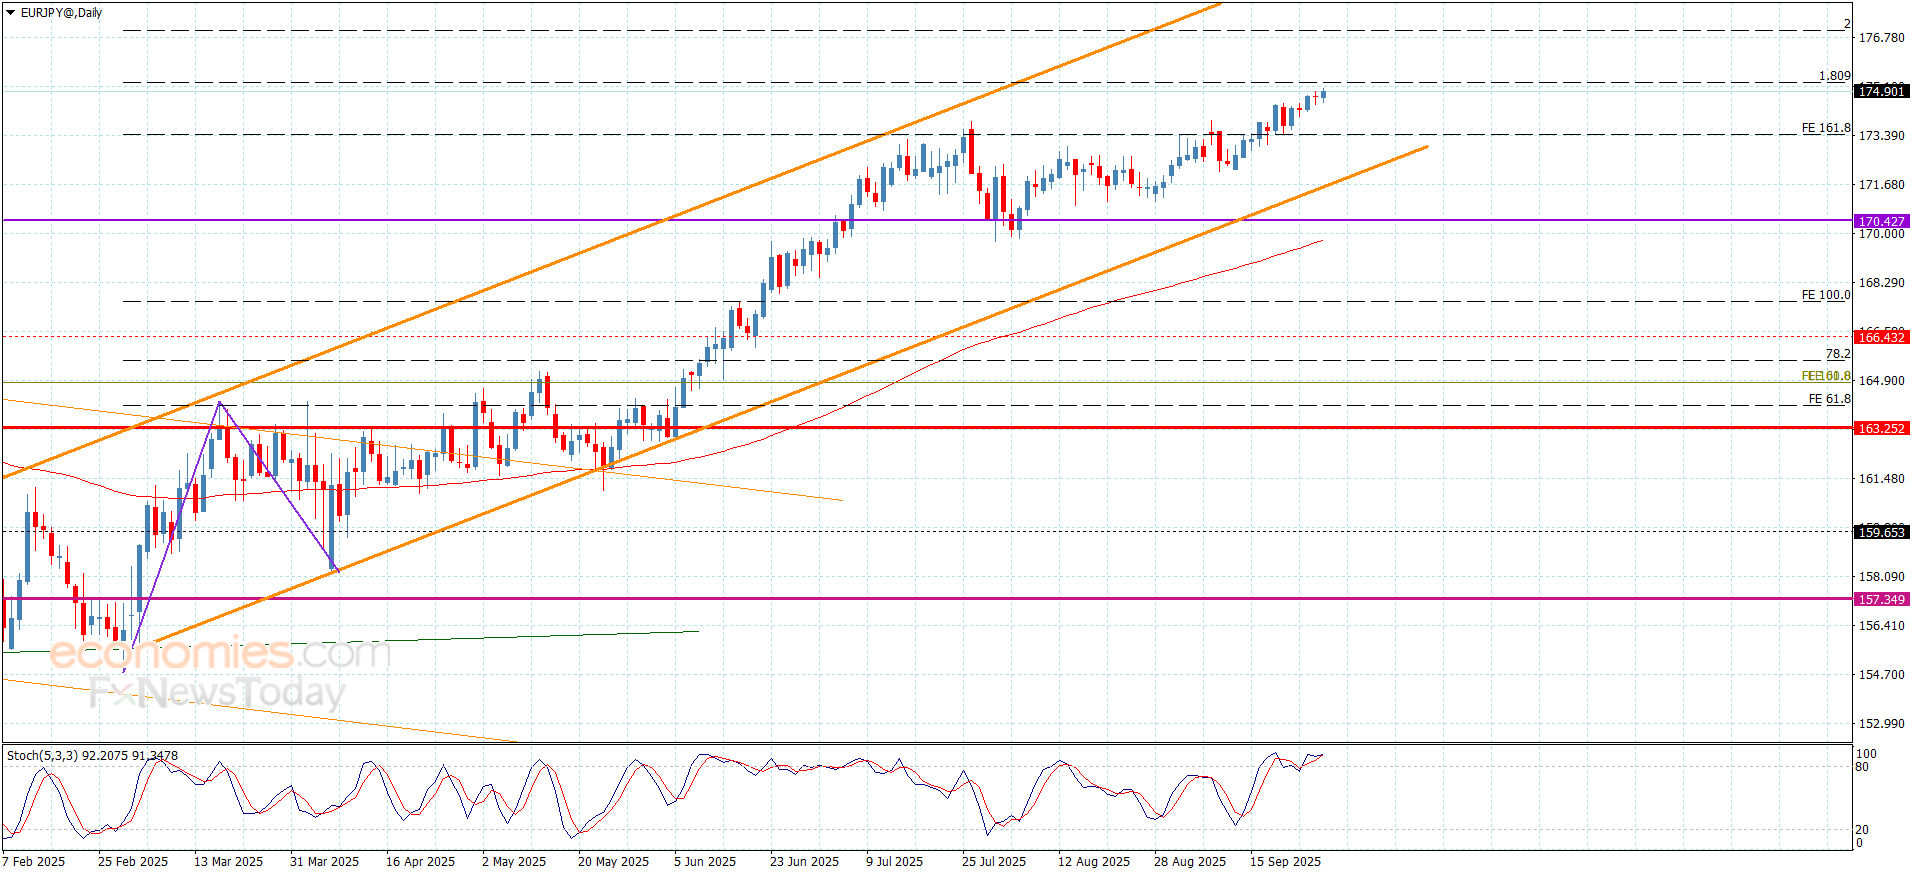
The EURJPY pair failed to resume the bullish attack, due to its stability below %1.809 Fibonacci extension level, forming an extra barrier at 175.20, providing sideways trading since yesterday by its stability near 174.85.


Reminding you that the bullish scenario will remain valid, due to the stability within the bullish channel’s levels besides the continuation of forming an initial support at 173.40 level, which makes us wait for breaching the current barrier to ease the mission of recording extra gains that might begin at 176.00 and 176.95.


The expected trading range for today is between 174.20 and 175.20


Trend forecast: Sideways until achieving the breach


Source link

26 09, 2025

Key resistance remains at the 200.35-200.50 area

By |2025-09-26T17:17:42+03:00September 26, 2025|Forex News, News|0 Comments

  • The Pound bounced up on Yen weakness, but is struggling to find acceptance above 200.00.
  • Moderate Tokyo inflation levels have dampened hopes of BoJ tightening in October.
  • GBP/JPY: key resistance lies ahead of 200.50, support is at the 199.20 area.

The British Pound is trimming Thursday’s losses on Friday, favoured by generalised Japanese Yen weakness, following relatively soft inflation figures in the Tokyo area. The pair has reached prices above the 200.00 level after bouncing at 199.55, but remains below a key resistance area ahead of 200.50

Data released on Thursday revealed that the advanced Tokyo CPI grew at a 2.5% yearly rate in September, down from 2.6% in August. The Core CPI remained steady at 2.5% against market expectations of an uptick to 2.6%. These figures give some more leeway to the BoJ to maintain its “wait-and-see” stance at its next monetary policy meeting, and have increased bearish pressure on the Yen.

Technical analysis: Looking for direction around 200.00

The technical picture is mixed. The pair broke below an ascending trendline support, yet bears have been unable to pull the pair below 199.20. The 4-hour Relative Strength Index is wavering around the 50 level, indicating a lack of a clear bias.

Bulls will find significant resistance in the area between Thursday’s high, at 200.35, and the reverse trendline, now around 200.50. A confirmation above here would open the way towards the year-to-date high, at 201.27.

A reversal from current levels, on the contrary, would face support at the mentioned 199.20 (September 19 and 23 lows). Further down, the 78.6% retracement of the September rally, which meets the September 5 low at 198.65, and the September 2 low at 198.35, would be the next bearish targets.

(This story was corrected on September 26 at 10:10 GMT to say that the September 5 low is at 198.65 and the September 2 at 198.35, not at 168.65 and 1.1830 as previously reported.)

Japanese Yen Price Today

The table below shows the percentage change of Japanese Yen (JPY) against listed major currencies today. Japanese Yen was the strongest against the New Zealand Dollar.

USD EUR GBP JPY CAD AUD NZD CHF
USD -0.12% -0.11% -0.12% 0.07% 0.00% 0.07% -0.06%
EUR 0.12% 0.05% 0.07% 0.24% 0.20% 0.25% 0.08%
GBP 0.11% -0.05% 0.08% 0.19% 0.23% 0.20% -0.00%
JPY 0.12% -0.07% -0.08% 0.15% 0.09% 0.16% -0.09%
CAD -0.07% -0.24% -0.19% -0.15% -0.06% 0.03% -0.19%
AUD -0.01% -0.20% -0.23% -0.09% 0.06% 0.05% -0.15%
NZD -0.07% -0.25% -0.20% -0.16% -0.03% -0.05% -0.09%
CHF 0.06% -0.08% 0.00% 0.09% 0.19% 0.15% 0.09%

The heat map shows percentage changes of major currencies against each other. The base currency is picked from the left column, while the quote currency is picked from the top row. For example, if you pick the Japanese Yen from the left column and move along the horizontal line to the US Dollar, the percentage change displayed in the box will represent JPY (base)/USD (quote).

Source link

26 09, 2025

Can Ripple Reach $5 as Altcoin Flows Rise

By |2025-09-26T17:00:20+03:00September 26, 2025|Crypto News, News|0 Comments

As Bitcoin keeps setting the tone for risk assets, traders are rotating into altcoins that can ride the next leg higher.

Ripple’s XRP is one of the names back in focus thanks to growing liquidity and renewed interest in payment-use crypto.

Avalanche is also drawing steady inflows on the back of its scaling story and developer activity.

Can Ripple Reach  as Altcoin Flows RiseTucked into these conversations is MAGACOIN FINANCE, which many retail traders now include on shortlists of higher-upside opportunities as they prepare for Q4.

The project’s early-stage position has created a pocket of interest that sits right alongside XRP and AVAX in watchlists.

XRP’s setup as the market warms

XRP trades at $2.81 today after a choppy but constructive week. The tape shows heavy interest above the mid 2s, with intraday swings between $2.77 and $3.01 as liquidity rebuilds. That range matters because a clean push through the low 3s often unlocks trend-following flows in this market, especially when Bitcoin volatility cools. If momentum holds, the bullish base case from several desks remains simple: a grind toward $3.50 first, then an attempt at $5 if post-halving risk appetite expands across payment-themed tokens.

Under the surface, the XRP story still rests on the same pillars that carried it through past cycles. Traders like its role as a bridge asset for fast settlement, and they like that it behaves differently from meme-led names when the market turns serious about utility. The coin’s large float and deep order books can mute the size of single-day spikes, but that same depth makes it easier for larger accounts to build positions without moving the market too much. In short, XRP is behaving like a veteran large cap again: steady, liquid, and well positioned to participate if Bitcoin sets a higher range. With BTC hovering near $112,744 today, that macro tailwind is still intact.

MAGACOIN FINANCE: scarcity mechanics that pull in retail flows

Where MAGACOIN FINANCE differs from established large caps is the way its presale structure funnels demand. The project uses staged pricing and capped allocations, so each round tightens available supply while nudging the entry price higher. That simple design creates two forces at once: time pressure and scarcity. When this combination hits a project that’s already gathering attention, retail flows tend to accelerate near round closures as would-be buyers rush to avoid the next step up in price. For early participants, this can set the stage for a cleaner launch because tokens are dispersed across many wallets rather than concentrated in a few hands.

This scarcity angle is also why some analysts put MAGACOIN FINANCE in a different bucket from XRP and AVAX. XRP offers scale and liquidity, AVAX offers a maturing ecosystem, but neither can replicate the percentage moves that a tightly run presale can generate if execution is solid. That does not erase risk. What gives MAGACOIN FINANCE a look, however, is that its mechanics are transparent enough for retail to model scenarios, and its growing community means demand is not being forced. In a market that often chases supply squeezes, that is exactly the kind of profile that can dominate retail flows at the right moment.

AVAX’s Role Next to XRP and a rising presale

Avalanche trades near $30.81 and continues to function as a high-speed, developer-friendly environment. That price sits well below last cycle’s peaks, which is why some traders frame AVAX as a “middle-risk” option: more upside potential than mega-caps, more battle-tested than brand-new tokens. If activity on subnets and real-world asset pilots expands, AVAX can stair-step higher alongside the majors as money filters down the market cap curve. Near term, desks are watching the low 30s as a pivot zone. Holding that area keeps the door open for pushes back into the mid 30s and beyond as Q4 liquidity thickens.

Measured against MAGACOIN FINANCE, AVAX’s attraction is different. AVAX gives you network effects you can see: code shipping, apps launching, partnerships forming. MAGACOIN FINANCE plays the other side of the barbell: it is early, it is smaller, and it can move in multiples if it sticks the landing. That asymmetry is exactly why some retail portfolios are pairing them. AVAX can compound if adoption grows. MAGACOIN FINANCE can sprint if scarcity meets demand. And XRP sits between them, where liquidity and utility live, giving portfolios an anchor that can still stretch toward $5 if conditions align.

Back on XRP, the path to higher levels remains straightforward but conditional. XRP tends to benefit when Bitcoin sets a stable floor and when the market is hunting for utility-led names rather than pure memes. A sustained hold above the high $2s would help confirm that the base is firm. Clear breaks above $3 and then $3.50 would tilt probability toward a run at $5 during the next broad risk-on wave. It is not an overnight move, but with Bitcoin still elevated and altcoin breadth slowly improving, the ingredients exist to keep XRP in the conversation as one of the cycle’s steadier performers. Prices today back that view: XRP $2.81, AVAX $30.81, BTC $112,744.

Conclusion

XRP’s case into year-end is simple: deep liquidity, a clear use narrative, and a reasonable technical path toward the $5 target if the market’s risk window stays open. Avalanche remains a core option for builders and for investors who want a scalable platform with room to re-rate as activity grows. The surprise entry on many retail shortlists is MAGACOIN FINANCE, where scarcity-driven presale mechanics can pull in flows and potentially compress supply at launch. That is the edge it brings compared with large caps like XRP and AVAX. For portfolios that mix stability, platform growth, and calculated speculation, these three names cover the spectrum as Q4 approaches.

To learn more about MAGACOIN FINANCE, visit:
Website: https://magacoinfinance.com
Access: https://magacoinfinance.com/access
Twitter/X: https://x.com/magacoinfinance
Telegram: https://t.me/magacoinfinance


Source link

26 09, 2025

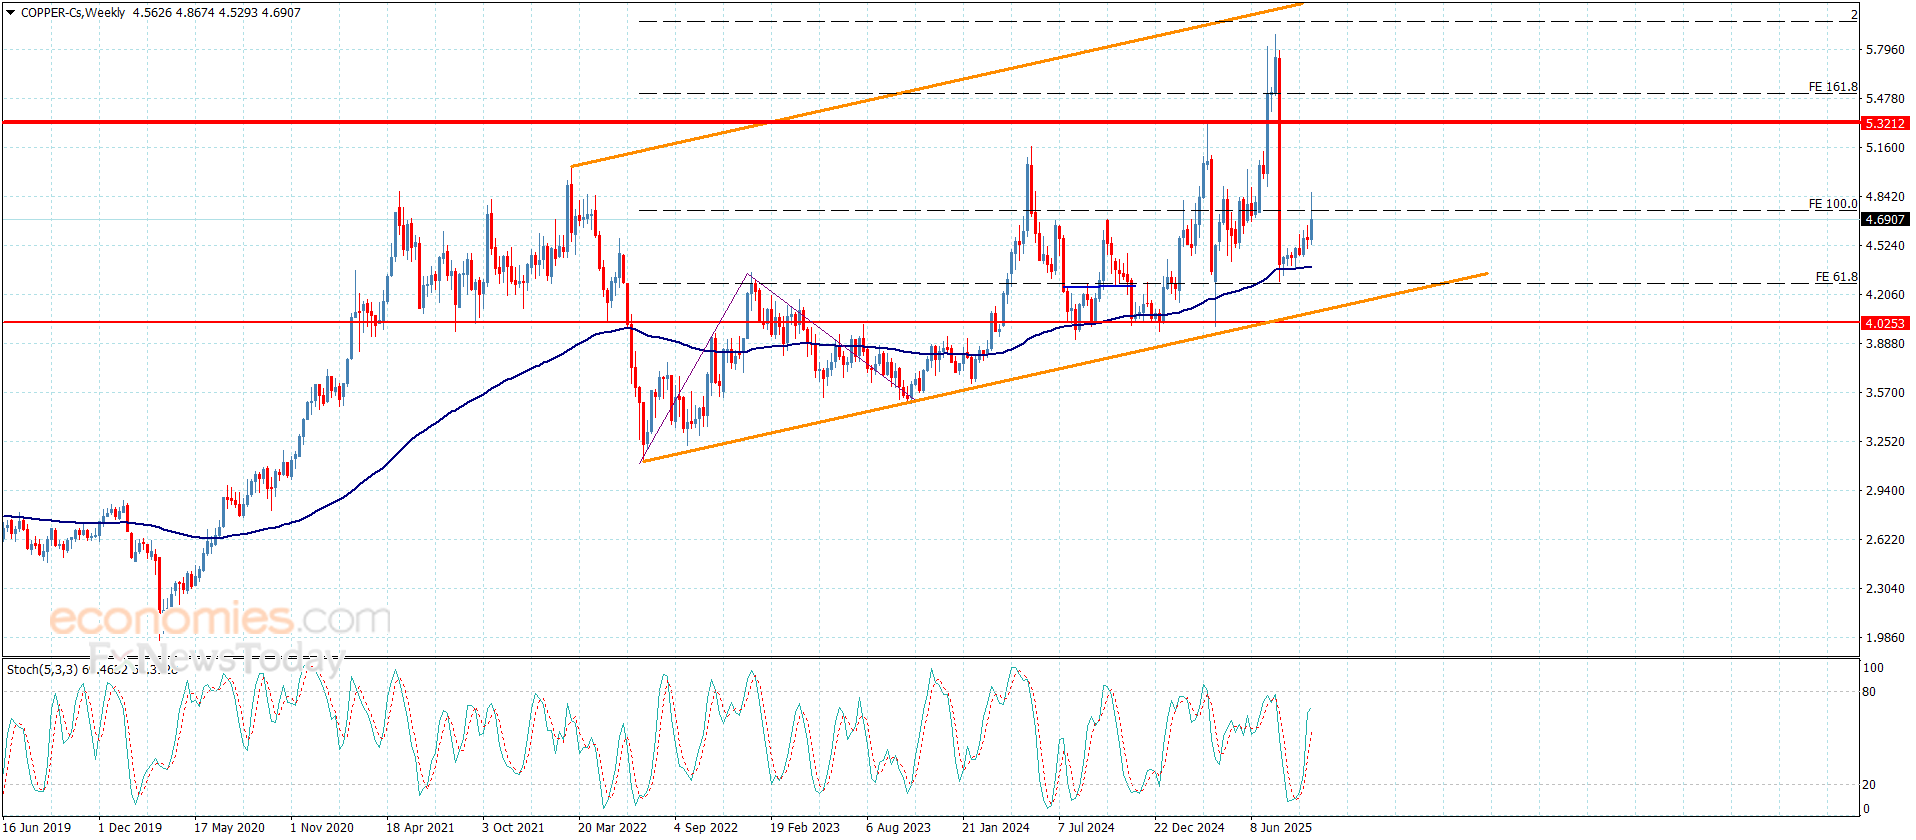
Copper price is waiting to confirm the breach– Forecast today – 26-9-2025

By |2025-09-26T15:17:43+03:00September 26, 2025|Forex News, News|0 Comments


The (silver) price declined in its last intraday trading, after reaching $44.80 resistance, which represents our expected target in our last forecast, due to the stability of this resistance the price declined to gather the gains of its previous rises, to attempt to gain bullish momentum that might help to breach it and resuming the rise, amid the continuation of the positive pressure that comes from its trading above EMA50, and under the dominance of the main bullish trend on the short-term basis and its trading alongside trendline, besides the emergence of the positive signals on the relative strength indicators, despite reaching overbought levels.


VIP Trading Signals Performance by BestTradingSignal.com (September 15–19, 2025)


Get high-accuracy trading signals delivered directly to your Telegram. Subscribe to specialized packages tailored for the world’s top markets:


Full VIP signals performance report for September 15–19, 2025:

  View Full Performance Report


Source link

26 09, 2025

The EURJPY is waiting for breaching the barrier– Forecast today – 26-9-2025

By |2025-09-26T15:15:45+03:00September 26, 2025|Forex News, News|0 Comments

The EURJPY pair failed to resume the bullish attack, due to its stability below %1.809 Fibonacci extension level, forming an extra barrier at 175.20, providing sideways trading since yesterday by its stability near 174.85.


Reminding you that the bullish scenario will remain valid, due to the stability within the bullish channel’s levels besides the continuation of forming an initial support at 173.40 level, which makes us wait for breaching the current barrier to ease the mission of recording extra gains that might begin at 176.00 and 176.95.


The expected trading range for today is between 174.20 and 175.20


Trend forecast: Sideways until achieving the breach


Source link

26 09, 2025

How much for matcha? Prices for the popular powdered tea soar due to global demand

By |2025-09-26T15:10:46+03:00September 26, 2025|Dietary Supplements News, News|0 Comments


How much for matcha? Prices for the popular powdered tea soar due to global demand | DRGNews


google-site-verification: google9919194f75dd62c5.html


Source link

Go to Top