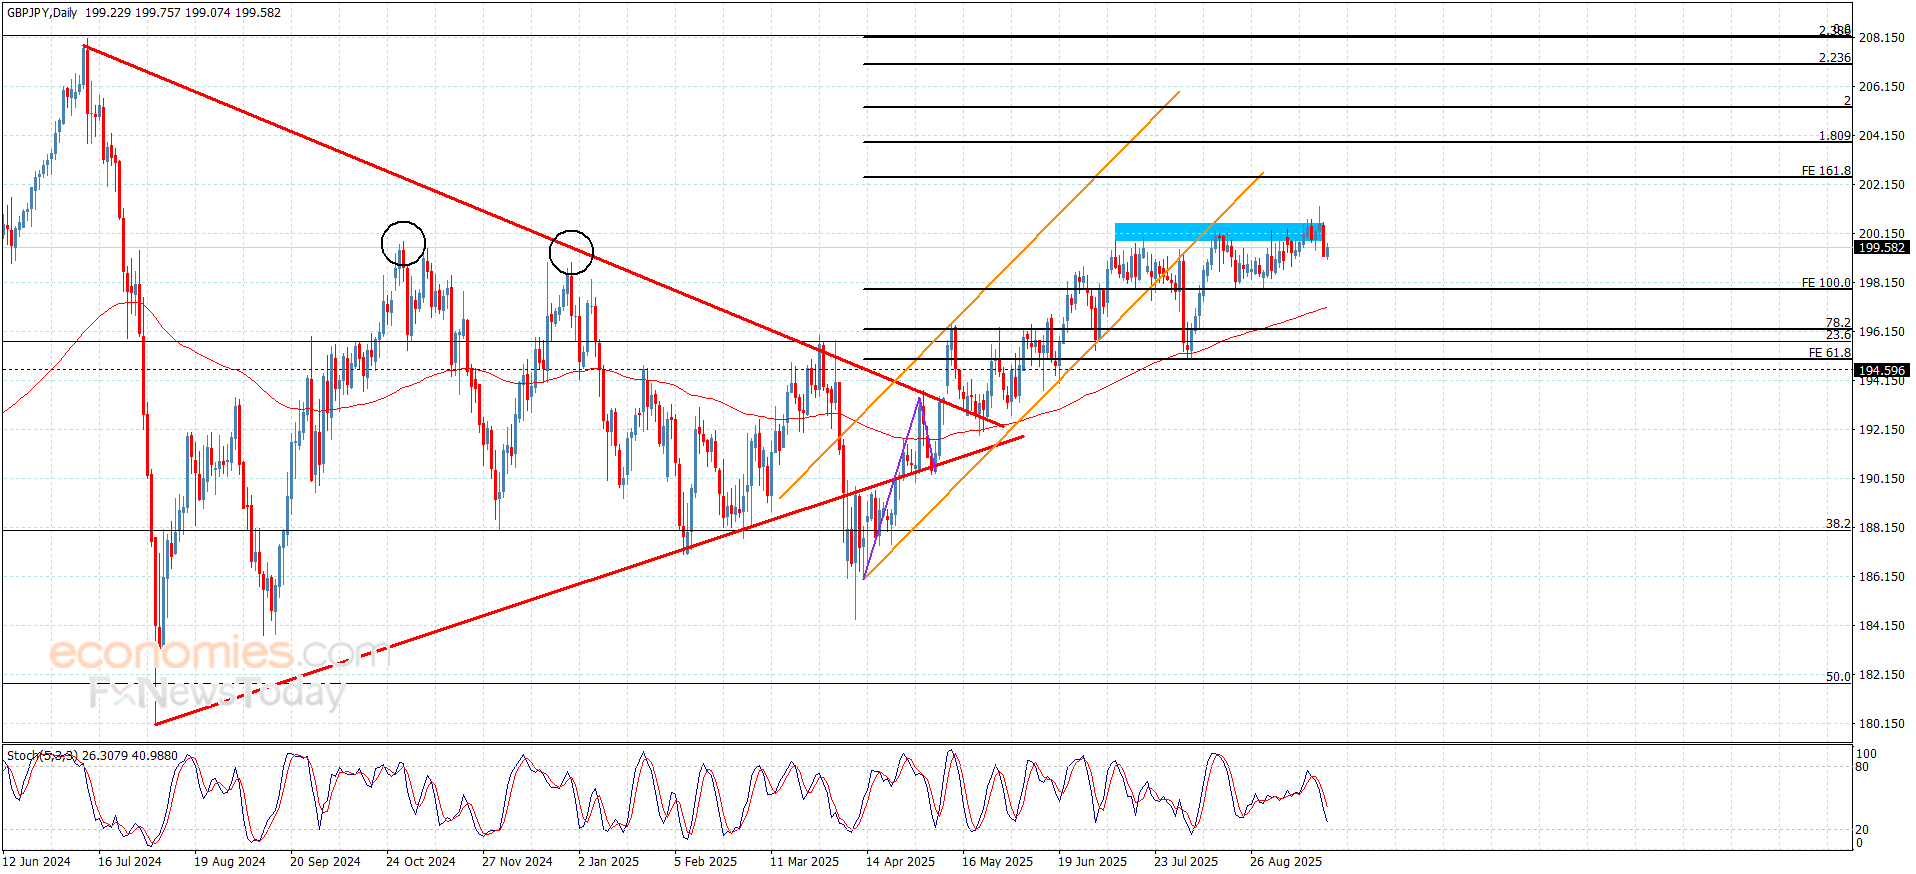
The GBPJPY pair provided new negative close in Friday’s trading below 200.45 level barrier, which forces it to form some bearish correctional trading, to settle near 199.55.
By the above image, we notice stochastic reach below 50 level, to provide the extra negative momentum, to confirm the dominance of the bearish correctional bias, which makes us keep the bearish suggestion until reaching the negative station near 198.60 and 197.80.
The expected trading range for today is between 198.60 and 200.40
A German cafe went viral after putting up a cheeky notice banning matcha drinkers. While some applauded the move, others defended their love for matcha.
Matcha is a powder made from processed green tea leaves. (Photo Credits: Instagram)
Matcha, the vibrant green tea powder from Japan, has taken the Internet by storm. From lattes and desserts to smoothies and even skincare, it has become a full-blown lifestyle trend, especially among Gen Z. Cafes and influencers alike have jumped on the bandwagon, making this bright green drink a must-have.
But not everyone is buying into the craze. A cafe in Germany has humorously drawn the line, posting a short yet firm notice defending traditional coffee culture.
What Does The Notice Say?
The message was shared on Instagram by Dritan Alsela, a well-known German barista and coffee expert. It read, “Matcha drinkers not permitted. This is a complete coffee establishment. Respect the beans.”
The post was captioned, “Coffee only. Keep the green powder outside.”
How Did The Internet React?
The post quickly went viral, sparking reactions from both matcha fans and die-hard coffee lovers.
On Instagram, people flooded the comments, some applauding the cafe’s bold, playful stance, others defending their love for matcha.
“As I am Japanese, and we love matcha. I totally agree with this. The matcha trend is overrated in Westerners,” a user commented.
Another wrote, “I will use this strategy for my coffee shop.”
“Literally stop the matcha madness,” said a user.
An individual stated, “Matcha is just tea. Stoppppp trying to turn it into a personality.”
“The Beans are much better!” posted an Instagram user.
An account said, “This sign made my day, excellent.”
“If owners of a coffee shop don’t want to serve tea, it is fine. Just don’t make fun of people who prefer tea,” wrote another.
The mix of amusement, support, and friendly debate made the post impossible to scroll past without a smile.
Origin Of Matcha
It is a finely ground powder made from specially grown and processed green tea leaves. Known for its vibrant colour, earthy taste, and slight undertones of bitterness, the history of matcha dates back to the 9th century in China, where Zen Buddhist monks first used powdered tea for meditation. But it was during the 12th century in Japan that matcha truly found its identity.
Packed with antioxidants, especially catechins like EGCG, matcha is said to help fight inflammation and oxidative stress. Unlike regular green tea, matcha delivers a concentrated dose of nutrients since you consume the whole leaf. Additionally, it may also aid metabolism, support heart health, and promote a sense of calm alertness.
A team of writers at News18.com bring you stories on what’s creating the buzz on the Internet while exploring science, cricket, tech, gender, Bollywood, and culture.
A team of writers at News18.com bring you stories on what’s creating the buzz on the Internet while exploring science, cricket, tech, gender, Bollywood, and culture.
Click here to add News18 as your preferred news source on Google, News18’s viral page features trending stories, videos, and memes, covering quirky incidents, social media buzz from india and around the world, Also Download the News18 App to stay updated!
Location :
Delhi, India, India
First Published:
September 22, 2025, 13:12 IST
Newsviral This German Cafe Bans Matcha Drinkers, And Internet Can’t Stop Laughing: ‘Respect The Beans’
Disclaimer: Comments reflect users’ views, not News18’s. Please keep discussions respectful and constructive. Abusive, defamatory, or illegal comments will be removed. News18 may disable any comment at its discretion. By posting, you agree to our Terms of Use and Privacy Policy.
Digital
asset prices tumbled across the board today (Monday), with Bitcoin (BTC) and
Ethereum (ETH) leading a broad-based selloff that sent major cryptocurrencies
toward multi-week lows as technical levels crumbled and profit-taking
accelerated.
The
cryptocurrency market’s total capitalization fell by $77 billion during
Monday’s session, with more than 400,000 traders facing liquidations worth $1.7
billion combined. Market sentiment has turned decidedly cautious as traders
reassess positioning ahead of month-end.
Why are
cryptocurrencies falling? In this article, I address that question by analyzing
technical charts for XRP/USDT, BTC/USDT, DOGE/USDT, and ETH/USDT.
Several
macro factors have contributed to the selloff. While last week’s Federal
Reserve rate cut to 4.00-4.25% initially supported risk assets, Chair Powell’s
cautious stance on inflation has tempered expectations for rapid easing.
“As a result, traders have been reluctant to extend crypto’s recent rally
without fresh macro catalysts,” explained Joel Kruger, FX and crypto
strategist at LMAX Group.
“The
market tone has turned cautious, perhaps on the back of renewed outperformance
in the price of Bitcoin relative to ETH, signaling a flight to quality,” he
added. “Some profit taking is also likely at play after an impressive
September rally, unusual for a month that has historically been one of
bitcoin’s weakest.”
As a
result, cryptocurrency prices have fallen to their lowest levels in more than a
month, extending declines for four and in some cases five consecutive sessions.
Red dominates the market, as shown on the cryptocurrency heatmap from
CoinMarketCap:
Source: CoinMarketCap
Bitcoin slipped below the psychologically important $115,000 level, trading at $112,840
after touching session lows near $111,760. The world’s largest cryptocurrency
retreated from September highs above $117,000, testing the lower boundary of
its consolidation range that has defined trading since July.
From my
technical analysis, Bitcoin’s break below its 50-day moving average at $115,000
signals potential further declines toward the $105,000 support zone, which
coincides with a 38.2% Fibonacci retracement and the 200-day exponential moving
average. According to my technical view, even if Bitcoin exits its current
consolidation, this level represents very strong support.
Why Bitcoin price is going down today? Source: Tradingview.com
Ethereum faced more severe pressure, with the second-largest digital asset by market
capitalization dropping to around $4,100 during Monday’s session, its lowest
level in over a month. The sharp decline violated Ethereum’s 50-day exponential
moving average and September lows, though some of the selling was corrected as
ETH recovered to trade near $4,200, still down more than 5% on the day.
According
to my technical analysis, the cryptocurrency has pulled significantly away from
August highs tested on August 13 near $4,800. Despite Monday’s weakness, from
my technical view, Ethereum remains within the same consolidation channel
observed since early August, trading between support at $4,060 and resistance
at $4,800—a range representing approximately 17% volatility spread.
Why Ethereum price is going down today? Source: Tradingview.com
The current
price action suggests Ethereum is testing the lower boundary of this
established range, with the next critical support level sitting at the $4,060
zone that has been defended multiple times since August.
XRP Approaches Multi-Month
Support Zone
XRP price emerged
as one of Monday’s worst performers among major cryptocurrencies, sliding for
the fifth consecutive session to test levels below $2.70. The decline marked
XRP’s lowest point since early September and coincided with levels last seen in
early July, representing a two-month low.
Over less
than a week, XRP has declined from local resistance at $3.12 and September
highs to the lower boundary of its consolidation range that has been tested
three times since early August. From my technical analysis, this
support zone aligns with a 50% Fibonacci retracement and local highs from the
2024-2025 transition period, typically functioning as strong support.
According
to my technical view, just below this level lies the 200-day exponential moving
average combined with the $2.58 level and 61.8% Fibonacci retracement, creating
a broader support zone that should help defend XRP against stronger
depreciation. This confluence of technical indicators suggests a critical
juncture for the token.
Why XRP price is going down today? Source: Tradingview.com
Dogecoin Suffers Steepest
Decline Among Major Cryptos
Among the
four major cryptocurrencies analyzed, Dogecoin posted the largest losses. The
meme token fell more than 10% at one point during Monday’s session to just 23
cents, though it found support at the 50-day exponential moving average.
Currently trading down 8.6% near 24 cents, with an exact valuation of $0.2384.
Dogecoin
had surged strongly in September, briefly reaching 31 cents—the highest level
since the beginning of the year. However, it has sharply corrected and according
to my technical analysis, is now returning to the consolidation range
observed throughout most of August, which spans between 21 cents and a
resistance zone around 25 cents.
From my
technical view, the current price action suggests significant risk that
Dogecoin could approach the lower boundary of this consolidation range. The
50-day exponential moving average provided temporary support during Monday’s
decline, but sustained selling pressure could push the token toward the 21-cent
floor established in August.
Why Dogecoin price is going down today? Source: Tradingview.com
Seasonal Patterns Offer
Hope
Despite
near-term weakness, from my technical analysis, historical patterns
suggest potential for recovery. “While near-term weakness is possible
between now and month-end, the market is also entering what is historically the
strongest quarter of the year for crypto,” Kruger observed.
According
to market analysis, seasonally favorable flows and positioning have often set
the stage for powerful year-end rallies. “Fresh record highs in both Bitcoin and ether remain in view if the macro backdrop cooperates,” the
LMAX strategist added.
However,
Kruger cautioned that “sustained dollar strength or geopolitical
developments—ranging from U.S. regulatory moves to broader global political
tensions—could further test crypto’s resilience.”
From my
technical analysis, the key levels to watch include Bitcoin’s $105,000 support
zone, Ethereum’s $4,060 consolidation floor, XRP’s $2.58-$2.70 support band,
and Dogecoin’s 21-cent August low. These technical boundaries will likely
determine whether the current correction represents healthy consolidation or
the beginning of a deeper bear phase.
“For
now, however, the balance of risks leans toward consolidation or modest
downside unless Bitcoin can decisively clear overhead resistance,” Kruger
concluded.
Read my other posts and analysis related to the cryptocurrency market:
FAQ
Why does the crypto market
go down?
The crypto
market declines due to multiple interconnected factors. Macroeconomic
conditions play a crucial role: when central banks raise interest rates,
borrowing becomes more expensive and reduces liquidity in financial markets,
leading to lower investment in risky assets like crypto. Market sentiment and
speculation also drive volatility, as prices are often influenced more by
investor emotions than intrinsic value. Regulatory developments create
uncertainty, with crackdowns or proposed regulations often triggering panic
selling.
Will crypto rise again?
Historical
patterns suggest crypto markets tend to recover from downturns, particularly
during the fourth quarter which has traditionally been the strongest period for
digital assets. Seasonally favorable flows and institutional positioning often
set the stage for year-end rallies, with fresh record highs remaining possible
if macroeconomic conditions cooperate. However, recovery depends on factors
including Federal Reserve policy clarity, regulatory developments, and overall
market sentiment toward risk assets.
What is the 30 day rule in
crypto?
The 30-day
rule, also known as the wash sale rule, prevents investors from claiming tax
losses while immediately repurchasing the same asset. However, most
cryptocurrencies are currently exempt from this rule since they’re not legally
defined as securities by tax authorities. In traditional markets, investors
must wait 30 days after selling an asset at a loss before buying it back to
claim the tax deduction.
What does Warren Buffett
say about crypto?
Warren
Buffett has been consistently critical of cryptocurrency, famously calling
Bitcoin “rat poison squared” at Berkshire Hathaway’s 2018 annual
meeting. At the 2022 shareholder meeting, he stated: “If you told me you
owned all of the bitcoin in the world and you offered it to me for $25, I
wouldn’t take it because what would I do with it? I’d have to sell it back to
you one way or another. It isn’t going to do anything”. Buffett believes
cryptocurrencies lack intrinsic value and don’t produce concrete returns like
traditional investments.
Digital
asset prices tumbled across the board today (Monday), with Bitcoin (BTC) and
Ethereum (ETH) leading a broad-based selloff that sent major cryptocurrencies
toward multi-week lows as technical levels crumbled and profit-taking
accelerated.
The
cryptocurrency market’s total capitalization fell by $77 billion during
Monday’s session, with more than 400,000 traders facing liquidations worth $1.7
billion combined. Market sentiment has turned decidedly cautious as traders
reassess positioning ahead of month-end.
Why are
cryptocurrencies falling? In this article, I address that question by analyzing
technical charts for XRP/USDT, BTC/USDT, DOGE/USDT, and ETH/USDT.
Several
macro factors have contributed to the selloff. While last week’s Federal
Reserve rate cut to 4.00-4.25% initially supported risk assets, Chair Powell’s
cautious stance on inflation has tempered expectations for rapid easing.
“As a result, traders have been reluctant to extend crypto’s recent rally
without fresh macro catalysts,” explained Joel Kruger, FX and crypto
strategist at LMAX Group.
“The
market tone has turned cautious, perhaps on the back of renewed outperformance
in the price of Bitcoin relative to ETH, signaling a flight to quality,” he
added. “Some profit taking is also likely at play after an impressive
September rally, unusual for a month that has historically been one of
bitcoin’s weakest.”
As a
result, cryptocurrency prices have fallen to their lowest levels in more than a
month, extending declines for four and in some cases five consecutive sessions.
Red dominates the market, as shown on the cryptocurrency heatmap from
CoinMarketCap:
Source: CoinMarketCap
Bitcoin slipped below the psychologically important $115,000 level, trading at $112,840
after touching session lows near $111,760. The world’s largest cryptocurrency
retreated from September highs above $117,000, testing the lower boundary of
its consolidation range that has defined trading since July.
From my
technical analysis, Bitcoin’s break below its 50-day moving average at $115,000
signals potential further declines toward the $105,000 support zone, which
coincides with a 38.2% Fibonacci retracement and the 200-day exponential moving
average. According to my technical view, even if Bitcoin exits its current
consolidation, this level represents very strong support.
Why Bitcoin price is going down today? Source: Tradingview.com
Ethereum faced more severe pressure, with the second-largest digital asset by market
capitalization dropping to around $4,100 during Monday’s session, its lowest
level in over a month. The sharp decline violated Ethereum’s 50-day exponential
moving average and September lows, though some of the selling was corrected as
ETH recovered to trade near $4,200, still down more than 5% on the day.
According
to my technical analysis, the cryptocurrency has pulled significantly away from
August highs tested on August 13 near $4,800. Despite Monday’s weakness, from
my technical view, Ethereum remains within the same consolidation channel
observed since early August, trading between support at $4,060 and resistance
at $4,800—a range representing approximately 17% volatility spread.
Why Ethereum price is going down today? Source: Tradingview.com
The current
price action suggests Ethereum is testing the lower boundary of this
established range, with the next critical support level sitting at the $4,060
zone that has been defended multiple times since August.
XRP Approaches Multi-Month
Support Zone
XRP price emerged
as one of Monday’s worst performers among major cryptocurrencies, sliding for
the fifth consecutive session to test levels below $2.70. The decline marked
XRP’s lowest point since early September and coincided with levels last seen in
early July, representing a two-month low.
Over less
than a week, XRP has declined from local resistance at $3.12 and September
highs to the lower boundary of its consolidation range that has been tested
three times since early August. From my technical analysis, this
support zone aligns with a 50% Fibonacci retracement and local highs from the
2024-2025 transition period, typically functioning as strong support.
According
to my technical view, just below this level lies the 200-day exponential moving
average combined with the $2.58 level and 61.8% Fibonacci retracement, creating
a broader support zone that should help defend XRP against stronger
depreciation. This confluence of technical indicators suggests a critical
juncture for the token.
Why XRP price is going down today? Source: Tradingview.com
Dogecoin Suffers Steepest
Decline Among Major Cryptos
Among the
four major cryptocurrencies analyzed, Dogecoin posted the largest losses. The
meme token fell more than 10% at one point during Monday’s session to just 23
cents, though it found support at the 50-day exponential moving average.
Currently trading down 8.6% near 24 cents, with an exact valuation of $0.2384.
Dogecoin
had surged strongly in September, briefly reaching 31 cents—the highest level
since the beginning of the year. However, it has sharply corrected and according
to my technical analysis, is now returning to the consolidation range
observed throughout most of August, which spans between 21 cents and a
resistance zone around 25 cents.
From my
technical view, the current price action suggests significant risk that
Dogecoin could approach the lower boundary of this consolidation range. The
50-day exponential moving average provided temporary support during Monday’s
decline, but sustained selling pressure could push the token toward the 21-cent
floor established in August.
Why Dogecoin price is going down today? Source: Tradingview.com
Seasonal Patterns Offer
Hope
Despite
near-term weakness, from my technical analysis, historical patterns
suggest potential for recovery. “While near-term weakness is possible
between now and month-end, the market is also entering what is historically the
strongest quarter of the year for crypto,” Kruger observed.
According
to market analysis, seasonally favorable flows and positioning have often set
the stage for powerful year-end rallies. “Fresh record highs in both Bitcoin and ether remain in view if the macro backdrop cooperates,” the
LMAX strategist added.
However,
Kruger cautioned that “sustained dollar strength or geopolitical
developments—ranging from U.S. regulatory moves to broader global political
tensions—could further test crypto’s resilience.”
From my
technical analysis, the key levels to watch include Bitcoin’s $105,000 support
zone, Ethereum’s $4,060 consolidation floor, XRP’s $2.58-$2.70 support band,
and Dogecoin’s 21-cent August low. These technical boundaries will likely
determine whether the current correction represents healthy consolidation or
the beginning of a deeper bear phase.
“For
now, however, the balance of risks leans toward consolidation or modest
downside unless Bitcoin can decisively clear overhead resistance,” Kruger
concluded.
Read my other posts and analysis related to the cryptocurrency market:
FAQ
Why does the crypto market
go down?
The crypto
market declines due to multiple interconnected factors. Macroeconomic
conditions play a crucial role: when central banks raise interest rates,
borrowing becomes more expensive and reduces liquidity in financial markets,
leading to lower investment in risky assets like crypto. Market sentiment and
speculation also drive volatility, as prices are often influenced more by
investor emotions than intrinsic value. Regulatory developments create
uncertainty, with crackdowns or proposed regulations often triggering panic
selling.
Will crypto rise again?
Historical
patterns suggest crypto markets tend to recover from downturns, particularly
during the fourth quarter which has traditionally been the strongest period for
digital assets. Seasonally favorable flows and institutional positioning often
set the stage for year-end rallies, with fresh record highs remaining possible
if macroeconomic conditions cooperate. However, recovery depends on factors
including Federal Reserve policy clarity, regulatory developments, and overall
market sentiment toward risk assets.
What is the 30 day rule in
crypto?
The 30-day
rule, also known as the wash sale rule, prevents investors from claiming tax
losses while immediately repurchasing the same asset. However, most
cryptocurrencies are currently exempt from this rule since they’re not legally
defined as securities by tax authorities. In traditional markets, investors
must wait 30 days after selling an asset at a loss before buying it back to
claim the tax deduction.
What does Warren Buffett
say about crypto?
Warren
Buffett has been consistently critical of cryptocurrency, famously calling
Bitcoin “rat poison squared” at Berkshire Hathaway’s 2018 annual
meeting. At the 2022 shareholder meeting, he stated: “If you told me you
owned all of the bitcoin in the world and you offered it to me for $25, I
wouldn’t take it because what would I do with it? I’d have to sell it back to
you one way or another. It isn’t going to do anything”. Buffett believes
cryptocurrencies lack intrinsic value and don’t produce concrete returns like
traditional investments.
A few mindful moves can ease stress, boost circulation, and help you feel reset once you land.
Travel can be exhausting and throw us off schedule, just when we want to feel our best. We often go on vacation hoping to reset, only to return home even more tired than when we left. It’s no wonder traveling comes with many obstacles. Do any of these sound familiar?
● Anxiety from fear of flying ● Headaches and fatigue are caused by dehydration from the low humidity in airplanes ● Fluid retention in the legs and feet caused by cabin pressure and long periods of sitting ● Nausea from motion sickness
Tips to Combat Travel Stress
Here are some simple ways to combat the travel struggles we’re all so familiar with:
At The Airport
Breathing Exercises: Why: If you’re at the airport feeling stressed or anxious about flying, this simple breathing exercise can tap into your parasympathetic nervous system in as little as two minutes. Try it: Breathe in for a count of four, out for a count of six. Do this for at least two minutes.
Walking: Walking is one of the best ways to keep the blood flowing and our joints mobile. You might feel tired and tempted to sit down, but fatigue is often caused by lack of sleep or dehydration. Drink water and take your steps! Try it: If you have a layover, instead of sitting in the waiting area, use the time to walk.
Calf Raises: These help prevent fluid retention in your ankles and legs. Try it: Shift your weight to the balls of your feet and lift your heels off the ground. Set your heels back down. Repeat several times.
On The Plane
Seated Cat/Cow Loosens the spine and helps combat hunched posture. Try it: Place your hands on your thighs, inhale, extend your spine; exhale, tuck your chin in toward your chest, and round your spine. Repeat a few times.
Seated Twist Stretches the chest and lower back, which both get tight from prolonged sitting. Try it: Exhale, turn your chest to the right, rotate your spine, and inhale to release. Switch sides.
Seated Figure-Four Relieves sciatica and stretches tight hips. Try it: Place one ankle on top of your opposite thigh in a figure four position. Fold over your legs to release your lower back.
Pro traveler tip: Set a timer for every hour. Get up, stretch, or walk the aisle if the seatbelt sign is off. Before you sit back down, do 15-20 calf raises to keep circulation flowing.
Post-Travel Yoga Routine
Undo stiffness from long travel days with these six simple yoga poses:
Low lunge Opens tight hip flexors and resets posture after sitting. Try it: Step one foot forward, lower your hips, and reach your arms overhead.
Pigeon Pose Relieves sciatica and low back stiffness. Try it: Rotate your front leg away and bend the knee, lower pelvis, and extend the opposite leg back, fold over your bent front leg.
Lizard Lunge Stretches the groin, inner thigh, and hip flexors. Try it: From a lunge position, heel-toe your front foot as wide as your mat and lower your hips, release your forearms to the ground, reach your chest and head forward.
Sphinx Pose Stretches the front body, chest, and hip flexors. Try it: Lie on your belly and prop your body up on your forearms, drawing your chest forward.
Puppy Pose Stretches under arms, chest, and extends spine. Try it: From a table-top, walk your hands all the way out until your head or chest reaches the ground, keeping your hips stacked over your knees.
Legs Up The Wall Improves circulation. Try it: Lie on your back, straighten your legs up against a wall.
Even small movements can make a big difference when traveling! A few simple practices can keep your body open, your circulation flowing, and your mind calmer, so you can actually enjoy your trip and feel better coming home.
About the author
Cathy Madeo is a yoga expert and founder of Cathy Madeo Yoga, a global online yoga school educating and empowering thousands of yoga students and teachers worldwide with her online courses and Yoga Teacher Trainings. You can learn more at https://www.cathymadeoyoga.com/ and follow her on Instagram @cathymadeoyoga
Disclaimer The Content is not intended to be a substitute for professional medical advice, diagnosis, or treatment. Always seek the advice of your physician or other qualified health provider with any questions you may have regarding a medical condition.
The (Brent) price rose in its last intraday trading, in an attempt to recover some previous losses, and attempts to offload its clear oversold conditions on the relative strength indicators, especially with the emergence of the positive signals from there, amid the dominance of the main bearish trend on the short-term basis, with the continuation of the negative pressure that comes from its trading below EMA50, intensifying the negative pressure around the price, and reduces the chances of its recovery on the near-term basis.
VIP Trading Signals Performance by BestTradingSignal.com (September 15–19, 2025)
Get high-accuracy trading signals delivered directly to your Telegram. Subscribe to specialized packages tailored for the world’s top markets:
Full VIP signals performance report for September 15–19, 2025:
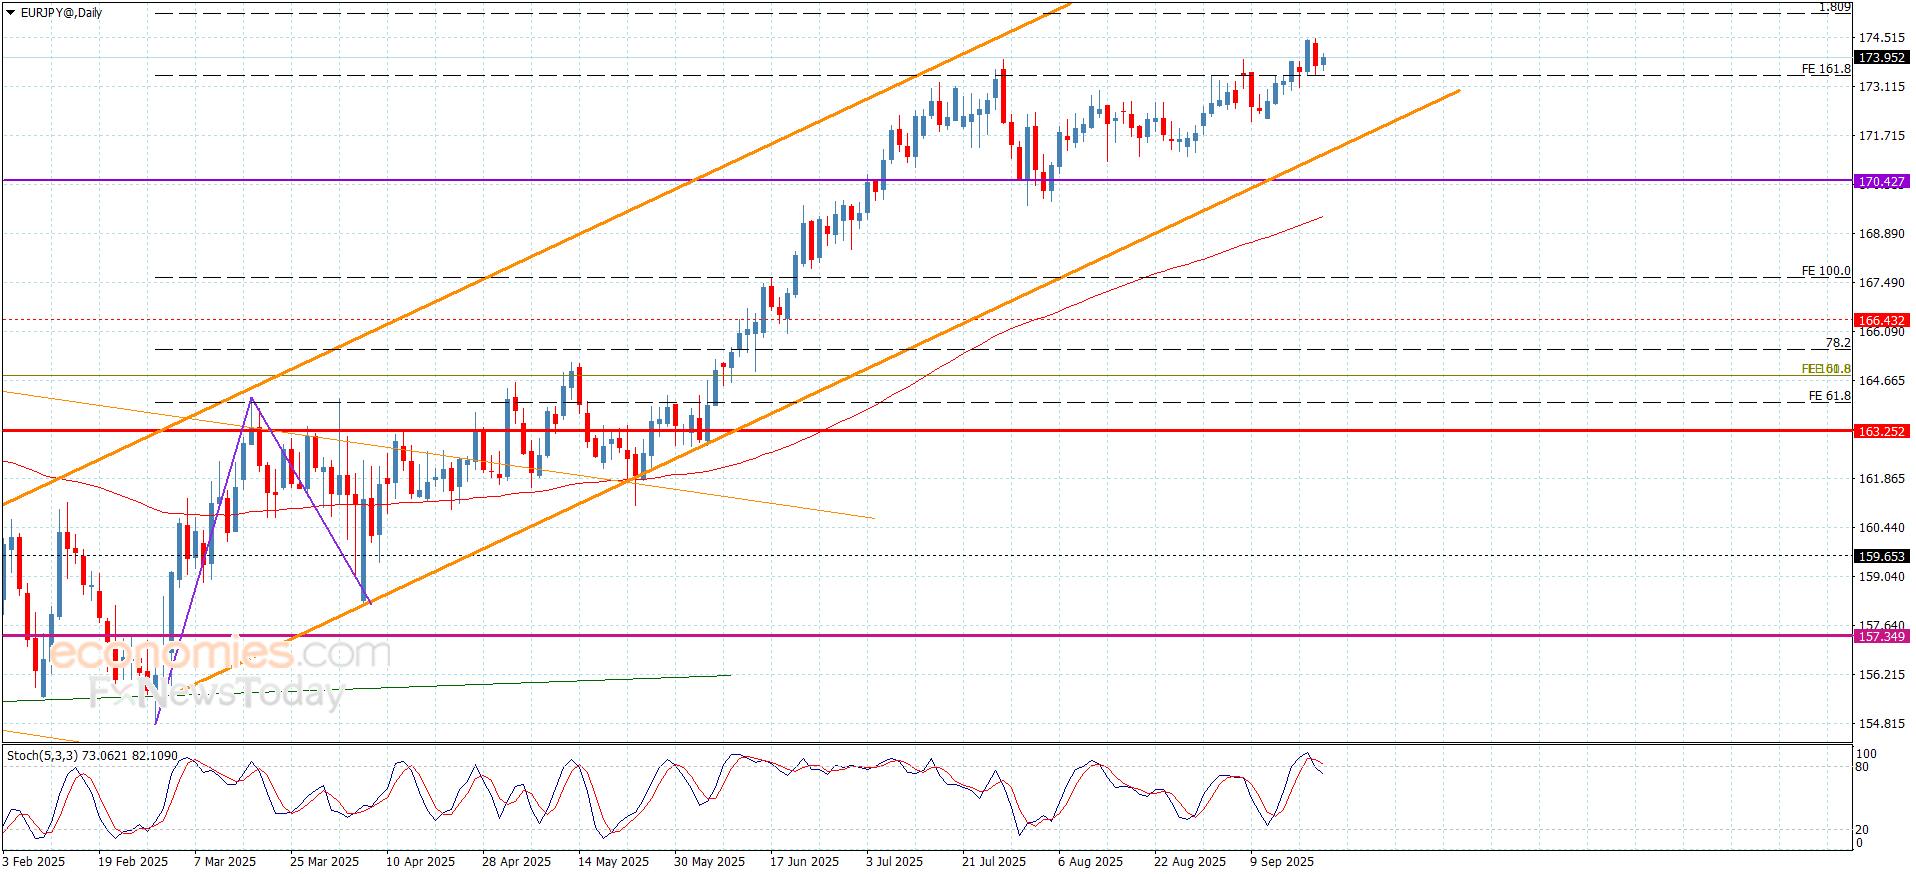
The EURJPY pair is forced to form bearish correction wave after hitting the target at 174.45, affected by stochastic attempt to exit the overbought level, noticing its fluctuation near the breached barrier, forming an extra support at 173.40.
The price success to settle above the current support will provide new chance for forming bullish waves, repeating the pressure on 174.40 level, and surpassing it will make it reach the next target near 175.20, while its surrender to the negative pressures by its move below the support will force it to delay the bullish attack, forming more of the correctional trading, to reach 172.80 initially, reaching the support of the bullish channel at 171.35.
The expected trading range for today is between 173.40 and 175.20
The resignation of Japanese food and beverage giant Suntory’s CEO, Takeshi Niinami, has sent shockwaves through the industry.
According to a formal statement from Suntory, Niinami had informed the company about a police investigation into the drug misconduct last month, and had offered his resignation over ‘personal reasons’, which was accepted on September 1.
“Suntory has recognized this to be an extremely serious matter from a governance perspective,” Suntory president Nobuhiro Torii stated at an emergency news conference.
“A hearing was immediately conducted with Niinami via an outside attorney, during which he explained that the investigation was being conducted about several supplements, which he had allegedly purchased with the understanding that they were legal.”
Meiji Co. Ltd is putting a twist to its flagship amino acid collagen powder with the addition of nicotinamide mononucleotide (NMN) in a bid to grow its global market share.
The new product, known as Amino Collagen NMN, launched on September 8.
Citing data from Japanese market research firm Fuji Keizai, Meiji said that NMN was a booming category in Japan.
Combining NMN with collagen could be a popular formulation not only for the domestic market, but also overseas — due to strong interest in NMN in markets such as China, Taiwan, and Vietnam.
Japan’s Otsuka Pharmaceutical is trying to grow its POCARI SWEAT electrolyte drink business through market expansion.
The brand recorded strong performance in both the domestic market and in the Philippines, the company said in its financial results for the first half of 2025.
Growth in the Philippines was said to be driven by new customer acquisition through geographical expansion.
In July, the company started the sale of POCARI SWEAT in India via its subsidiary Otsuka Nutraceutical India Private Limited, which was set up in Mumbai last year with a capital of about 3.2bn yen (US$21.7m).
Japanese firm YURU Co Ltd has introduced a new eye supplement containing liposomal lutein and coupled it with a proprietary habit support app catering to “supplement refugees”.
Named LUTE VITA, the product is aimed at addressing the damage caused by daily exposure to blue light and ultraviolet rays, as well as the growing health and beauty consciousness among modern consumers.
Additionally, the company has created a dedicated app called nometa to help consumers manage their supplement habits, with features serving to maintain consumption motivation.
Meiji has urged consumers to focus on protein consumption over exercise for muscle growth and maintenance, across all groups from seniors to athletes.
According to research data revealed by Meiji, the majority of consumers today are not consuming enough protein despite looking to improve their muscle mass.
“Based on analysis conducted by Meiji, we found that muscle resistance training is not always necessary – the consumption of protein alone without any exercise can lead to significant muscle mass increase when protein intake reaches 1.3g per kg of body weight,” Meiji Nutrition Development Research Unit Manager, Atsushi Kanda, said at the Food and Beverage Innovation Forum (FBIF) in Shanghai.
Many investors are focused on the XRP price prediction for the coming bull run, tracking every development from Ripple’s camp. While the established altcoin has a dedicated following, its growth potential is a constant debate, especially with an existing market cap in the hundreds of billions. It begs the question: What will 1000 XRP be worth in 2025, or can the explosive growth be found elsewhere?
Meanwhile, a new Ethereum Layer 2 project, Layer Brett (LBRETT), is gaining serious traction in its crypto presale, combining meme energy with powerful tech. It offers a ground-floor opportunity that legacy coins like XRP simply cannot match.
XRP price prediction: 1000 XRP could realistically be worth $5000
Analysts believe XRP could reach $5 before 2025 ends, making 1,000 XRP worth at least $5,000. Notably, 1,000 XRP is currently worth $2,980, and eight months ago, it was worth just $500. These analysts based their XRP price prediction on the assumption that XRP will continue its uptrend, especially with favourable developments for XRP.
For one, Ripple’s stablecoin, RLUSD, which was launched just eight months ago, has surpassed $500 million in market capitalization. It’s currently the second-fastest-growing stablecoin in 2025, trailing only BlackRock’s institutional USDTB.
Also, XRP’s ETF interest is rising. The newly launched XRP spot ETF has now exceeded analyst expectations with strong investor demand. Just on the first day, it recorded $37.7 million in trading volume. This made XRPR the largest debut by volume of any ETF launched in 2025.
With such massive inflows, analysts believe XRP can easily surge to $5. But while such a run is exciting, doubling in value is hardly the kind of life-changing return that made crypto millionaires. To find those opportunities today, many are turning their eyes to presales that combine real utility with early-stage explosive potential
Layer Brett: The early-stage cryptocurrency with bigger ROI potential
Layer Brett is the new meme coin pioneering the future of scalability and user rewards. It operates on an Ethereum Layer 2, a technology projected to process trillions of dollars annually. This architecture gives Layer Brett a massive advantage. It unlocks near-instant transactions and shrinks gas fees to mere pennies, a stark contrast to the congestion that plague older networks.
Furthermore, Layer Brett at $0.0058 offers immediate utility through high-yield staking. Users can stake and immediately earn up to 664% APY, a figure that reduces as more investors join. This dwarfs many of the yield opportunities available for XRP holders.
With this edge, Layer Brett is offering exponential growth rather than incremental gains and for investors who act now, the numbers are staggering. A $10,000 purchase at today’s presale price buys roughly 1.7 million tokens. If LBRETT reaches just $0.5 by 2026, that investment becomes $850 thousand. At the higher end of a $1 projection, it transforms into $1.7 million.
And this doesn’t even factor in the daily staking rewards that would add a steady income long before those targets are hit.
Conclusion
XRP’s momentum could push it towards $5, but its era of explosive growth may be in the past. For those seeking the next wave of innovation and returns, Layer Brett is the go-to choice. This Ethereum L2 meme token combines real utility, blistering speed, and huge staking rewards into one community-driven package.
The presale won’t last forever. With a $1 million giveaway also active, this is an opportunity to get in early on a project built for the future.
A new diet, known as the MIND (Mediterranean-DASH Intervention for Neurodegenerative Delay), could significantly lower a person’s risk of developing Alzheimer’s disease, according to a paper published online for subscribers in March in the journal Alzheimer’s & Dementia: The Journal of the Alzheimer’s Association. Researchers found that people who followed the diet closely had a 53 percent lower chance of developing Alzheimer’s, and those who only moderately adhered to the diet still lowered their risk of developing the devastating brain disease by 35 percent.
Alzheimer’s disease is an incurable, progressive degenerative disease of the brain. It is the most common form of dementia, a broad term for the deterioration of brain function which results in loss of memory, reduced language skills and behavioral and emotional problems.
Morris, a Rush professor, assistant provost for Community Research, and director of Nutrition and Nutritional Epidemiology and her colleagues have developed the MIND diet based on information that has accrued from years’ worth of past research about what foods and nutrients have good, and bad, effects on the functioning of the brain over time.
Blueberries are one of the more potent foods in terms of protecting the brain
The MIND diet has 15 dietary components, including 10 “brain-healthy food groups” — green leafy vegetables, other vegetables, nuts, berries, beans, whole grains, fish, poultry, olive oil and wine — and five unhealthy groups that comprise red meats, butter and stick margarine, cheese, pastries and sweets, and fried or fast food.
The MIND diet, advices a person to eat
Three servings of whole grains
A salad
One other vegetable every day
A glass of wine
Snack most days on nuts,
Have beans every other day
Eat poultry and berries at least twice a week
Fish at least once a week.
One should limit the intake of the designated unhealthy foods, especially butter (less than 1 tablespoon a day), cheese, and fried or fast food (less than a serving a week for any of the three), to have a real shot. The longer a person eats the MIND diet, the less risk that person will have of developing AD.
Disclaimer The Content is not intended to be a substitute for professional medical advice, diagnosis, or treatment. Always seek the advice of your physician or other qualified health provider with any questions you may have regarding a medical condition.
Silver challenges a multi-month-old ascending channel resistance at the start of a new week.
A slightly overbought RSI on the daily chart warrants caution before placing fresh bullish bets.
Any corrective slide below $43.00 could be seen as a buying opportunity and remain limited.
Silver (XAG/USD) builds on Friday’s breakout momentum above the $43.00 mark and touches a fresh high since September 2011 at the start of a new week. The white metal trades around the $43.25 area during the Asian session, up 0.35% for the day, flirting with the top end of an ascending channel extending from the April swing low.
The aforementioned channel points to a well-established uptrend and backs the case for a further near-term appreciating move for the XAG/USD. That said, the Relative Strength Index (RSI) on the daily chart is flashing slightly overbought conditions and makes it prudent to wait for some near-term consolidation or a modest pullback before placing fresh bullish bets.
Any corrective slide below the $43.00 round figure, however, is more likely to attract fresh buyers near the $42.55 region. This, in turn, should help limit the downside for the XAG/USD near the $42.20-$42.15 region. This is closely followed by the $42.00 mark, below which the commodity could slide to the $41.65 area before eventually dropping to test sub-$41.00 levels.
On the flip side, acceptance above the ascending channel resistance will be seen as a fresh trigger for bullish traders and allow the XAG/USD to test the September 2011 swing high, around the $43.40 region. The positive momentum could extend further towards reclaiming the $44.00 round figure en route to the August 2011 peak, around the $44.25 region.
Silver daily chart
Silver FAQs
Silver is a precious metal highly traded among investors. It has been historically used as a store of value and a medium of exchange. Although less popular than Gold, traders may turn to Silver to diversify their investment portfolio, for its intrinsic value or as a potential hedge during high-inflation periods. Investors can buy physical Silver, in coins or in bars, or trade it through vehicles such as Exchange Traded Funds, which track its price on international markets.
Silver prices can move due to a wide range of factors. Geopolitical instability or fears of a deep recession can make Silver price escalate due to its safe-haven status, although to a lesser extent than Gold’s. As a yieldless asset, Silver tends to rise with lower interest rates. Its moves also depend on how the US Dollar (USD) behaves as the asset is priced in dollars (XAG/USD). A strong Dollar tends to keep the price of Silver at bay, whereas a weaker Dollar is likely to propel prices up. Other factors such as investment demand, mining supply – Silver is much more abundant than Gold – and recycling rates can also affect prices.
Silver is widely used in industry, particularly in sectors such as electronics or solar energy, as it has one of the highest electric conductivity of all metals – more than Copper and Gold. A surge in demand can increase prices, while a decline tends to lower them. Dynamics in the US, Chinese and Indian economies can also contribute to price swings: for the US and particularly China, their big industrial sectors use Silver in various processes; in India, consumers’ demand for the precious metal for jewellery also plays a key role in setting prices.
Silver prices tend to follow Gold’s moves. When Gold prices rise, Silver typically follows suit, as their status as safe-haven assets is similar. The Gold/Silver ratio, which shows the number of ounces of Silver needed to equal the value of one ounce of Gold, may help to determine the relative valuation between both metals. Some investors may consider a high ratio as an indicator that Silver is undervalued, or Gold is overvalued. On the contrary, a low ratio might suggest that Gold is undervalued relative to Silver.