About Editorial team of BIPNs

Main team of content of bipns.com. Any type of content should be approved by us.
13 08, 2025

The GBPJPY resumes the rise– Forecast today – 13-8-2025

By |2025-08-13T14:48:18+03:00August 13, 2025|Forex News, News|0 Comments

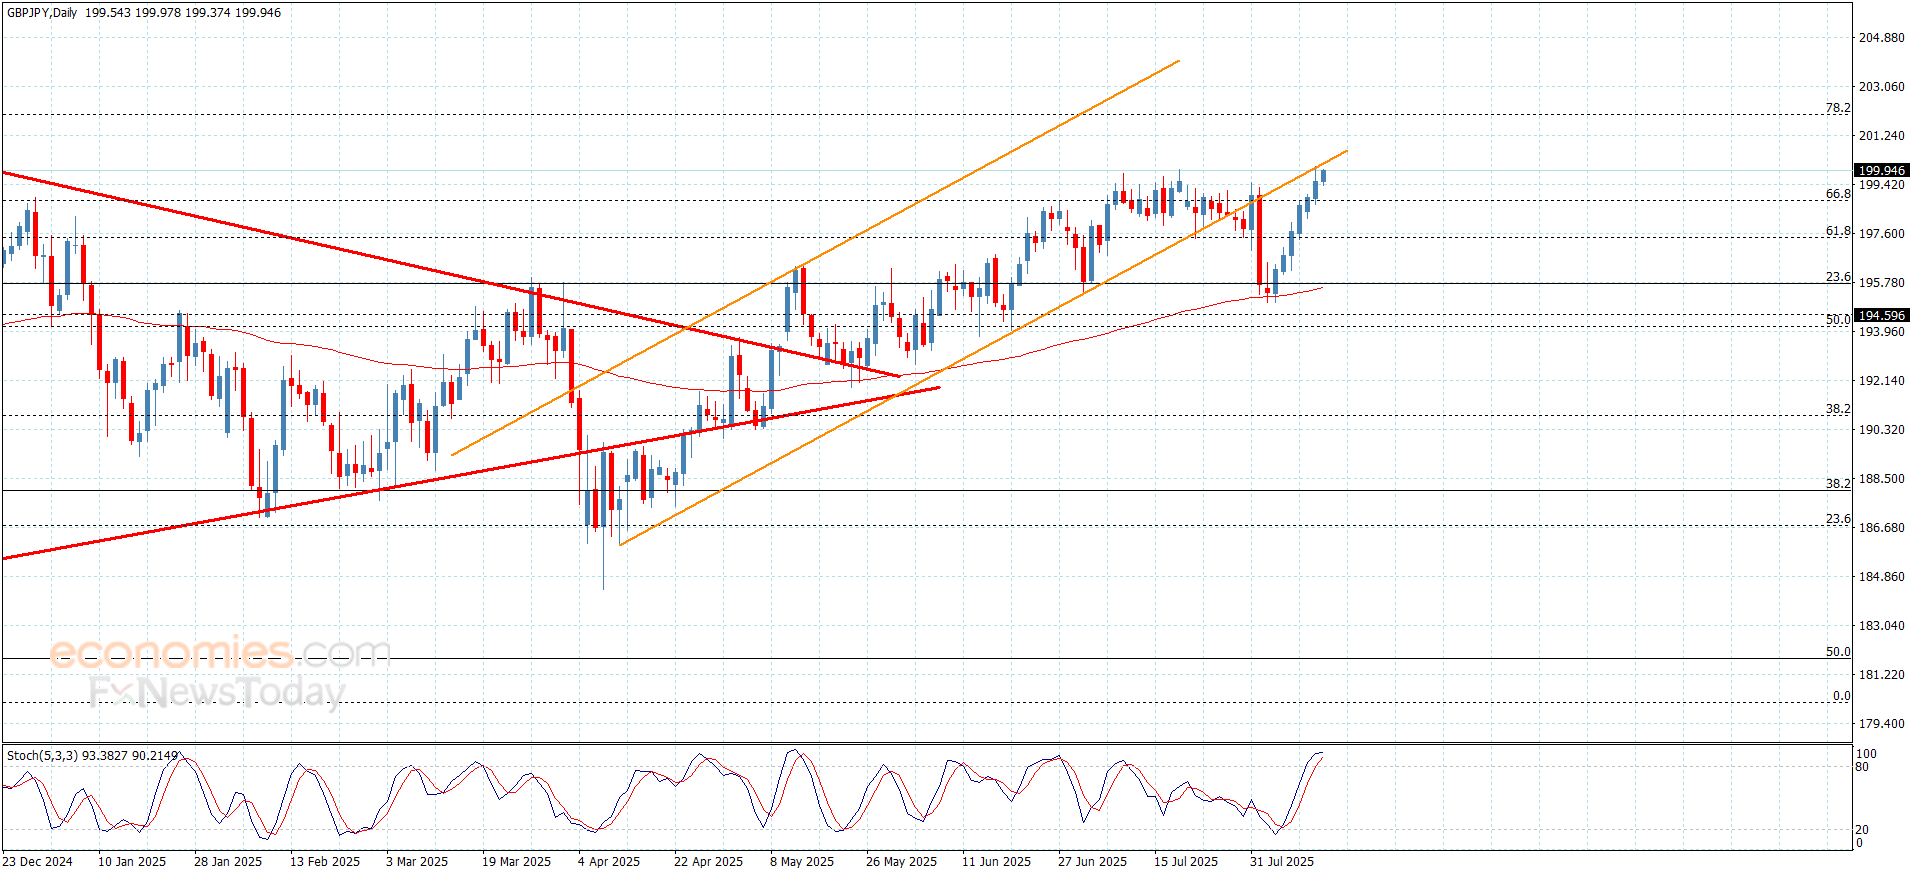
The GBPJPY pair succeeded in settling above 66%Fibonacci correction level at 198.85, reinforcing the continuation of the positivity, to face 200.10 resistance, achieving the extra waited target in the previous report.


Note that monitoring the price behavior as there is a chance for forming mixed trading until breaching the current resistance, to settle within the bullish channel’s levels again, increasing the chances for achieving extra gains that might begin at 200.85 reaching 78.2%Fibonacci correction level at 202.00.


The expected trading range for today is between 199.25 and 200.40


Trend forecast: Sideways


Source link

13 08, 2025

The truth on its side effects as shortage panic kicks in

By |2025-08-13T14:43:58+03:00August 13, 2025|Dietary Supplements News, News|0 Comments


Has anyone else noticed… that things are looking pretty green of late? It seems that matcha, a type of green tea, in all its various forms (be it an iced latte from Blank Street to an infused doughnut or a homemade recipe on TikTok) is everywhere. So much so, there is even rumoured panic about a shortage of the green tea in some popular chain stores, including (according to one distressed Reddit thread) some Starbucks cafés.

This shortage is something that experts are warning could become a bigger problem when Trump’s now-infamous tariffs fully kick in and due to Japan – where matcha originates – struggling with intense heat that is damaging some crops. Plus demand for matcha globally has soared 7% in the last year alone and according to data from Grand View Research, the market is set to be worth over $7 billion (£5 billion) by 2030.

But where has all this hype around the Japanese green tea suddenly come from? And is its cult status as a wellness ingredient that’s better for you than coffee actually legitimate? We asked two experts in the matcha field for the full truth on our newfound obsession…

Where has the matcha trend come from?

The steadily rising interest in Japan as a tourist destination over the last few years certainly has something to do with it, along with matcha itself being so gosh darn aesthetically pleasing – which lends itself well to social content. Plus, we’re living in a world where wellness is more of a priority than ever, leading us to seek out healthier ingredients.

Rania Salman, a registered dietitian and nutritionist verified on Doctify, a healthcare review platform, feels matcha’s links to wellness are a big draw too. “People are looking for natural ways to boost their health and wellbeing, and [matcha’s] striking green colour and links to traditional Japanese tea ceremonies add to its appeal,” she explains. “Plus, it’s incredibly versatile, from lattes to smoothies and even baking.”

pinterest

Irina Marwan//Getty Images

It’s not just a phase either, according to Olivia Minicucci, MS, RD, Dietician at popular matcha brand PerfectTed that launched in 2021, “Matcha isn’t a passing fad. It’s a habit-forming ingredient that delivers tangible benefits people can feel and as consumers prioritise clean, functional drinks over quick, synthetic fixes, its place in everyday life will only continue to grow.” Their products are now stocked in the likes of Joe & the Juice and Black Sheep.

Is there really a matcha shortage right now?

For some brands and outlets, unfortunately the answer is yes. “Recent months have seen major shortages of ceremonial-grade matcha, resulting in widespread supply issues and the largest price increase in matcha’s history,” reveals Minicucci, who adds that luckily PerfectTed has remained largely unaffected.

Teddie Levenfiche, the brand’s co-founder adds, “Matcha supply constraints have been challenging, but we’ve been able to maintain consistent supply thanks to our efforts in building the strongest matcha supply chain in the world – rooted in long-standing relationships with our farmers and continued investment in strengthening our network.”

What’s the difference between ceremonial and culinary matcha?

Not just delicious and pleasing to look at, matcha brings with it a whole new set of words, with many touting ‘ceremonial grade’ as the best option for drinks. But, err, what the heck actually is that?

Salman explains that it’s all to do with the age of the tea leaves. “Ceremonial grade matcha is made from the youngest, most tender tea leaves. It’s finely ground to a smooth powder with a vibrant green colour and a subtle, sweet umami flavour. This type is meant to be whisked with water and enjoyed on its own,” the expert notes, whereas culinary grade is derived from older leaves, with a stronger and more bitter taste.

As the descriptor ‘culinary grade’ unsurprisingly notes, this type of matcha is better suited to baking (matcha cookies, anyone?). “While it’s more affordable, it doesn’t quite match the delicate flavour or the quality of nutrients found in ceremonial grade matcha,” Salman says.

Ceremonial grade also tends to be sourced more sustainably, so if that’s important to you, this is something to keep in mind – however, there’s a real lack of regulation in the space, details Minicucci. “Ceremonial grade might sound like a fixed standard – but the truth is, there’s no global regulation around what qualifies. Any brand can put it on a label, whether or not their matcha meets the benchmarks that experts actually use to assess quality. That’s why it’s so important to shop with trusted brands.”

Magical Matcha Selection Box

Magical Matcha Selection Box

High-Grade Organic Matcha Powder

OMGTEA High-Grade Organic Matcha Powder

Matcha Variety Pack (four flavours)

Matcha Variety Pack (four flavours)

Organic Japanese Matcha Powder (40g)

Clearspring Organic Japanese Matcha Powder (40g)

Is matcha better than coffee?

‘Better’ is a pretty subjective word, admittedly, so it depends what you’re looking for in a beverage. Much like coffee, matcha contains caffeine so it’ll still put a pep in your step, but unlike coffee, it’s less likely to cause jitters or an anxiety spike if you consume too much.

Minicucci explains, “Matcha and coffee work in different ways due to their distinct caffeine profiles and other compounds. When it comes to caffeinated release, the caffeine in coffee is absorbed quickly, leading to a fast, often intense spike, followed by a potential ‘crash’ when its effects wear off.

“A standard cup of coffee contains around 95mg of caffeine. Matcha, on the other hand, contains less caffeine per serving (about 60mg per cup), but the caffeination it provides tends to be more sustained and gradual due to the presence of L-theanine, an amino acid that promotes relaxation without drowsiness.”

Salman adds that matcha is also rich in antioxidants “which support cell health and may help reduce stress.”

On the other end of the spectrum (and in defence of flat whites the world over), coffee has its own great antioxidants that are linked to reduced risks of conditions like Parkinson’s disease and type 2 diabetes, Salman shares. “Ultimately, whether matcha or coffee is better comes down to your personal caffeine tolerance, which effects you want, and your taste preferences.”

What does hot water do to matcha?

Just a final FYI, how you prep your matcha can make a huge difference to the taste and intensity of it, shares Salman. “Using more powder or hotter water will increase the caffeine content and change the flavour.” If you’re new to the matcha scene, she advises starting small – and keeping in mind that if you’re mixing in syrups, sweeteners or certain milks, the calorie count can jump up pretty easily.

Headshot of Jennifer Savin

 Jennifer Savin is Cosmopolitan UK’s multiple award-winning Features Editor, who was crowned Digital Journalist of the Year for her work tackling the issues most important to young women. She regularly covers breaking news, cultural trends, health, the royals and more, using her esteemed connections to access the best experts along the way. She’s grilled everyone from high-profile politicians to A-list celebrities, and has sensitively interviewed hundreds of people about their real life stories. In addition to this, Jennifer is widely known for her own undercover investigations and campaign work, which includes successfully petitioning the government for change around topics like abortion rights and image-based sexual abuse. Jennifer is also a published author, documentary consultant (helping to create BBC’s Deepfake Porn: Could You Be Next?) and a patron for Y.E.S. (a youth services charity). Alongside Cosmopolitan, Jennifer has written for The Times, Women’s Health, ELLE and numerous other publications, appeared on podcasts, and spoken on (and hosted) panels for the Women of the World Festival, the University of Manchester and more. In her spare time, Jennifer is a big fan of lipstick, leopard print and over-ordering at dinner. Follow Jennifer on Instagram, X or LinkedIn.


Source link

13 08, 2025

Ethereum Price Prediction 2025: USD Performance,…

By |2025-08-13T14:41:37+03:00August 13, 2025|Crypto News, News|0 Comments

Ethereum (ETH) has surged to one of its highest levels in years, drawing renewed attention from investors and traders in the UK and worldwide. As of mid-August 2025, the cryptocurrency is trading near $4,635, placing it just 4.7% below its all-time high of $4,878.26 reach in November 2021.

The rally has raised questions about how far it can climb in the coming months, how its performance compares to Bitcoin, and what past price trends suggest for 2025.

Current Ethereum USD Price Performance

Ethereum’s latest trading figures show strong momentum. At the time of writing, according to CoinGecko, ETH stands at approximately $4,633.76, with an intraday high of USD 4,674.11 and a low of USD 4,265.82. In GBP terms, the price is around £3,430.02, depending on the exchange. Over the last 24 hours, ETH has climbed between 7 and 8% in GBP, while posting a weekly gain of approximately 28%.

This surge places it firmly at the top of UK trending cryptocurrency lists, reflecting a spike in investor searches and market activity.

Bitcoin Price Gap Analysis

Bitcoin (BTC), the world’s largest cryptocurrency, is currently about 3% below its own all-time high. The gap between ETH and BTC has narrowed significantly during recent rallies, with Ethereum now within 5% of its record price in USD. Market analysts note that this catch-up trend is particularly notable given Bitcoin’s dominant position in the market.

The narrowing gap is seen as a sign of Ethereum’s strengthening market position, supported by broader investor confidence in its underlying technology and potential network upgrades. While Bitcoin remains the benchmark for crypto performance, Ethereum’s recent pace suggests it is making significant gains in relative value.

Key Market Drivers Behind the Surge

Several factors have contributed to Ethereum’s current rally. Since June, institutional investors such as Bitmine Immersion Technologies and Sharplink Gaming have collectively acquired more than 2 million ETH for their digital asset treasuries. This large-scale accumulation has tightened supply and reinforced bullish sentiment.

Regulatory developments have also played a role. The US Securities and Exchange Commission (SEC) is moving closer to approving Ethereum exchange-traded funds (ETFs), which could enable institutional investors to earn yields on ETH holdings.

Additionally, a recent US policy change allowing 401(k) retirement plans to include cryptocurrency investments has triggered inflows of around USD 268 million into Ethereum-related products.

Combined with a wider upswing in the cryptocurrency sector, these developments have positioned Ethereum as one of the top-performing assets in mid-2025.

Historical Price Context

Ethereum’s price history shows several major peaks and corrections since its launch in 2015. Its previous all-time high came in late 2021, during a market-wide surge. Following a prolonged downturn in 2022, ETH began to recover in 2023 and 2024, although gains were initially slower than Bitcoin’s.

Historical patterns indicate that Ethereum has often experienced sharp rises once momentum builds, followed by periods of consolidation. Previous cycles have also shown that external factors such as regulatory announcements, institutional adoption, and macroeconomic trends can heavily influence the scale and duration of these rallies.

Data-Driven 2025 Outlook

Analysts examining Ethereum’s trajectory point to several possible scenarios for 2025. If current institutional inflows continue and ETF approvals materialise, ETH could break past its previous all-time highs in USD and GBP. Historical price data suggests that when Ethereum closes the gap with Bitcoin in strong market conditions, it often moves swiftly to new peaks.

Factors such as Bitcoin’s performance, global economic conditions, and the pace of adoption for Ethereum’s decentralised applications will likely determine whether the current rally sustains into 2025 or faces another correction.


Source link

13 08, 2025

Copper price rises slowly– Forecast today – 13-8-2025

By |2025-08-13T12:52:02+03:00August 13, 2025|Forex News, News|0 Comments


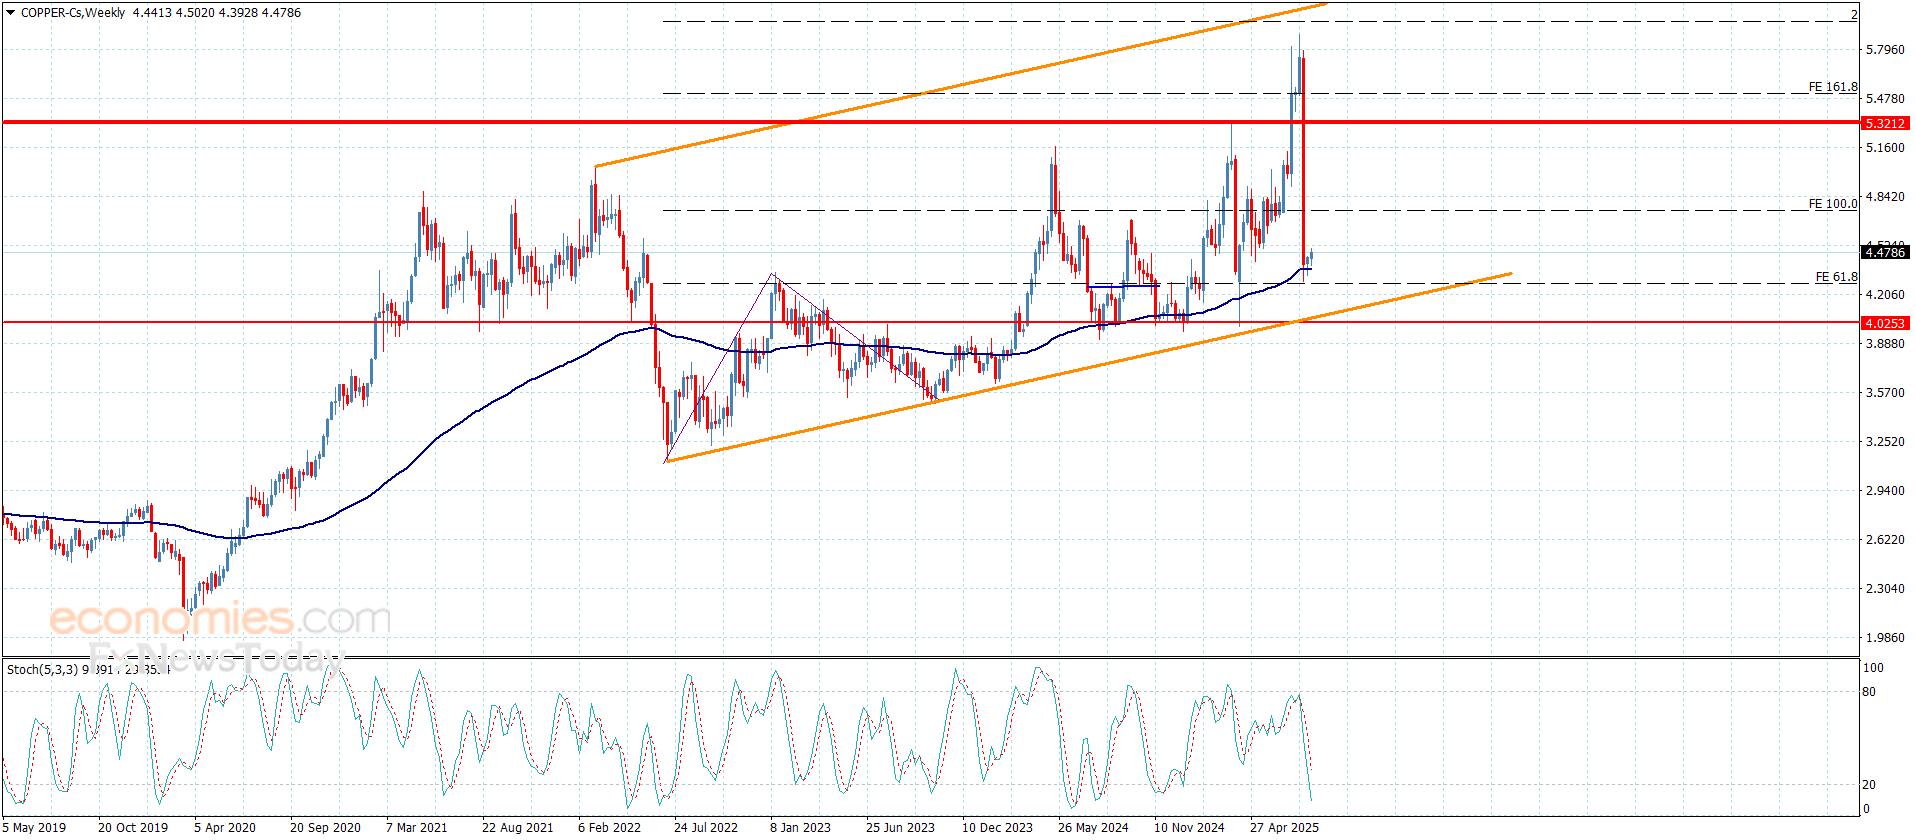
Copper price began forming slow bullish waves after stochastic reach to oversold level, to announce surpassing the negative pressure, to keep its main stability within the bullish track, which depends on the stability of the support level at $4.0500.


The price success in gaining positive momentum will ease the mission of recording positive stations, to keep waiting for reaching $4.6300, then press on the barrier at $4.7400, to monitor its behavior due to the importance of this level to detect the expected trend in the upcoming trading.


The expected trading range for today is between $4.330 and $4.6300


Trend forecast: Bullish


Source link

13 08, 2025

The EURJPY keeps rising– Forecast today – 13-8-2025

By |2025-08-13T12:47:07+03:00August 13, 2025|Forex News, News|0 Comments

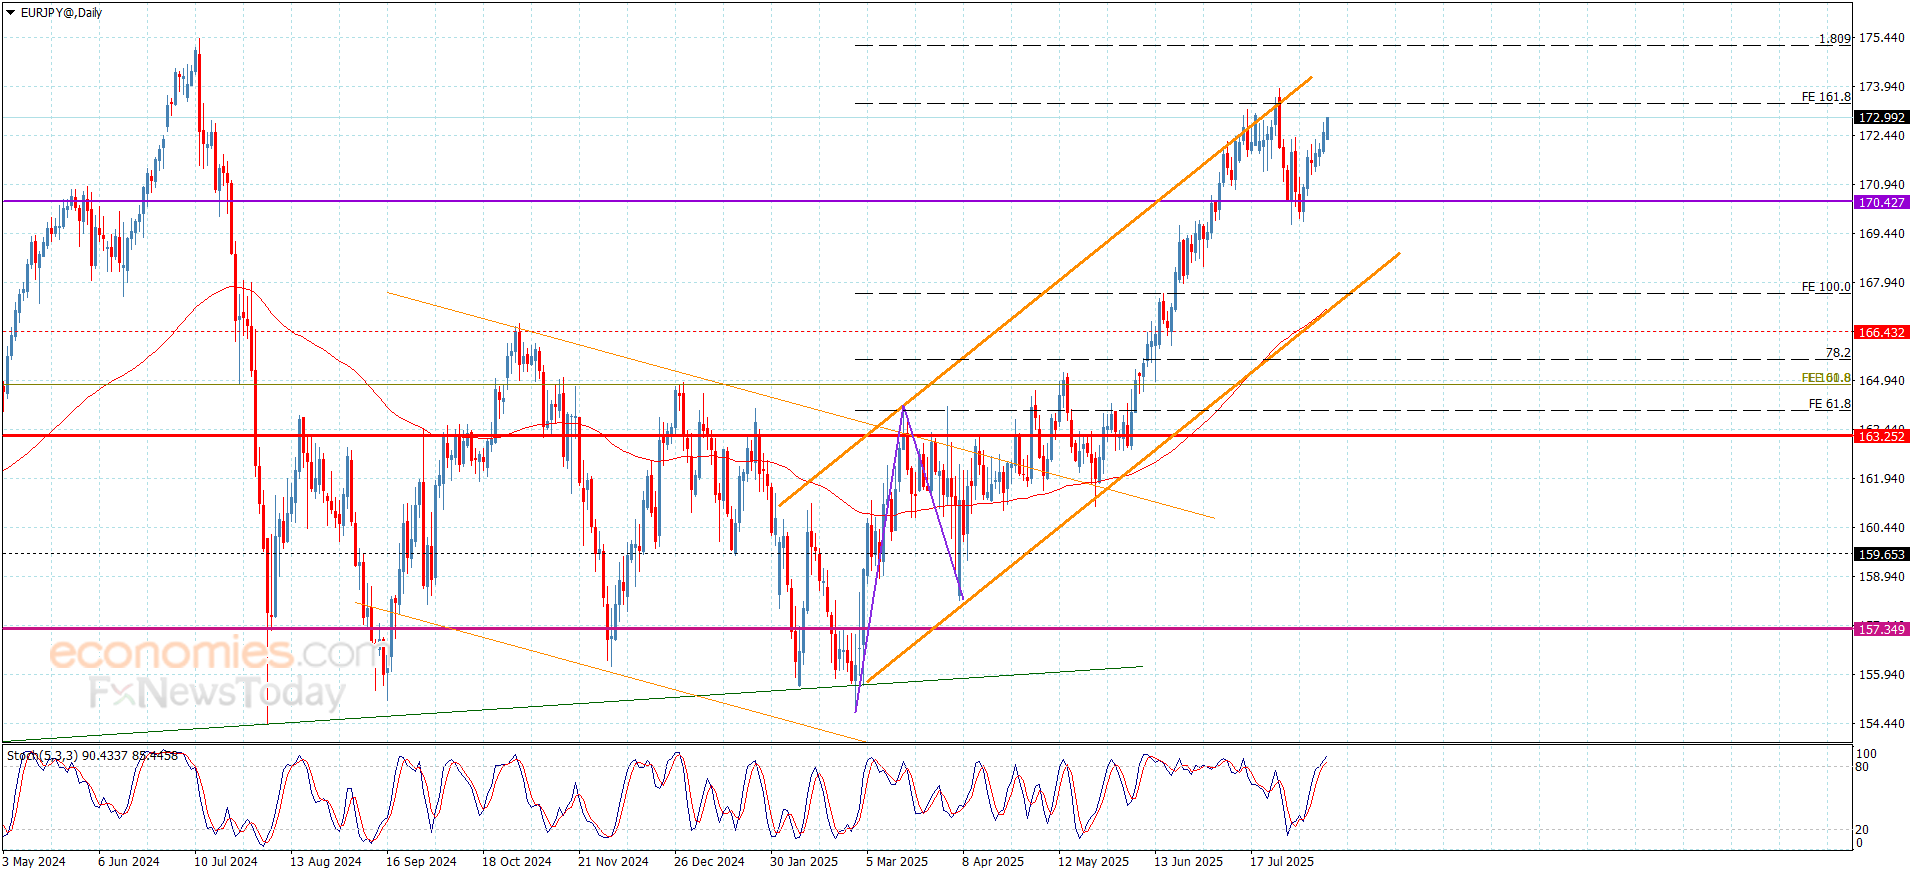
The GBPJPY pair succeeded in settling above 66%Fibonacci correction level at 198.85, reinforcing the continuation of the positivity, to face 200.10 resistance, achieving the extra waited target in the previous report.


Note that monitoring the price behavior as there is a chance for forming mixed trading until breaching the current resistance, to settle within the bullish channel’s levels again, increasing the chances for achieving extra gains that might begin at 200.85 reaching 78.2%Fibonacci correction level at 202.00.


The expected trading range for today is between 199.25 and 200.40


Trend forecast: Sideways


Source link

13 08, 2025

Global Multivitamin for Women Market to Reach USD 13.64

By |2025-08-13T12:42:57+03:00August 13, 2025|Dietary Supplements News, News|0 Comments


Austin, Aug. 13, 2025 (GLOBE NEWSWIRE) — Multivitamin for Women Market Size & Growth Outlook

According to SNS Insider, the global Multivitamin for Women Market was valued at USD 9.05 billion in 2023 and is projected to reach USD 13.64 billion by 2032, growing at a CAGR of 4.83% during 2024-2032. The U.S. Multivitamin for Women market, representing a significant share, is forecasted to expand from USD 3.14 billion in 2023 to USD 4.55 billion by 2032 at a CAGR of 4.07%, fueled by an increasing focus on preventive care, nutrient-rich supplementation, and lifestyle-driven health challenges.

The market growth is supported by factors such as heightened awareness of micronutrient deficiencies, the surge in personalized nutrition solutions, and ongoing research linking multivitamin intake to long-term wellness and disease prevention.


Get Free Sample Report of the Multivitamin for Women Market: https://www.snsinsider.com/sample-request/4425

Market Overview

Multivitamins for women have evolved far beyond basic dietary supplements, now tailored to address specific life stages — from reproductive health to post-menopausal needs. Formulations are being refined to include bioavailable forms of vitamins and minerals, adaptogens, probiotics, and plant-based antioxidants.

In the U.S., younger women are increasingly adopting multivitamins as part of a preventive health strategy, while older age groups are prioritizing bone health, cardiovascular support, and immunity. E-commerce platforms, subscription models, and influencer-driven wellness trends are amplifying accessibility and brand visibility.

Major Players Analysis Listed in this Report are:

  • New Chapter
  • Nature Made
  • Garden of Life
  • Swisse
  • MegaFood
  • Rainbow Light
  • Suku Vitamins
  • Bayer
  • Gaia Herbs
  • Ritual & other players

Multivitamin for Women Market Report Scope

Report Attributes Details
Market Size in 2023 US$ 9.05 Billion
Market Size by 2032 US$ 13.64 Billion
CAGR CAGR of 4.83% From 2024 to 2032
Base Year 2023
Forecast Period 2024-2032
Historical Data 2020-2022
Regional Analysis North America (US, Canada, Mexico), Europe (Germany, France, UK, Italy, Spain, Poland, Turkey, Rest of Europe), Asia Pacific (China, India, Japan, South Korea, Singapore, Australia, Rest of Asia Pacific), Middle East & Africa (UAE, Saudi Arabia, Qatar, South Africa, Rest of Middle East & Africa), Latin America (Brazil, Argentina, Rest of Latin America)

Segment Analysis

By Type, Tablets and Capsules Segment Dominates the Multivitamins for Women Market

In 2023, the tablets and capsules segment held the highest revenue share for the multivitamins for women market, with around 41%, owing to their convenience of consumption, longer shelf life, and exact dosage delivery. These formats reign supreme among consumers for their convenience with storage/portability, and have a solid manufacturing foundation established. Vitamins in the form of tablets, capsules, with controlled release and good absorption, which makes this more attractive to all age groups. Their strong availability in retail pharmacy and the x-commerce platforms also makes them cost-effective for consumers and makes them market leaders, along with the presence of the majority of the women’s population who prefer daily nutrition supplements, keeping ease of consumption in mind.

By Distribution Channel, the Online Retail Segment Holds The Largest Market Share in 2023

Due to increasing penetration of digital commerce and rising consumer inclination towards convenience, the online retail segment dominated the multivitamins for women market in 2023 with 43%. E-commerce platforms such as Amazon, iHerb, and Walmart offered a wide variety of products, reviews from other buyers, and delivery to your doorstep, which made them appealing purchase points. The segment continued to get a boost from the pandemic-related shift to online shopping habits, which have remained after the COVID-19 outbreak. Vitamin subscriptions tailored to the individual, and the ability to market them through social media, made them supremely well-suited to direct-to-consumer sales, particularly with younger women and other health-conscious women looking for transparency and convenience in product selection and delivery.

For a Personalized Briefing with Our Industry Analysts, Connect Now: https://www.snsinsider.com/request-analyst/4425

Multivitamin for Women Market Segmentation

By Type

  • Tablets/Capsules
  • Liquids and Powders
  • Chewable & Gummies

By Life Stage

  • Adolescence
  • Pregnant and Lactating Women
  • Postmenopausal Women

By Distribution Channel

  • Online Retail
  • Pharmacies/Drugstores
  • Supermarkets/Hypermarkets
  • Specialty Stores

Regional Trends

North America dominated the Multivitamins for Women Market with 44% Market Share in 2023

The multivitamins for women market in North America held the largest share in 2023, which can be attributed to the high awareness of health, advanced infrastructure of healthcare, and the presence of prominent manufacturing companies for the supplement in the region. The people in the region show a proactive health behavior, with a rising focus on preventive healthcare and nutritional dietary supplements. Furthermore, the accessibility of diverse premium-quality multivitamins via both online and offline channels has been contributing to the growth of this market. The adoption of women-targeted multivitamin preparations is also escalating across the U.S.A. and Canada, attributed to increasing availability of favorable regulations and increasing levels of disposable income.

Buy the Full Multivitamin for Women Market Report (Single-User License) Now: https://www.snsinsider.com/checkout/4425

Unique Selling Propositions (USPs) of the Report:

Mapping the Consumer Behavior & the Purchase Journeys (Age & Region)

Assists the client in identifying the purchase drivers by age groups and geography, which can help in precision targeting, targeted marketing campaigns.

Impact Analysis of Regulatory & Labeling (Regional + global)

Helps the client understand global and local compliance requirements, avoid legal risks, and adapt product labeling to attract women in the hemispheres of interest to them.

Sentiment Trends of Influencers & Social Media

Shows how people view the brand on the internet, helping the client to find important influencers, control reputation, and customize campaigns separately.

CSE & D2C Benchmarking by E-commerce channel intelligence

Provides the client with insights on successful online channels and winning D2C models, enabling online sales strategy optimisation and margin expansion.

Innovation & Functional Ingredient Pipeline Tracking

Showcasing the future state of women’s health – communicates anticipated ingredients and product innovations that help keep the client on trend.

Women’s Health Alignment Matrix

Associate product benefits to the unique women-specific health concerns over life stages to enable product development and messaging to be tailored.

Practices of Sustainability Alignment with ESG & Female-Focused Branding

Enables the client to establish trust and loyalty through sustainable practices, inclusive elements, and gender-aligned brand storytelling.

Access Complete Report Details of Multivitamin for Women Market Analysis & Outlook@ https://www.snsinsider.com/reports/multivitamins-for-women-market-4425

[For more information or need any customization research mail us at info@snsinsider.com]

About Us:

SNS Insider is one of the leading market research and consulting agencies that dominates the market research industry globally. Our company’s aim is to give clients the knowledge they require in order to function in changing circumstances. In order to give you current, accurate market data, consumer insights, and opinions so that you can make decisions with confidence, we employ a variety of techniques, including surveys, video talks, and focus groups around the world.




Source link

13 08, 2025

Dogecoin Draws First Golden Cross Since November, Bolstering DOGE Price Predictions of 90% Upside

By |2025-08-13T12:39:53+03:00August 13, 2025|Crypto News, News|0 Comments

Dogecoin price
(DOGE) jumped another 5.3% today (Wednesday, 13 August, 2025), capping a
two-day 15% rally that’s pushed the meme cryptocurrency to its highest levels
in roughly a month. The token traded at $0.2493 Wednesday morning, marking
a 32% rebound from early August lows.

The latest
surge came as DOGE formed what traders call a golden cross – a
technical pattern that occurs when a security’s 50-day moving average
climbs above its 200-day average. This crossover happened for the first time
since November 2024, when Dogecoin went on to gain more than 130% over
the following four weeks.

Behind the
scenes, large investors have been accumulating positions aggressively.
Data shows whale wallets scooped up over 1 billion DOGE tokens worth
approximately $200 million in recent trading sessions. These big-money
players now control nearly half of all circulating supply, signaling
sustained institutional interest despite the token’s notorious volatility .

Tuesday’s
session saw typical meme coin drama. DOGE rallied from $0.221 to a
session high of $0.238 during afternoon trading before profit-taking knocked it
back to $0.233 by the close. The final hour brought a 1.3% decline as
some traders cashed in on the day’s gains.

However, the
buying pressure helped DOGE break through the psychologically
important 25-cent level on Wednesday. Technical analysts note
this round number had been acting as resistance, but the golden cross formation
could provide the momentum needed for further gains.

Dogecoin price today. Source: CoinMarketCap

Dogecoin Technical
Analysis And Golden Cross

The golden
cross carries mixed reliability across different markets, but DOGE
has historically responded well to the signal. Beyond the November 2024
surge, the pattern preceded a 25% four-week rally in late 2023. Most
dramatically, a golden cross in November 2020 kicked off a four-month bull
run that saw Dogecoin rocket over 1,000%.

According
to my technical analysis, the DOGE chart currently points to the 25-cent
area as a critical test. If buyers can hold above this level, the
next target sits around 28 cents – near July’s local highs where
the token previously stalled.

The broader
crypto market’s mixed signals haven’t dampened enthusiasm for DOGE
specifically. Trading volumes have remained elevated above the 24-hour
average of 387.7 million tokens, suggesting sustained interest from both retail
and institutional participants.

The 50 EMA is crossing above the 200 EMA, forming the well-known golden cross pattern

For now,
support appears solid at $0.232 and $0.220, levels that held during Tuesday’s
session. Resistance waits at $0.238, where sellers emerged to cap the day’s
rally.

The meme
coin sector often moves in sympathy with Dogecoin’s performance, making
the token’s technical breakout potentially significant for similar
cryptocurrencies . Whether this golden cross delivers the same explosive
results as previous occurrences remains to be seen, but the whale
accumulation suggests smart money is betting on upside.

Dogecoin to the Moon? DOGE
Price Prediction Hints at Near-$0.50 Potential

Although
DOGE is currently capped by the 25-cent level, Fibonacci extensions indicate
several potential upside targets if the price breaks out from current
resistance and the July highs near 28 cents. A key zone is the 161.8 percent
extension at 42 cents, which aligns with this year’s peaks. The ultimate target
is 48 cents, nearly $0.50, corresponding to the highs from November and
December 2025.

Dogecoin price prediction after the bullish golden cross technical pattern. Source: Tradingview.com

Ali
Martinez projects
an 80% gain to $0.42 by September
, reflecting a technical breakout
potential

Dogecoin Price Prediction Table

Analyst /
Institution

Price
Target

Context /
Date

Ali
Martinez (@ali_charts)

$0.42 by
September 2025

Based on a bullish “double bottom”
technical pattern

Chapo
(crypto influencer)

$0.50 by
end of July 2025

Driven by strong momentum and
historical breakout behavior

XForceGlobal
(technical analyst)

$1.00 before end of bull cycle

Forecast tied to broader market
sentiment and meme-coin resurgence

Crypto
Patel
(via CoinGape)

$2.00

Based on accumulation zones and
rising DOGE ETF optimism

Javon
Marks
(crypto analyst)

$2.28

Forecast suggests potential 10×
rally based on cyclical patterns

Dogecoin News FAQ

Does Dogecoin Really Have
a Future?

Dogecoin’s
future depends on a mix of factors: market adoption, utility, community
support, and overall crypto market trends. While it started as a meme coin, it
has maintained a strong presence thanks to its active user base and frequent
mentions from high-profile figures like Elon Musk. If more businesses accept
DOGE as payment and blockchain upgrades improve its speed and cost efficiency,
it could remain a relevant cryptocurrency for years to come.

Will Dogecoin Reach $10?

A $10
Dogecoin would require an enormous market capitalization, making it a very
unlikely short-term target under current conditions. Such a price could only be
possible in an extremely bullish, global-scale crypto adoption scenario. Most
analysts see $10 as a distant possibility, not a realistic projection for the
next few years.

What Will Doge Be Worth in
2025?

Analyst
forecasts for Dogecoin in 2025 vary widely. Conservative predictions place it
between $0.30 and $0.50, driven by technical patterns and current adoption
rates. More aggressive forecasts, tied to market hype or major adoption
breakthroughs, see potential moves toward $1 or higher. The most likely range
in 2025, according to recent market sentiment, is around $0.40–$0.50.

Will Dogecoin Go up to $1?

Reaching $1
is a more realistic target than $10, and several analysts believe it could
happen in the next bull cycle if trading volumes and investor interest remain
strong. Breaking past key resistance levels (such as $0.25, $0.28, and $0.42) would
be crucial steps toward the $1 milestone. However, sustained growth would
require broader crypto market strength and ongoing investor confidence.

Dogecoin price
(DOGE) jumped another 5.3% today (Wednesday, 13 August, 2025), capping a
two-day 15% rally that’s pushed the meme cryptocurrency to its highest levels
in roughly a month. The token traded at $0.2493 Wednesday morning, marking
a 32% rebound from early August lows.

The latest
surge came as DOGE formed what traders call a golden cross – a
technical pattern that occurs when a security’s 50-day moving average
climbs above its 200-day average. This crossover happened for the first time
since November 2024, when Dogecoin went on to gain more than 130% over
the following four weeks.

Behind the
scenes, large investors have been accumulating positions aggressively.
Data shows whale wallets scooped up over 1 billion DOGE tokens worth
approximately $200 million in recent trading sessions. These big-money
players now control nearly half of all circulating supply, signaling
sustained institutional interest despite the token’s notorious volatility .

Tuesday’s
session saw typical meme coin drama. DOGE rallied from $0.221 to a
session high of $0.238 during afternoon trading before profit-taking knocked it
back to $0.233 by the close. The final hour brought a 1.3% decline as
some traders cashed in on the day’s gains.

However, the
buying pressure helped DOGE break through the psychologically
important 25-cent level on Wednesday. Technical analysts note
this round number had been acting as resistance, but the golden cross formation
could provide the momentum needed for further gains.

Dogecoin price today. Source: CoinMarketCap

Dogecoin Technical
Analysis And Golden Cross

The golden
cross carries mixed reliability across different markets, but DOGE
has historically responded well to the signal. Beyond the November 2024
surge, the pattern preceded a 25% four-week rally in late 2023. Most
dramatically, a golden cross in November 2020 kicked off a four-month bull
run that saw Dogecoin rocket over 1,000%.

According
to my technical analysis, the DOGE chart currently points to the 25-cent
area as a critical test. If buyers can hold above this level, the
next target sits around 28 cents – near July’s local highs where
the token previously stalled.

The broader
crypto market’s mixed signals haven’t dampened enthusiasm for DOGE
specifically. Trading volumes have remained elevated above the 24-hour
average of 387.7 million tokens, suggesting sustained interest from both retail
and institutional participants.

The 50 EMA is crossing above the 200 EMA, forming the well-known golden cross pattern

For now,
support appears solid at $0.232 and $0.220, levels that held during Tuesday’s
session. Resistance waits at $0.238, where sellers emerged to cap the day’s
rally.

The meme
coin sector often moves in sympathy with Dogecoin’s performance, making
the token’s technical breakout potentially significant for similar
cryptocurrencies . Whether this golden cross delivers the same explosive
results as previous occurrences remains to be seen, but the whale
accumulation suggests smart money is betting on upside.

Dogecoin to the Moon? DOGE
Price Prediction Hints at Near-$0.50 Potential

Although
DOGE is currently capped by the 25-cent level, Fibonacci extensions indicate
several potential upside targets if the price breaks out from current
resistance and the July highs near 28 cents. A key zone is the 161.8 percent
extension at 42 cents, which aligns with this year’s peaks. The ultimate target
is 48 cents, nearly $0.50, corresponding to the highs from November and
December 2025.

Dogecoin price prediction after the bullish golden cross technical pattern. Source: Tradingview.com

Ali
Martinez projects
an 80% gain to $0.42 by September
, reflecting a technical breakout
potential

Dogecoin Price Prediction Table

Analyst /
Institution

Price
Target

Context /
Date

Ali
Martinez (@ali_charts)

$0.42 by
September 2025

Based on a bullish “double bottom”
technical pattern

Chapo
(crypto influencer)

$0.50 by
end of July 2025

Driven by strong momentum and
historical breakout behavior

XForceGlobal
(technical analyst)

$1.00 before end of bull cycle

Forecast tied to broader market
sentiment and meme-coin resurgence

Crypto
Patel
(via CoinGape)

$2.00

Based on accumulation zones and
rising DOGE ETF optimism

Javon
Marks
(crypto analyst)

$2.28

Forecast suggests potential 10×
rally based on cyclical patterns

Dogecoin News FAQ

Does Dogecoin Really Have
a Future?

Dogecoin’s
future depends on a mix of factors: market adoption, utility, community
support, and overall crypto market trends. While it started as a meme coin, it
has maintained a strong presence thanks to its active user base and frequent
mentions from high-profile figures like Elon Musk. If more businesses accept
DOGE as payment and blockchain upgrades improve its speed and cost efficiency,
it could remain a relevant cryptocurrency for years to come.

Will Dogecoin Reach $10?

A $10
Dogecoin would require an enormous market capitalization, making it a very
unlikely short-term target under current conditions. Such a price could only be
possible in an extremely bullish, global-scale crypto adoption scenario. Most
analysts see $10 as a distant possibility, not a realistic projection for the
next few years.

What Will Doge Be Worth in
2025?

Analyst
forecasts for Dogecoin in 2025 vary widely. Conservative predictions place it
between $0.30 and $0.50, driven by technical patterns and current adoption
rates. More aggressive forecasts, tied to market hype or major adoption
breakthroughs, see potential moves toward $1 or higher. The most likely range
in 2025, according to recent market sentiment, is around $0.40–$0.50.

Will Dogecoin Go up to $1?

Reaching $1
is a more realistic target than $10, and several analysts believe it could
happen in the next bull cycle if trading volumes and investor interest remain
strong. Breaking past key resistance levels (such as $0.25, $0.28, and $0.42) would
be crucial steps toward the $1 milestone. However, sustained growth would
require broader crypto market strength and ongoing investor confidence.

Source link

13 08, 2025

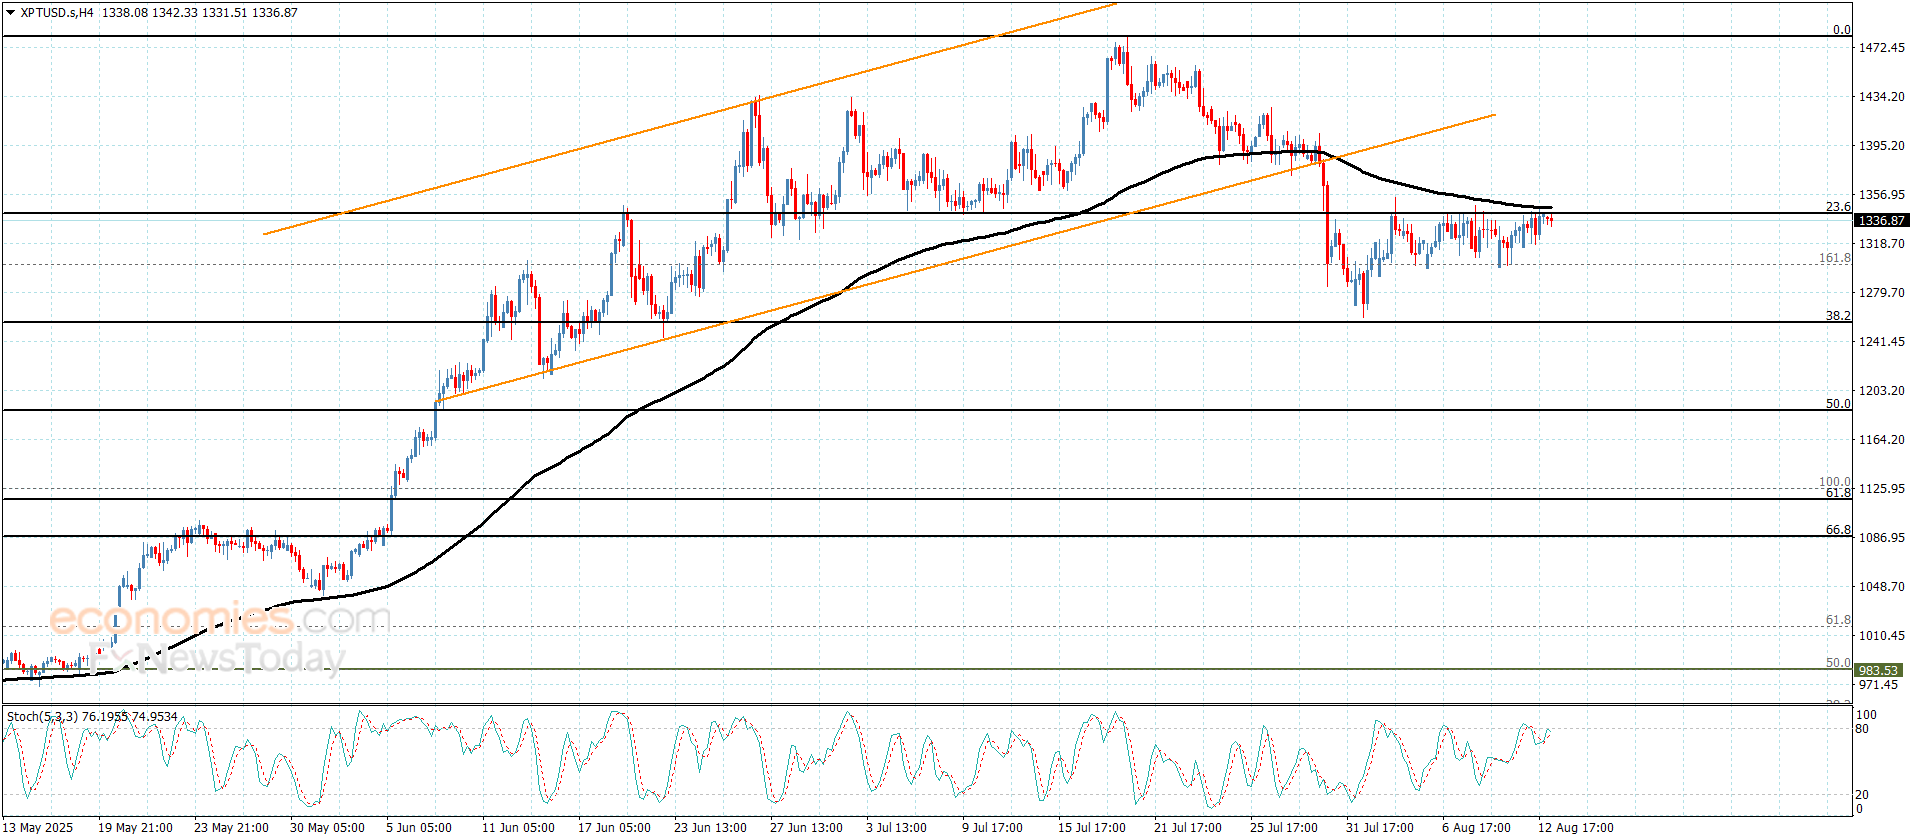
Platinum price repeats the pressure on the barrier– Forecast today – 13-8-2025

By |2025-08-13T10:51:21+03:00August 13, 2025|Forex News, News|0 Comments


Copper price began forming slow bullish waves after stochastic reach to oversold level, to announce surpassing the negative pressure, to keep its main stability within the bullish track, which depends on the stability of the support level at $4.0500.


The price success in gaining positive momentum will ease the mission of recording positive stations, to keep waiting for reaching $4.6300, then press on the barrier at $4.7400, to monitor its behavior due to the importance of this level to detect the expected trend in the upcoming trading.


The expected trading range for today is between $4.330 and $4.6300


Trend forecast: Bullish


Source link

13 08, 2025

CPI split, 94.2% Fed cut odds keep price range-bound [Video]

By |2025-08-13T10:45:50+03:00August 13, 2025|Forex News, News|0 Comments

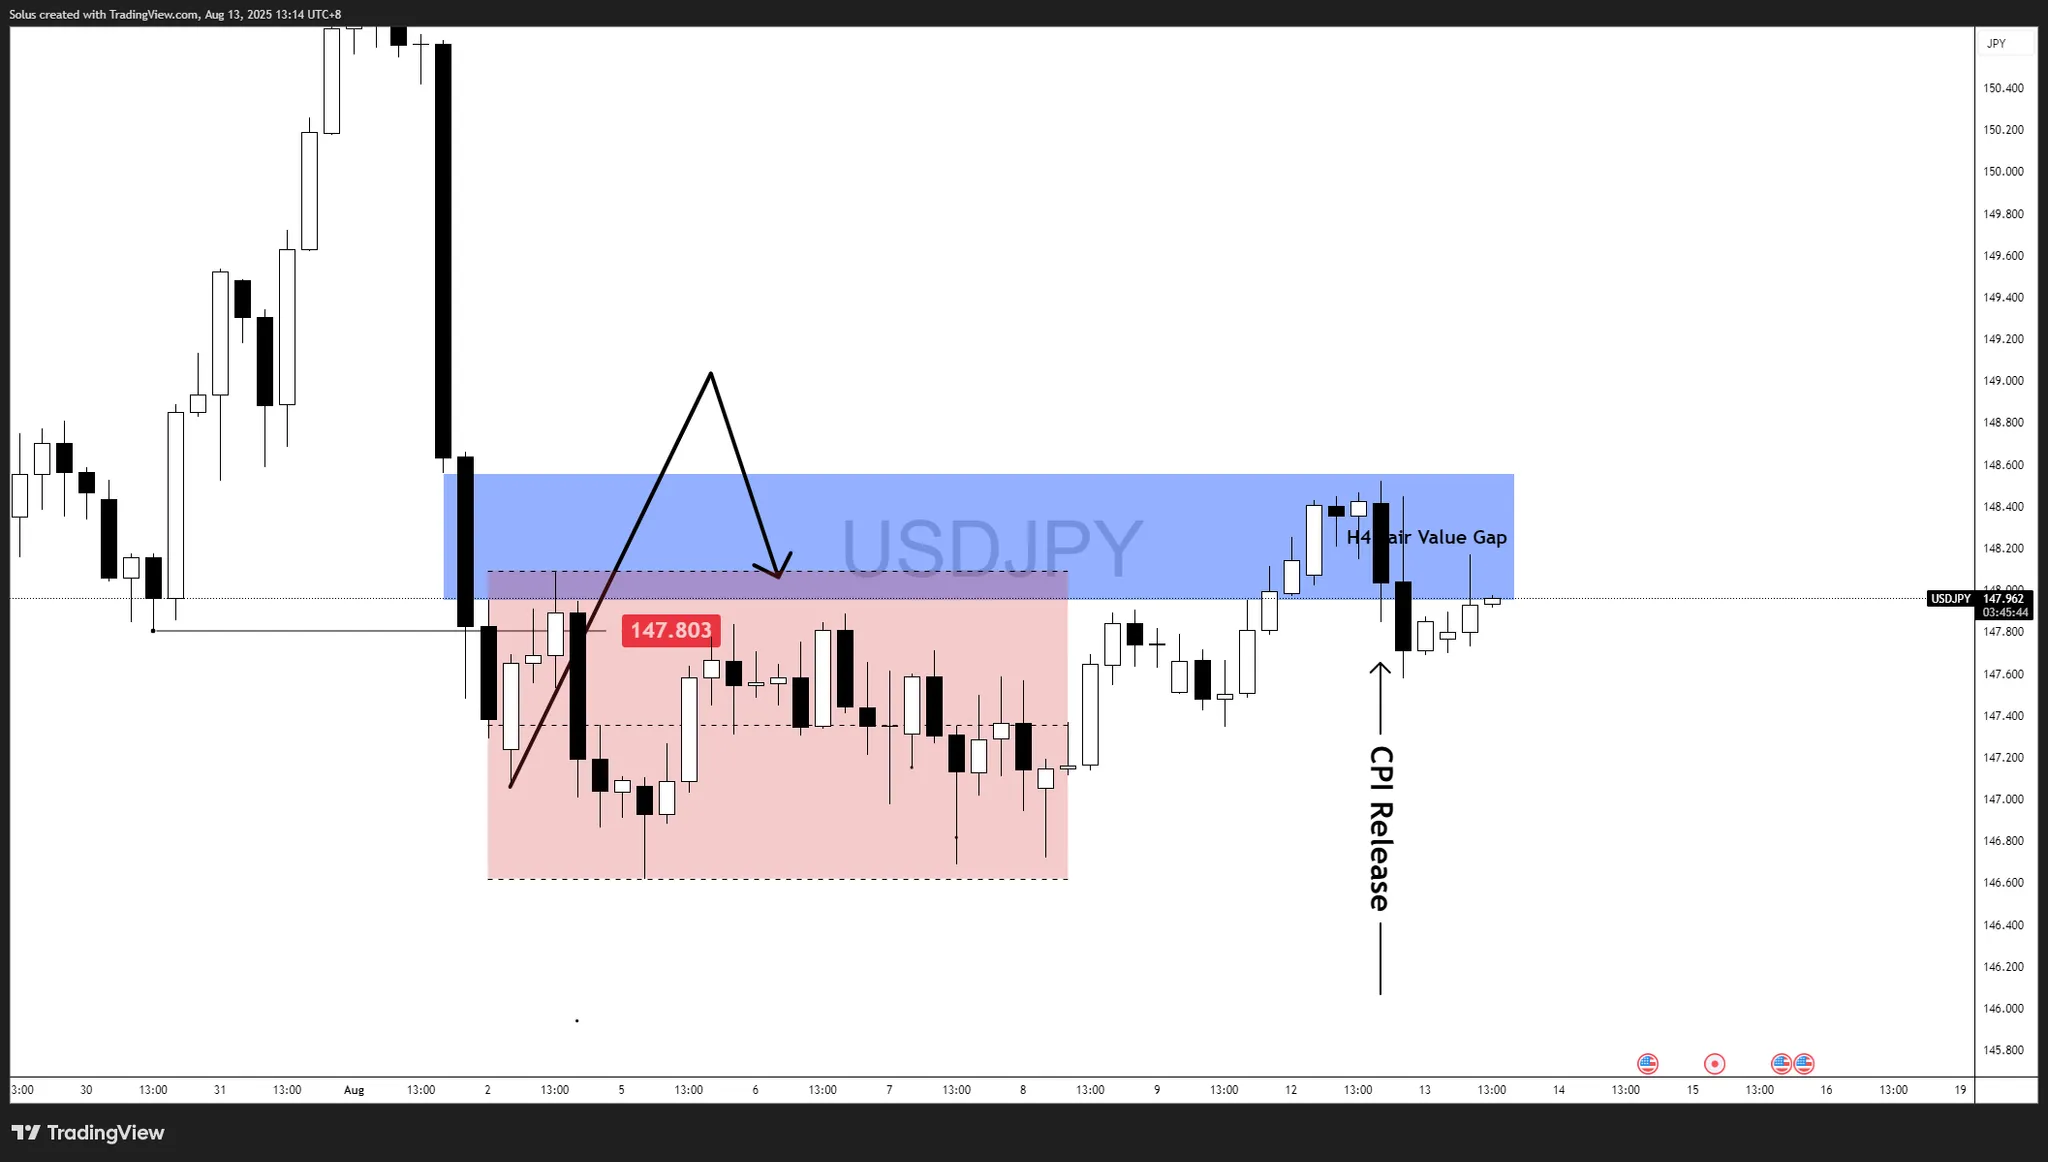
  • USD/JPY stalls below 148.50 as mixed U.S. CPI results keep price capped at the H4 Fair Value Gap.
  • Fed rate cut bets at 94.2% maintain short-term support, but upside is limited without a decisive breakout.
  • Technical bias split – breakout above 148.50 eyes 149.50, while rejection risks a slide toward 146.60.

Previous forecast recap (webinar)

In our last webinar, we highlighted 148.00–148.50 as the key rejection zone unless U.S. CPI delivered a strong dovish surprise. We noted that a failure at this level could open the path toward 146.50, targeting previous demand.

CPI results: Mixed message

On August 12, CPI data brought a split outcome:

  • Headline CPI YoY: 2.7% (vs 2.8% forecast) – Dovish.
  • Core CPI YoY: 3.1% (vs 3.0% forecast) – Hawkish.

The soft headline reinforced easing expectations, but the hotter core print kept the Fed from being fully locked into aggressive cuts, creating two-way volatility in USD/JPY.

Post-release price action

The pair rejected the 148.50 ceiling, confirming our pre-CPI bias. Price is now consolidating in the 148.50–147.50 range, awaiting a breakout trigger from further U.S. data or Fed commentary.

Rate cut probability – September FOMC

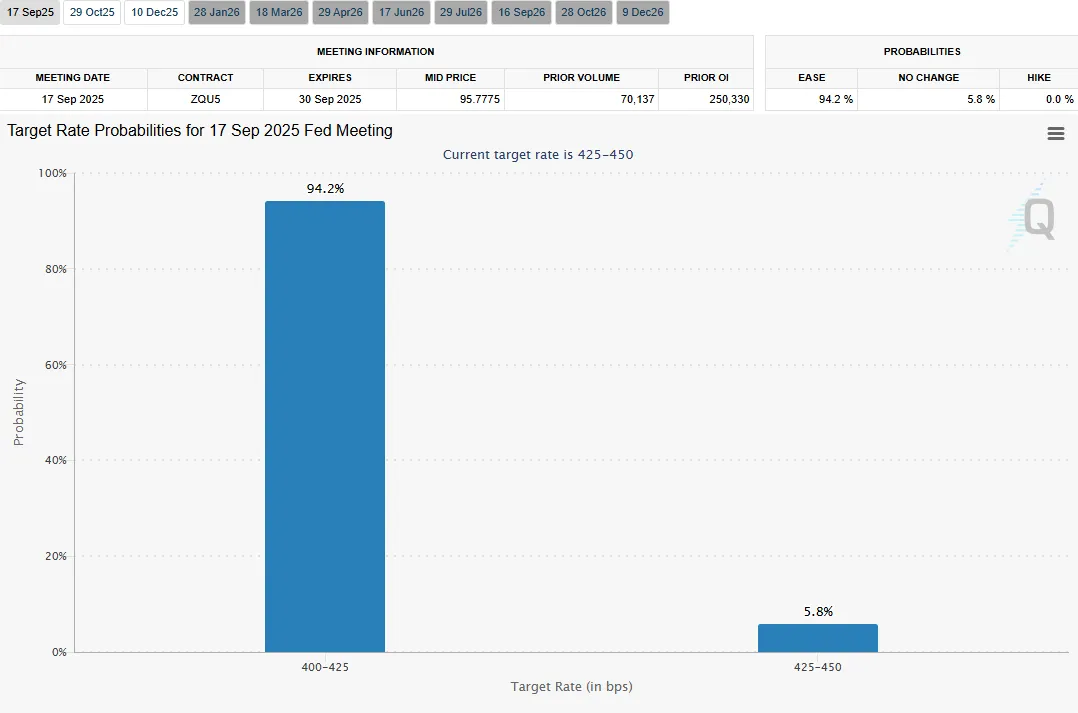
According to the CME FedWatch Tool following the CPI release:

  • 94.2% probability of a 25 bps rate cut (target range 4.00–4.25%).
  • 5.8% probability of no change.
  • 0% probability of a hike.

This strong consensus for easing keeps USD/JPY supported in the short term, but with the risk of dollar weakness if future data aligns with the softer headline CPI trend.

Technical outlook – USD/JPY post-CPI structure

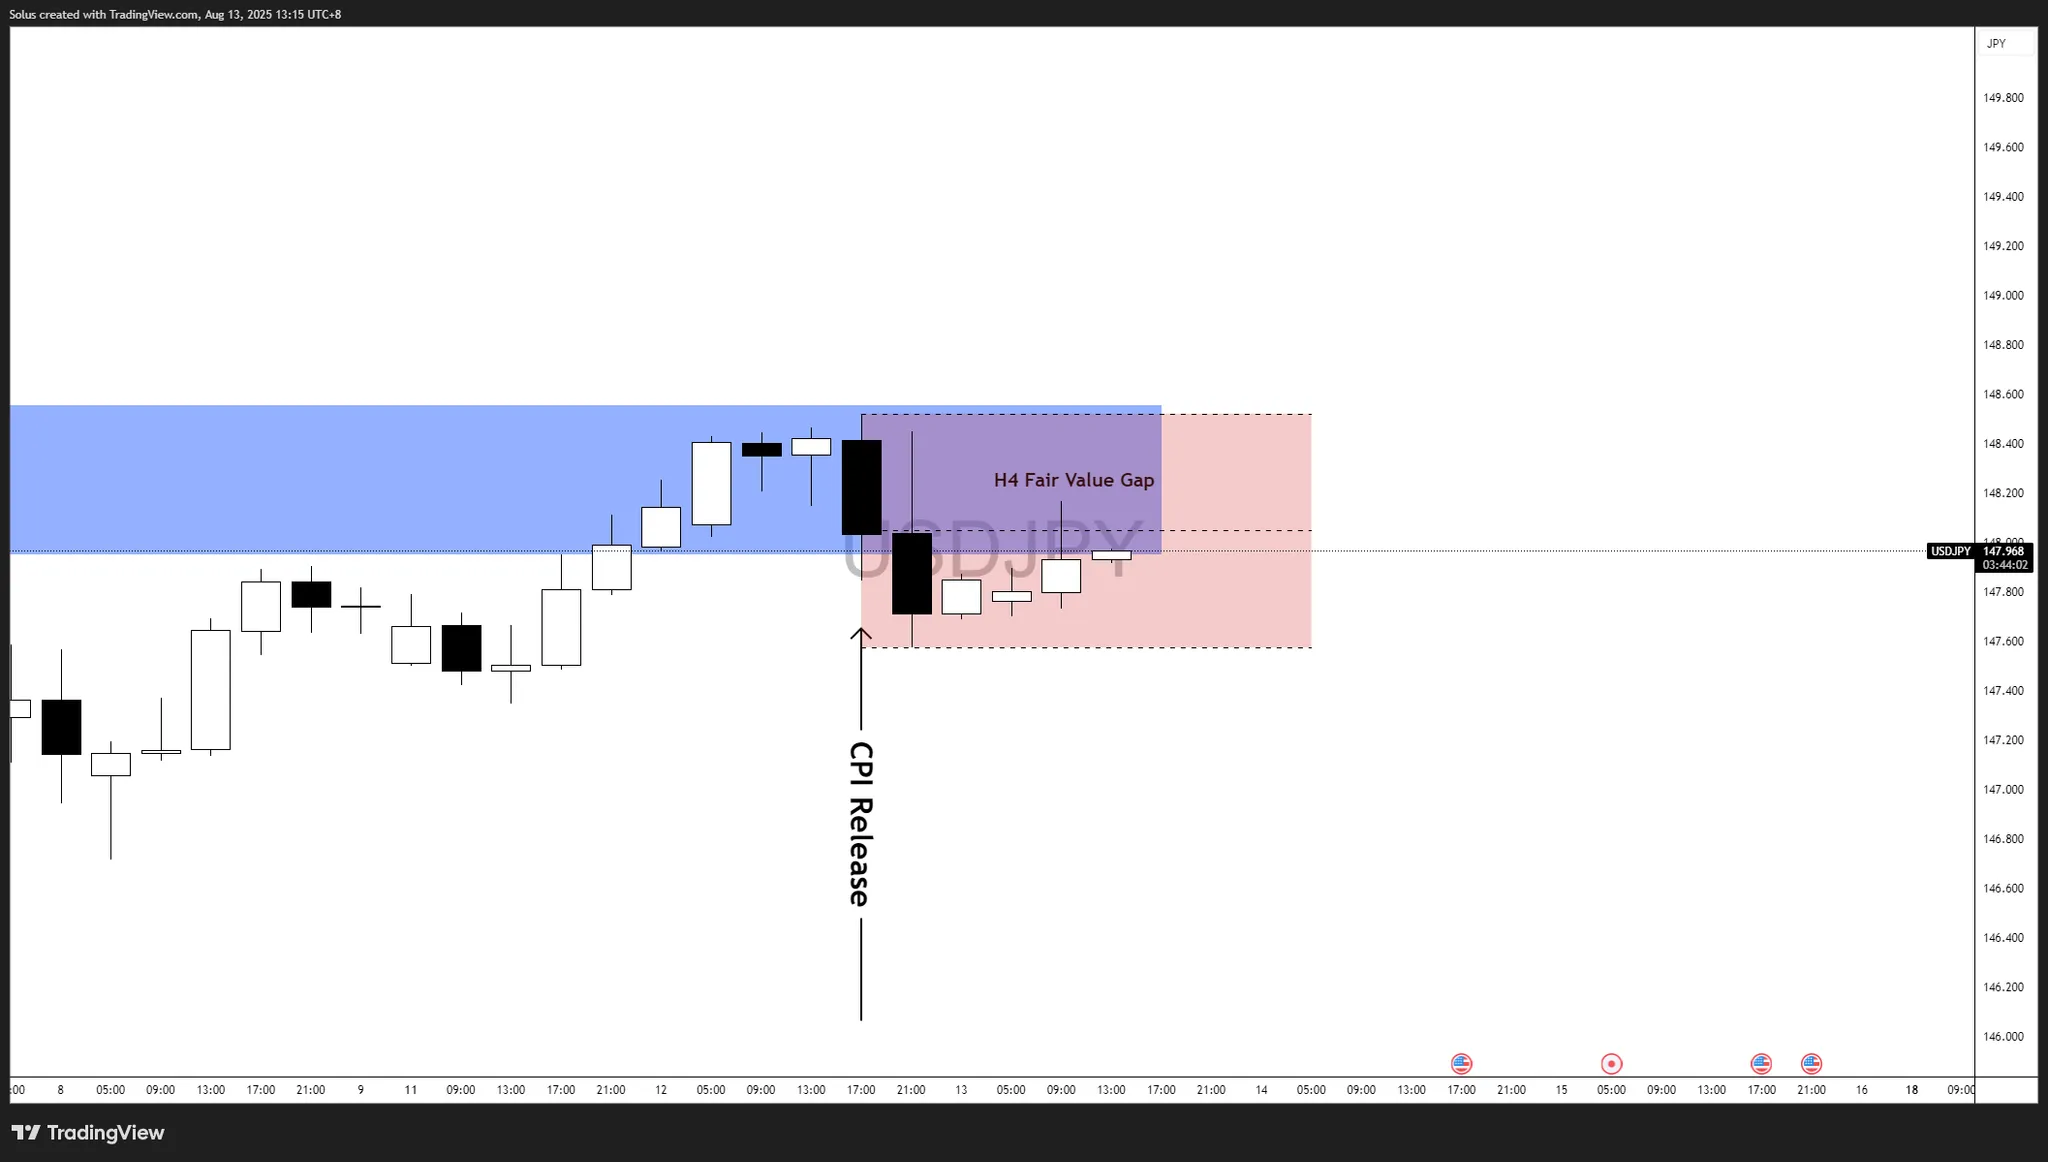
Following the CPI release, USD/JPY reacted with a sharp rejection from the H4 Fair Value Gap, aligning with the supply zone we outlined in the pre-event forecast.

  • Pre-CPI Build-Up: The pair climbed steadily into the bearish fair value gap, showing controlled bullish momentum ahead of the release.
  • Immediate Reaction: CPI data triggered a swift bearish impulse, driving price back lower from the H4 Fair Value Gap. This confirmed and aligned with the dovish or soft print of the CPI release, signaling, weakness on the dollar.
  • Post-CPI Consolidation: Price is now ranging just below the FVG ceiling, holding around 148.00–148.50, signaling indecision as the market weighs mixed inflation signals against high Fed cut expectations.

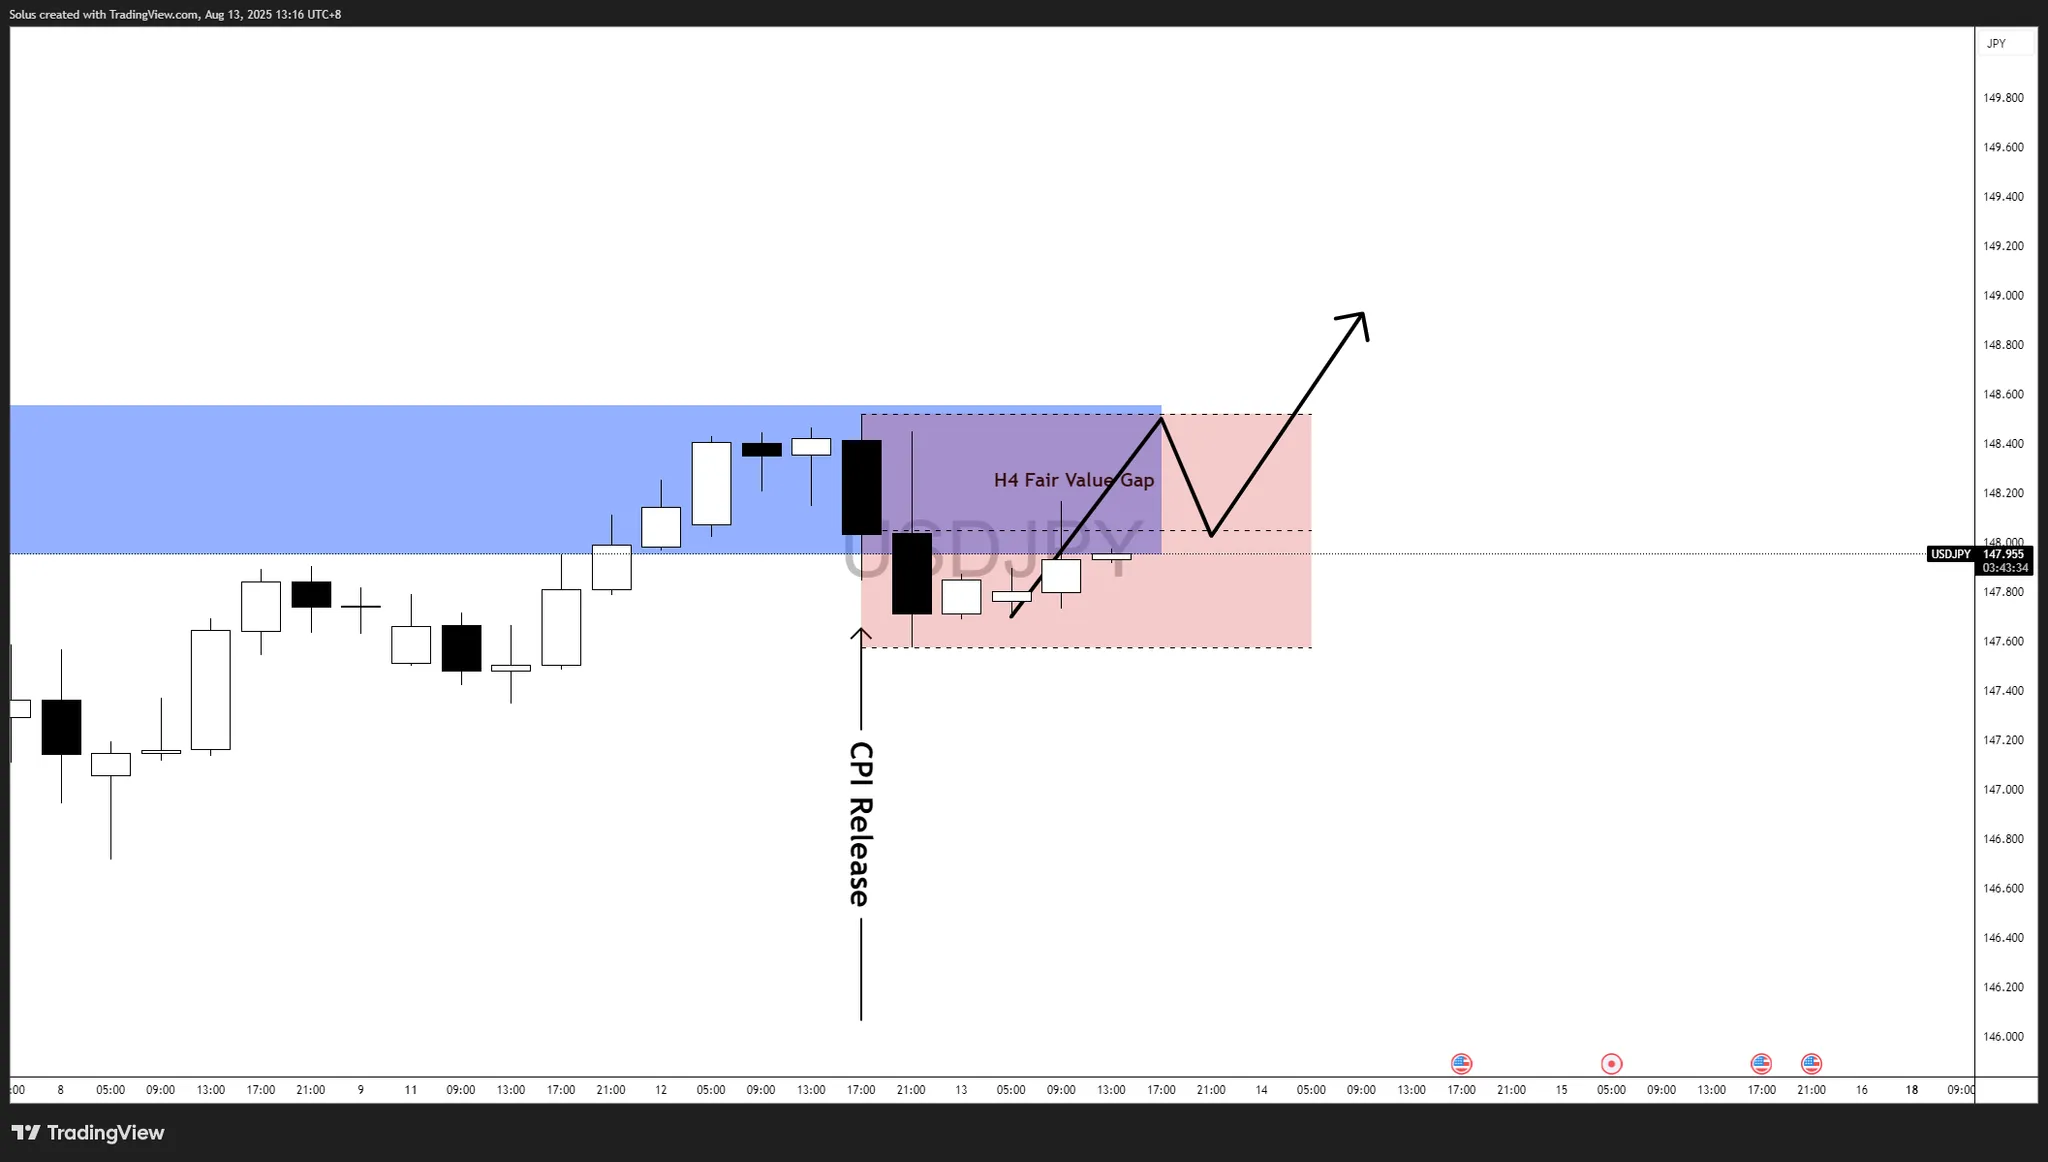
Bullish scenario – Range + FVG breakout

Following the CPI release, USD/JPY has been consolidating within the H4 Fair Value Gap after an initial downside reaction. The current structure suggests the potential for buyers to reassert control if price action follows through on a clean breakout.

Key bullish triggers:

  1. H4 FVG Reclaim – A decisive 4H close above 148.20 would confirm that buyers have gained traction, signaling renewed bullish intent.
  2. Pullback Retest Hold – After breaking above the FVG, a retest of 148.00-148.20 holding as new support would strengthen upside momentum.
  3. Continuation Pattern – Sustained higher lows following the retest would pave the way for a measured move higher.

Targets:

  • 1st Target: 148.80–149.00 – Psychological and short-term liquidity zone.
  • 2nd Target: 149.50 – Next liquidity pool before 150.00 round number.

Invalidation:

  • A rejection back below 148.50 and a close under 147.50 would weaken the bullish setup and put the bearish scenario back in play.

This bullish pathway aligns with the macro backdrop of a 94.2% Fed rate cut probability, which generally supports carry trade flows into USD/JPY. If risk sentiment remains steady and Japanese yields stay suppressed, buyers could leverage the current consolidation as a launchpad for a push toward the 149 handle.

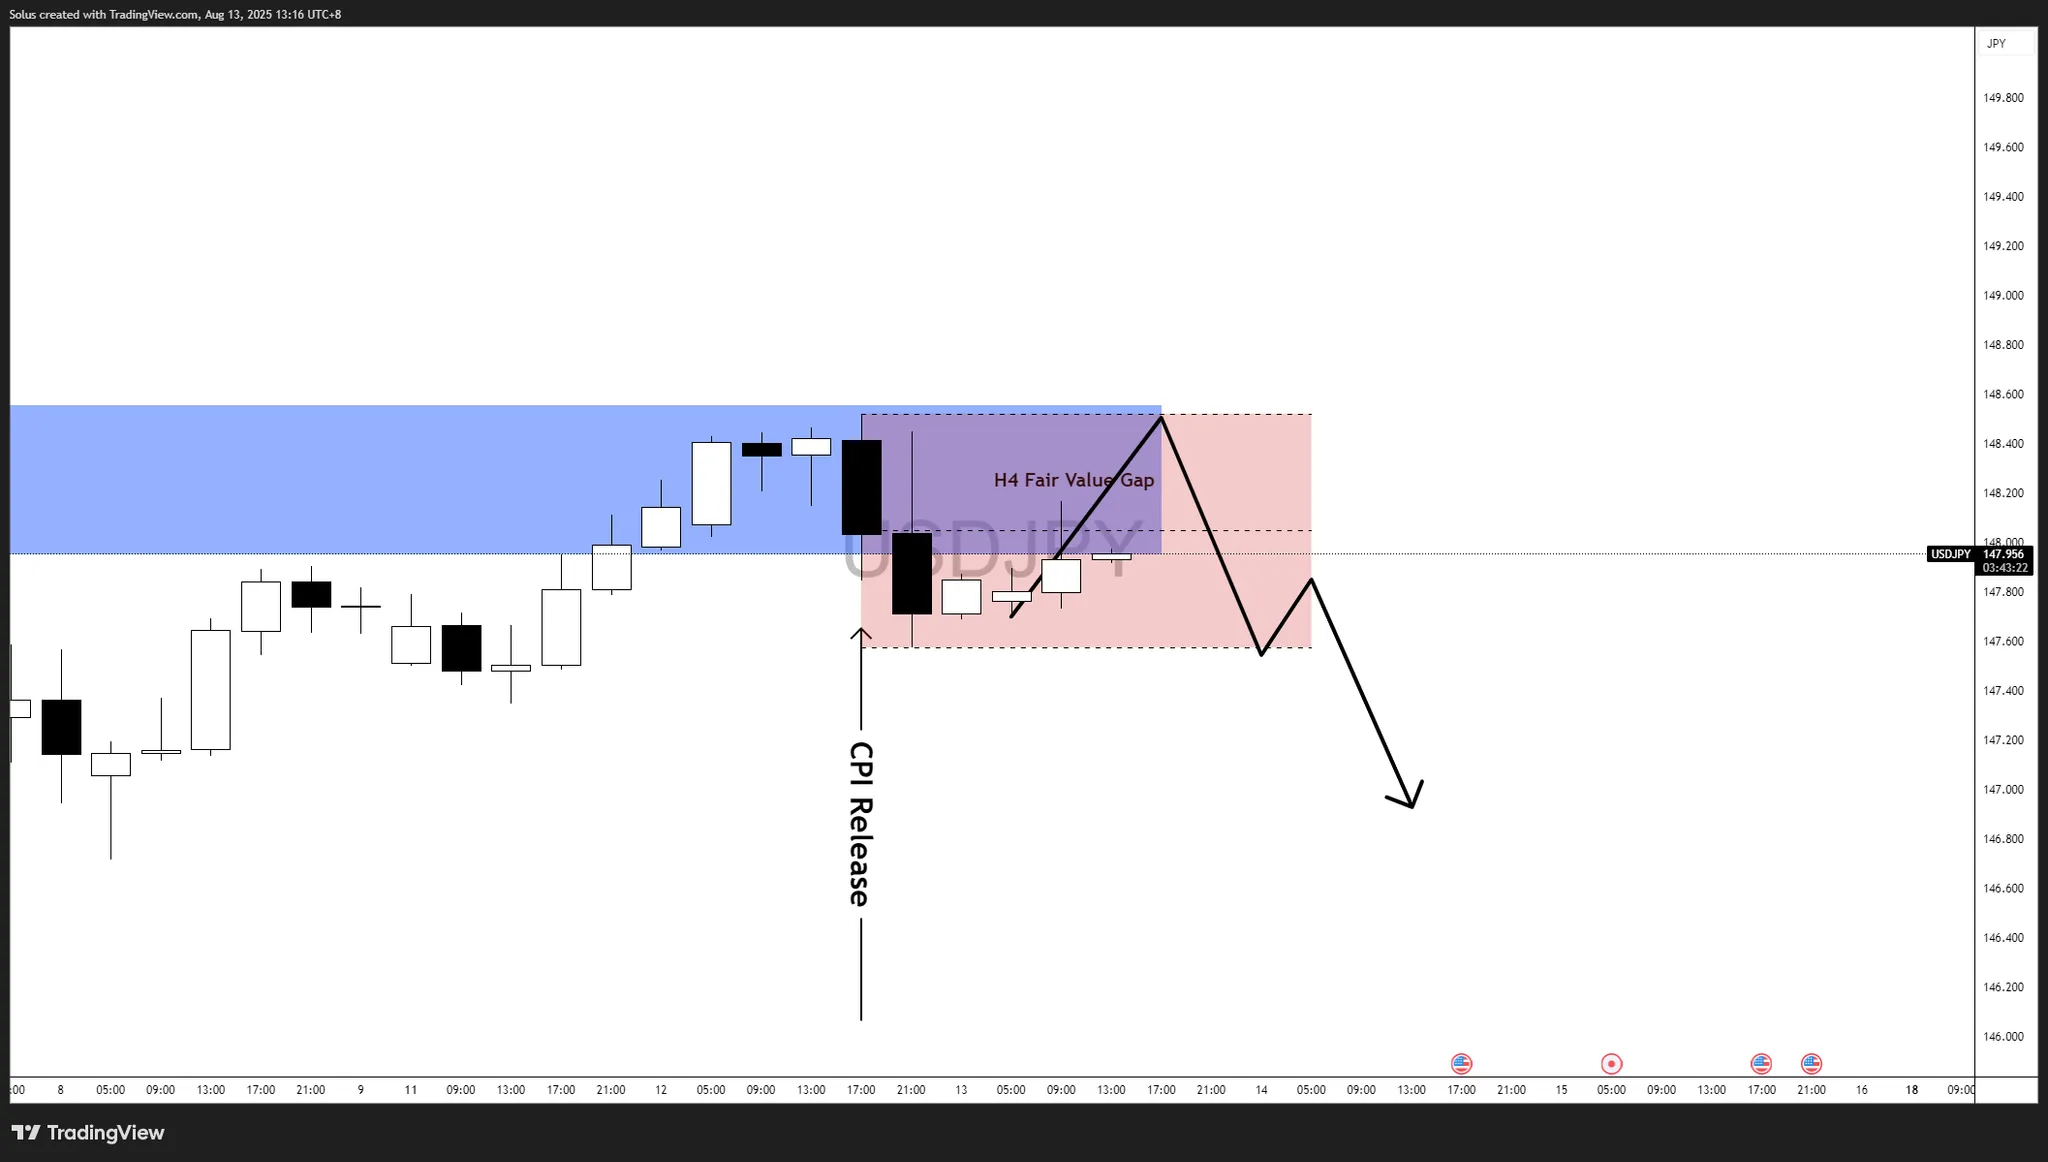
Bearish scenario – FVG resistance holds

Price remains capped within the H4 Fair Value Gap, showing signs of weakness. Sellers could regain control if price action respects this zone as a ceiling.

Key bearish triggers:

  1. Rejection at FVG – A failure to break and hold above 148.50, with strong rejection wicks or bearish engulfing candles, signals low traction in favor of the dollar.
  2. Break Below 147.50 – Losing this intraday support would confirm bearish momentum and invite further downside pressure.
  3. Continuation After Pullback – A retest of the bottom FVG (148.00) turning into resistance would reinforce short setups.

Targets:

  • 1st Target: 147.00 – Psych Level
  • 2nd Target: 146.60 – Deeper liquidity pool from previous accumulation.

Invalidation:

  • A clean 4H close above 148.20-148.50 would nullify this bearish bias and open the door for bullish continuation toward 149.00.

The rejection from the H4 Fair Value Gap aligns with the idea of distribution at premium pricing, particularly as the market digests mixed CPI signals. While a 94.2% Fed cut probability leans dovish for the USD in theory, if the yen strengthens on any BoJ commentary or risk-off sentiment, sellers could drive the pair into a deeper retracement phase.

Source link

13 08, 2025

Crude Oil Price Forecast: Bear Flag Trigger Awaits Further Confirmation

By |2025-08-13T08:49:57+03:00August 13, 2025|Forex News, News|0 Comments


20-Day Line Turned Down

Notice that the top of the flag shows resistance around the 200-Day MA (blue) and the 20-Day MA (purple). Plus, the 20-Day line has turned down recently and that follows an advance since May 28. It is also interesting to notice that a minimum 38.2% Fibonacci retracement was completed around the recent lower swing high at $69.98. Together, these signs of resistance are consistent with the formation of a bearish flag and simultaneous bull channel breakdown.

Flag Preceded by Sharp Selloff

Given the sharp descent that generated the pole portion of the bear flag, the bears will be fighting the bulls, as a large potential support zone is not much lower. When including the 50-Day MA, that zone would start around $65.74 to $64.50. The range begins with the 50-Day MA, is followed by the combination of an AVWAP level and the neckline of a double bottom pattern around $65.33 and finishes with the 61.8% Fibonacci retracement. Subsequently, a decisive decline below the 61.8% level will confirm a continuation of the bear flag breakdown.

Above Day’s High Could Lead to Bounce

Despite the bear trigger there needs to be follow-though to confirm. Notice that today’s range is very narrow and not what is generally anticipated on a solid breakdown. Traders should stay cautious as a rally above today’s high of $67.41 could lead to another test of resistance around 20-Day MA, now at $68.47, or another resistance level. Of course, that would keep crude oil within the flag consolidation pattern. On the upside, a decisive decline below today’s low of $66.50 triggers a continuation of the bear flag breakdown and opens the door to lower prices.

For a look at all of today’s economic events, check out our economic calendar.


Source link

Go to Top