About Editorial team of BIPNs

Main team of content of bipns.com. Any type of content should be approved by us.
12 08, 2025

Euro to Dollar Forecast: CPI Data, Fed Policy in Focus as EUR/USD Near 1.1650

By |2025-08-12T02:28:38+03:00August 12, 2025|Forex News, News|0 Comments


– Written by

Euro Consolidates Near 1.1650, US Inflation Data Key for Next Dollar Move

The Euro to Dollar (EUR/USD) exchange rate is trading around 1.1650 on Monday from an early high at 1.1675. Ranges are relatively narrow, but underlying tensions remain high, especially with geo-political developments also important with markets monitoring the Ukraine situation and US-China trade dialogue.

UoB commented; “The current price movements are likely part of a range trading phase, most likely between 1.1610 and 1.1670.”

According to ING; “A stronger-than-expected US core CPI this week could push EUR/USD below 1.160, but such a move may attract buyers seeking to capitalise on the Fed’s resumption of its easing cycle. We maintain our expectation that EUR/USD will break above 1.170 in the near term.”

The issue of Federal Reserve policy and independence will remain key market issues and the latest US inflation data will be key components.

Danske Bank commented; “Market focus has shifted from tariffs toward US data and Fed appointments, and tomorrow’s CPI – one of just two remaining before the September FOMC meeting.”

According to MUFG; “The main potential impediment to a rate cut as soon as at the next FOMC meeting in September would be a bigger than expected pick-up in US inflation over the summer. Market participants will be closely scrutinizing the release this week of the latest US CPI and PPI reports for July for further evidence of higher tariffs feeding through to a pick-up in inflation pressures.”



Consensus forecasts are for the headline inflation rate to edge higher to 2.8% from 2.7% with a 0.3% increase in core prices which would lead to a slight increase in the year-on-year rate to 3.0% from 2.9%.

MUFG added; “A significant upside inflation surprise could trigger a reversal of the current US dollar weakening trend.”

Over the weekend, Fed Governor Bowman stated that she would be backing rate cuts at all the remaining three Fed meetings this year.

There are still important reservations surrounding the potential politicising of key economic agencies.

According to sources, the administration is interviewing candidates to lead the Bureau of Labor Statistics (BLS), including E.J. Antoni, chief economist at the Heritage Foundation.

Antoni posted over the weekend; “There are better ways to collect, process, and disseminate data—that is the task for the next BLS commissioner, and only consistent delivery of accurate data in a timely manner will rebuild the trust that has been lost over the last several years.”

On the Euro side, ING is not convinced that the market call for no further ECB rate cuts is realistic.



Nevertheless, it added; “we regard any potential dovish repricing as a temporary setback within a broader trend of euro strength supported by a structurally weaker dollar.”

The latest CoT data, released by the CFTC recorded a small decline in long, non-commercial Euro positions, but the number remains elevated in historic terms, limiting the scope for further buying.

Like this piece? Please share with your friends and colleagues:


International Money Transfer? Ask our resident FX expert a money transfer question or try John’s new, free, no-obligation personal service! ,where he helps every step of the way,
ensuring you get the best exchange rates on your currency requirements.

TAGS: Euro Dollar Forecasts

Source link

12 08, 2025

XRP (XRP) Price Prediction for August 12

By |2025-08-12T02:16:52+03:00August 12, 2025|Crypto News, News|0 Comments

The XRP price today is $3.277 after a steady rebound from last week’s pullback off the $3.6656 peak. On the daily Smart Money Concepts view, $3.6656 is marked as a weak high with liquidity parked above it. Price found a firm bid at $3.0933, the point where the 4 hour Supertrend flipped bullish, and it continues to trade above the $3.09 demand zone that formed during July’s breakout.

XRP price dynamics (Source: TradingView)

Structure on the daily chart still leans bullish after the Break of Structure above $2.60 that launched the July run toward $3.72. The next major upside liquidity draw sits at $3.4650, which lines up with the 0.786 Fibonacci retracement on the 4 hour chart.

XRP Price Forecast Table: August 12, 2025

Indicator/Zone Level / Signal
Current price $3.277
Resistance 1 $3.3075 (0.618 Fib)
Resistance 2 $3.4650 (0.786 Fib)
Stretch target $3.6656 (weak high liquidity)
Support 1 $3.1960 (0.5 Fib)
Support 2 $3.0933 (Supertrend support)
EMA20 / EMA50 / EMA100 / EMA200 (4H) $3.2196 / $3.1566 / $3.1155 / $2.9973
Keltner Channel upper / mid / lower (4H) $3.3508 / $3.2196 / $3.0884
VWAP (30 min) $3.2722
Supertrend (4H) Bullish above $3.0933
Spot netflow (Aug 11) +$40.42M
Key dema…

The post XRP (XRP) Price Prediction for August 12 appeared first on Coin Edition.

Source link

12 08, 2025

Ethereum Surges 80% on Circle IPO, DeFi Growth and Whale Activity

By |2025-08-12T00:32:54+03:00August 12, 2025|News, NFT News|0 Comments


Ethereum has experienced a significant 80% surge in value since early June 2025, rekindling widespread interest from both institutional and retail investors in the broader cryptocurrency market [1]. The rally has been driven by a combination of factors, including the successful IPO of Circle, Ethereum’s dominance in the stablecoin market, and the growing adoption of decentralized finance (DeFi) platforms. As Ethereum prices briefly exceeded $4,350, reaching a near-four-year high, the momentum has spilled over into the broader blockchain ecosystem, with altcoin activity intensifying [1].

One of the most notable indicators of the network’s resurgence is the movement of $10 million worth of Ethereum from a wallet linked to the 2014 Genesis sale — the network’s earliest days — marking its first large-scale transaction in almost a decade [2]. This move coincided with Ethereum breaking out of a long-term chart pattern, a technical sign frequently associated with the onset of a major price uptrend. Some traders have already projected price targets as high as $15,000, implying that the asset could potentially triple in value if the current trajectory holds [2].

The increased activity among large holders, or “whales,” has further highlighted a shift in market sentiment. Over $16 million in ETH has been moved to exchanges like Kraken, indicating a growing preference for Ethereum over Bitcoin in speculative and capital rotation strategies [2]. This trend is being interpreted as the early stages of an “altcoin season,” a market phase where smaller-cap cryptocurrencies tend to outperform.

Institutional interest in Ethereum is also deepening, with firms incorporating the asset into their treasuries and exploring staking and on-chain investment strategies. BlackRock, for instance, has proposed a spot Ethereum ETF with a staking component, potentially offering yields near 3%, which could attract new institutional capital into the ecosystem [1]. At the same time, exchanges such as Coinbase and Robinhood are expanding their Ethereum-related services, including staking options and Layer 2 solutions that improve scalability and reduce costs for developers and users [1].

Meanwhile, the supply of ETH on exchanges has been shrinking, a trend historically associated with upward price pressure as demand increases. Analysts such as Ali Martinez have highlighted that the MVRV (Market Value to Realized Value) ratio remains below the levels typically observed before major market tops, suggesting the current rally may still be in its middle phase [2]. However, some caution against short-term volatility, noting that high leverage in derivatives markets and strong technical resistance levels could act as temporary headwinds [2].

Ethereum’s resurgence is not just a story of price movement but a catalyst for broader economic and structural shifts within the crypto industry. The development of Ethereum treasury strategies — where companies accumulate, stake, and deploy ETH for income — reflects a more sophisticated and integrated approach to blockchain asset management [1]. Unlike ETFs, these strategies allow businesses to adapt their tactics in response to market cycles, though they require careful risk management.

The broader market is closely watching as Ethereum approaches key technical levels, particularly $4,800, which several analysts have identified as a potential breakout point [3]. While the movement of capital and favorable technical indicators suggest Ethereum may still have room to rise, the path forward is expected to remain volatile and complex.

Source:

[1] Ethereum’s 80% Rally Sets Off Wave of Corporate and Investor Interest

[2] Ethereum Whale Moves $10M After a Decade of Silence

[3] Next Ethereum Rally Could Push ETH Beyond $4800, ADA

https://www.mitrade.com/au/insights/news/live-news/article-3-1026110-20250809


Source link

12 08, 2025

How To Fix The Bitter Taste In Green Tea For Good

By |2025-08-12T00:24:47+03:00August 12, 2025|Dietary Supplements News, News|0 Comments


Green tea is supposed to have an earthy, subtly floral flavor and a calming effect. So, when you brew an overly bitter cup, it can leave you feeling pretty bitter as well. If your tea is consistently turning out unpleasant, you’re probably wondering how to brew a better batch — and soon. That’s why Chowhound turned to expert Elle Liu, founder of tea brand THEORÓ, for answers.

Liu explained that the bitter flavor in your cup could be traced back to three main categories: “the tea leaf itself, how it’s crafted, and how it’s brewed.” Good-quality green tea will be rich in amino acids, which Liu says “add umami and sweetness” and balance out the bitterness of its other chemical components. Factors like origin, cultivar, tree age, and harvest date also play a major role in determining this quality. “Go for single-origin tea,” Liu said. “Ideally, it should be the first pluck of the year and from the spring harvest. The origin should be a mountainous, misty area.”

Next, when it comes to brewing non-bitter tea, temperature control is everything. “Every tea has an ideal water temperature and steeping time,” Liu explained. She recommends brewing green tea using the gongfu method, a Chinese practice that involves a high leaf-to-water ratio and multiple infusions, with a water temperature of 190 degrees Fahrenheit and about 3.6 grams of tea for every ½ cup of water. “Steeping should be short — between 10 to 30 seconds, depending on the number of infusions,” she said.

Why green tea is prone to bitterness

To understand why green tea often tastes unpleasantly bitter, it’s important to understand its chemical makeup. All “true tea” comes from the leaves of the Camellia sinensis plant, Elle Liu explained, which contains three primary components: tea polyphenols, caffeine, and amino acids. While amino acids add sweetness and depth of flavor, “tea polyphenols and caffeine contribute to astringency and bitterness,” she said. That’s also why the only true “caffeine-free tea” isn’t even technically tea.

Since all tea comes from the same plant, each type is distinguished by its processing, including the degree of oxidation. “Freshly made green tea retains close to 100% of its polyphenol content, while black tea retains only about 10% to 20%,” Liu said. “This explains why green tea tends to taste more bitter.” That said, tea harvested early in the spring season from high-elevation areas and consumed fresh should have a balanced ratio of the three components.

Green tea can also taste bitter due to craft errors. Generally, green tea production involves three steps: fixation, rolling, and drying. “Each of these steps requires great skill,” Liu explained. “Any misstep — like over-fixation or under-fixation — can negatively affect the flavor.” But it’s not all about buying better tea, as a poor brewing technique is another common reason for bitterness. “When tea is over-steeped or brewed at a temperature that’s too high, it extracts excess polyphenols and caffeine, resulting in a bitter brew,” Liu said.


Source link

12 08, 2025

Solana Price Prediction: Can SOL Smash the $200 Barrier and Rally Towards $400?

By |2025-08-12T00:16:03+03:00August 12, 2025|Crypto News, News|0 Comments

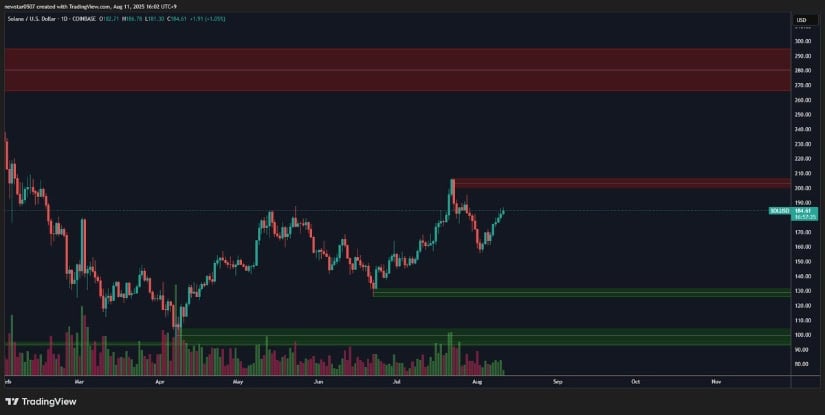
Solana is approaching a critical breakout zone near $200, with key technicals and on-chain signals hinting at a potential rally towards the $350 to $400 range.

Momentum is building on multiple fronts for Solana, with a short liquidation cluster near $190, a key sell wall at $200, and thin on-chain resistance above $189 all converging to create a potential “domino effect” for price movement.

Solana Price Prediction Could Unlock 350 to 400 Targets

Solana is pressing against the upper boundary of a multi-month consolidation zone between 120 and 186, an area that has repeatedly acted as a ceiling for price action. Analyst cardzz notes that a decisive move above 186 could clear the way towards the 350 to 400 range, with this target aligning closely with the upper channel resistance on the weekly chart. The broader structure remains constructive, with higher lows forming above the bull market support band, which ranges from 154 to 163, signaling that buyers continue to defend key trend levels.

Solana holds firm above key support, eyeing a breakout that could unlock targets between $350 and $400. Source: Cardzz via X

A confirmed breakout could trigger a measured move based on the consolidation’s height, with interim resistance likely around 286 before higher objectives come into view. While price may still oscillate within the range in the short term, the sustained defense of the support band keeps the longer-term bias tilted toward bullish continuation.

Sell Wall Test at 200 Could Shape Solana’s Next Move

The $200 level is shaping up as the next significant hurdle for Solana, with the sell wall marked on the chart. This area has previously served as a liquidity pocket, where selling interest intensifies, meaning a strong influx of buying pressure would be required to break through. Price is currently climbing from a higher low, suggesting bulls are attempting another push toward this resistance zone, but the reaction at $200 will be critical in determining the next directional move.

Solana Price Prediction: Can SOL Smash the 0 Barrier and Rally Towards 0?

Solana approaches the $200 sell wall, with bulls aiming to break past a key liquidity pocket that could set the stage for higher targets. Source: CW8900 via X

Volume remains steady but not yet at the kind of expansion levels that typically accompany a decisive breakout. If the approach toward $200 is accompanied by rising volume and a solid candle close above, it could open the door for a continuation towards higher resistance levels.

Solana Has a Major Short Liquidation Cluster Near 190

Fresh liquidity heatmap data reveals a concentrated short liquidation zone just above current levels, with roughly $97 million in positions at risk if Solana rises by around $5. This cluster sits near the 190 mark, creating a potential trigger point for panic short-coverings. In the context of the recent push toward the $200 sell wall, this zone becomes an important stepping stone that may fuel momentum if breached.

Solana Has a Major Short Liquidation Cluster Near 190

Solana nears a $97 million short liquidation cluster at $190. Source: CW8900 via X

The setup aligns with the broader bullish structure outlined earlier, where higher lows and sustained support above 154 to 163 have kept the macro trend constructive. If buyers manage to drive price through this liquidation band with conviction, the resulting momentum could reduce overhead pressure heading into the 200 zone, setting up a cleaner shot at higher objectives.

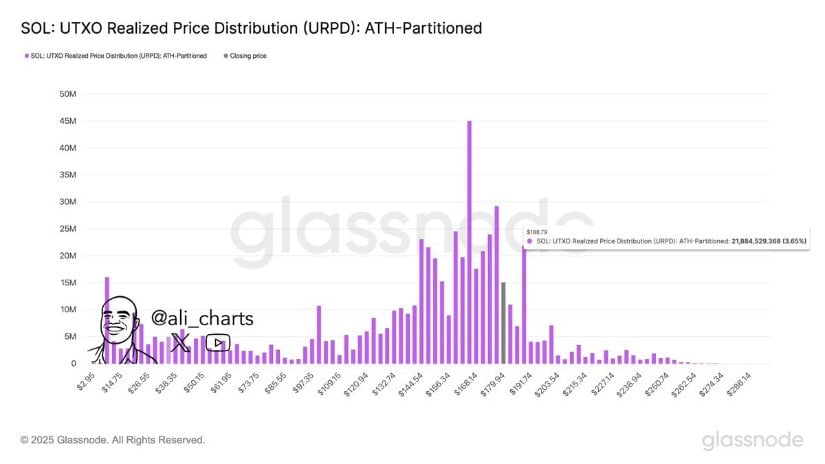
Glassnode Data Reveals Low Resistance Above 189 for Solana

On-chain data from Glassnode highlights a thin supply zone above $189, where realized price distribution shows limited historical volume. Famous crypto analyst Ali Martinez notes that this creates an “air pocket”, meaning once SOL clears this level, there are fewer entrenched holders likely to sell into strength.

Glassnode Data Reveals Low Resistance Above 189 for Solana

Data shows thin supply above $189 for Solana, with an analyst noting this “air pocket” could speed up a breakout toward prior highs. Source: Ali Martinez via X

This lack of overhead supply often allows prices to move more freely, particularly when momentum is already building from key breakout points such as the recently tested 186 level.

The on-chain structure ties directly into the technical setup from recent sessions, where higher lows and the $190 short liquidation cluster have aligned with the $200 sell wall as immediate hurdles. If bulls manage to sustain a close above $189 to $190, the combination of thin on-chain resistance and liquidation-driven buying pressure could provide the push needed to challenge, and potentially surpass, prior highs without significant congestion along the way.

Solana Fractal Mirrors Previous Breakout Structures

Analyst GalaxyBTC points out a recurring fractal on Solana’s higher-timeframe chart, where price action appears to be following a similar structure to past breakout phases. The current formation shows a tightening range within an ascending channel, echoing the consolidation seen before its last major rally. With support holding on the lower trendline and momentum building, this fractal comparison adds weight to the broader bullish Solana price prediction.

Solana Fractal Mirrors Previous Breakout Structures

Chart highlights a recurring fractal on Solana, mirroring past breakout phases within an ascending channel. Source: GalaxyBTC via X

Final Thoughts

Solana’s setup is one of the more compelling in the current market, with technicals, on-chain data, and market structure all hinting at a bigger move. Clearing the $200 sell wall would not only confirm strength but could also unleash the $97 million short liquidation cluster near $190, fueling rapid upside momentum. If this level breaks with strong volume, the thin supply zone above $189 could allow the price to run faster than many anticipate, possibly bringing the $286 and even the $350 to $400 range into view.


Source link

12 08, 2025

Navigating Health Insurance for Nasal Polyps

By |2025-08-12T00:11:43+03:00August 12, 2025|Fitness News, News|0 Comments


Deb Gordon

Deborah D. Gordon has spent her career trying to level the playing field for healthcare consumers. She is co-founder of Umbra Health Advocacy, a marketplace for patient advocacy services, and co-director of the Alliance of Professional Health Advocates, the premiere membership organization for independent advocates. She is the author of “The Health Care Consumer’s Manifesto: How to Get the Most for Your Money,” based on consumer research she conducted as a senior fellow in the Harvard Kennedy School’s Mossavar-Rahmani Center for Business and Government. Deb previously spent more than two decades in healthcare leadership roles, including chief marketing officer for a Massachusetts health plan and CEO of a health technology company. Deb is an Aspen Institute Health Innovators Fellow, an Eisenhower Fellow and a Boston Business Journal 40-under-40 honoree. Her contributions have appeared in JAMA Network Open, the Harvard Business Review blog, USA Today, RealClear Politics, The Hill and Managed Care Magazine. She earned a BA in bioethics from Brown University and an MBA with distinction from Harvard Business School.

Full Bio


Source link

11 08, 2025

NFT Market Surges 20% to $165M as Ethereum and BNB Chain Lead Growth

By |2025-08-11T22:31:41+03:00August 11, 2025|News, NFT News|0 Comments


The non-fungible token (NFT) market experienced a notable rise in trading sales during the first week of August 2025, with total global sales reaching $165 million, marking a 20% increase compared to the previous week [1]. This surge reflects a broader uptrend in digital asset adoption, driven by heightened interest in digital art, gaming, and the increasing involvement of major brands and platforms in the NFT space. The growth in the NFT market also appears to be supported by a rising confidence in blockchain technology and digital ownership, particularly in regions experiencing rapid NFT market development [1].

Ethereum led the NFT trading volume among blockchain networks, with Ethereum-based NFTs generating over $85 million in sales during the past seven days. This figure represents a 29% increase compared to the previous week, reinforcing Ethereum’s position as a foundational platform for NFTs [1]. Polygon, an Ethereum layer-2 solution, followed closely, with Polygon-based NFTs achieving $16 million in trading volume—a 16% increase from the prior week. BNB Chain, known for its fast and cost-efficient transactions, saw a significant 45% surge in NFT sales, with its collections generating $15 million in the same period [1].

Bitcoin also made an impression in the NFT market, particularly through its Runes, BRC-20, and Ordinal collections. Bitcoin-based NFTs recorded $14 million in trading volume, showing a 6.06% increase week-over-week. This reflects an emerging trend of NFT activity on Bitcoin, a network traditionally less associated with NFTs compared to Ethereum or Polygon [1].

Among the top-performing NFT collections, CryptoPunks remained the most traded, with a 11% increase in trading volume compared to the previous week [1]. Courtyard, a generative NFT collection on Polygon, recorded $14 million in sales, reflecting a 22% surge. The Bored Ape Yacht Club and Pudgy Penguins, both hosted on Ethereum, saw $5.9 million and $5.9 million in sales respectively, with the latter experiencing a 28% increase. A new entrant, SpinNFTBox on BNB Chain, closed the top five with $5.8 million in sales [1].

Industry analysts have forecast continued momentum in the NFT market, suggesting that the convergence of infrastructure improvements, practical use cases, and growing adoption may lead to a significant bull run before the end of the year [1]. While these forecasts remain speculative, the current data supports the view that the NFT market is on a positive trajectory, with multiple blockchain networks and NFT collections contributing to the growth.

Source:

[1] InsideBitcoins – NFTs Weekly Trading Sales Surge +20% To $165M

https://coinmarketcap.com/community/articles/689a263a14fafa6f2d11d3fc/


Source link

11 08, 2025

Hovers Near 50 Day EMA (Chart)

By |2025-08-11T22:27:17+03:00August 11, 2025|Forex News, News|0 Comments

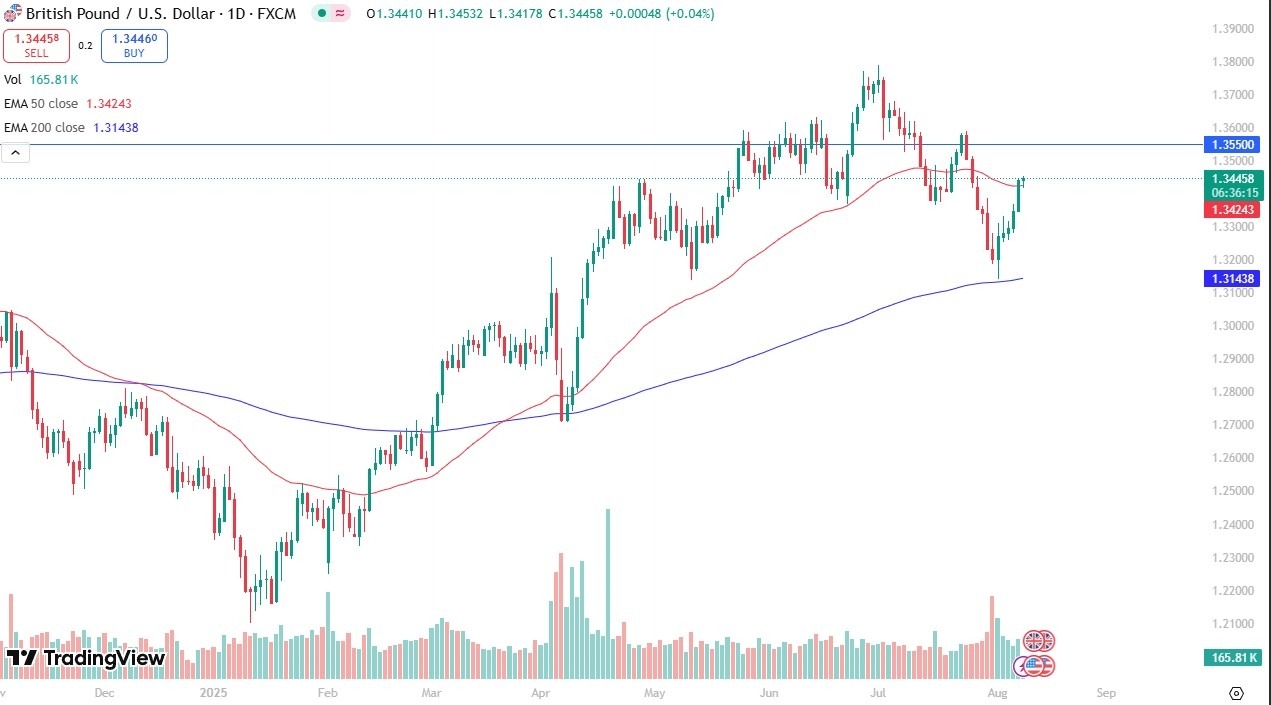
  • The British pound has been slightly positive during the trading session on Friday, after we initially fell toward the 50 Day EMA.
  • The 50 Day EMA is an indicator that a lot of people are watching most of the time, as we continue to see it act as dynamic support and resistance.
  • It is probably worth noting that we have turned around to show signs of bullish behavior, and if we can break above the current area, we could go as high as 1.3550, an area that’s been important multiple times.

It is also worth noting that 5 or 6 candles ago on the daily chart, we had tested the 200 Day EMA, only to turn around and bounce rather significantly. With that being the case, the market is likely to continue to see quite a bit of buying on the dips, but the question at this point now is going to be whether or not we can find any momentum? After all, we need momentum to finally break out to the upside again, after that initial drop over the last couple of weeks.

Technical Analysis

Now that we are just above the 50 Day EMA, it does suggest that the market could go looking to the 1.3550 level, an area that has been important more than once. With that being the case, I think you’ve got a situation where if we can break above there, then the buyers will probably jump into the market with quite a bit more gusto. On the other hand, if we break down below the 1.33 level, then it could open up the possibility of a move down to the 200 Day EMA, currently residing at the 1.3143 level. Anything below there would obviously be very negative, but I think what it is worth noting is that we have recently made a “lower low”, so now the question is will we make a “lower high?”

Ready to trade our GBP/USD daily forecast? We’ve shortlisted the best regulated forex brokers UK in the industry for you.

Christopher Lewis has been trading Forex and has over 20 years experience in financial markets. Chris has been a regular contributor to Daily Forex since the early days of the site. He writes about Forex for several online publications, including FX Empire, Investing.com, and his own site, aptly named The Trader Guy. Chris favours technical analysis methods to identify his trades and likes to trade equity indices and commodities as well as Forex. He favours a longer-term trading style, and his trades often last for days or weeks.

Source link

11 08, 2025

dietary supplements: Vitamin combos you should never mix – doctors say could do more harm than good

By |2025-08-11T22:24:12+03:00August 11, 2025|Dietary Supplements News, News|0 Comments


In recent years, using dietary supplements have become a popular way for many to help their health. From vitamins and minerals to protein powders, the market has plenty of options that promise enhanced energy, immunity, and wellness. The growing trend known as “supplement stacking” taking several supplements at once has emerged as people try to maximize these advantages. However, health experts warn that using multiple supplements without proper guidance can lead to unexpected and serious health issues.

What Is Supplement Stacking?

Supplement stacking means taking different dietary supplements at the same time, often in higher doses than what’s really recommended on the labels. People often try this to enhance overall health or focus multiple concerns at once, such as increasing immune function, improving digestion, or improving muscle strength. For example, someone might take vitamin D, magnesium, zinc, vitamin C, and an herbal supplement together daily.

While supplement stacking seems beneficial on the surface, it’s crucial to recognize that more isn’t always better. The human body needs nutrients in balanced amounts, and excessive intake of some vitamins and minerals can be dangerous.

Vitamin and Mineral Combos to Avoid

Here are some common supplement combinations experts advise against:

1. Calcium and Iron
Calcium and iron compete for absorption in the intestines. Taking them together can reduce how much of either mineral your body absorbs. If you need both, it’s better to take them at different times during the day.


2. Zinc and Copper
High doses of zinc can affect copper absorption, leading to a copper deficiency. Many multivitamins balance these two minerals, but taking separate zinc supplements without copper may cause problems.3. Vitamin E and Blood Thinners
Vitamin E in high amounts can increase the risk of bleeding, mainly when combined with blood- thinning medications like warfarin. This can lead to dangerous bleeding episodes.4. Vitamin A and Vitamin D Overload
Both vitamin A and D are fat-soluble and can accumulate in the body. Taking high doses of both can increase the risk of toxicity. It can cause symptoms like nausea, headaches, and in severe cases, organ damage.5. Iron and Zinc
Like calcium and iron, iron and zinc can compete for absorption. Taking large amounts of both simultaneously can reduce the effectiveness of each.

What Doctors Recommend

Experts suggest the following steps to safely take vitamins and supplements:

  • Consult your healthcare provider before starting any new supplements, especially if you are planning to take multiple types.
  • Get tested for nutrient deficiencies to know exactly what you really need.
  • Follow recommended doses carefully and avoid over doses unless prescribed by a doctor.
  • Space out mineral supplements that compete for absorption by taking them at different times.
  • Be cautious of combining supplements with medications, and always discuss this with your doctor.

Why Food Is Often Better

Nutrition experts often emphasize getting vitamins and minerals through a balanced diet. Whole foods provide nutrients in natural combinations, along with fiber and antioxidants that work together to support absorption and to stay healthy. Supplements can fill gaps but aren’t a replacement for healthy eating.

FAQs:

Q1. What are dietary supplements?
A1. Dietary supplements are products like vitamins, minerals, herbs, and protein powders taken to add nutrients to your diet. They are meant to support health but are not a replacement for healthy food.

Q2. Should I talk to a doctor before taking supplements?
A2. Yes, consulting a doctor ensures that, you take the right supplements safely and can avoid harmful interactions. This is especially important if you take medications or have health issues.


Source link

11 08, 2025

SPX, DXY, BTC, ETH, XRP, BNB, SOL, DOGE, ADA, HYPE — TradingView News

By |2025-08-11T22:14:57+03:00August 11, 2025|Crypto News, News|0 Comments

Key points:

  • Bitcoin faces significant selling near its all-time high, but the bulls are keeping price above $120,000, indicating strength.

  • Ether remains strong above its breakout level of $4,094, opening the doors for a further rally.

Bitcoin BTCUSD rose above $122,000 on Monday, but the long wick on the candlestick shows the bears are vigorously defending the all-time high of $123,218. However, if buyers do not cede much ground to the bears, BTC remains on track to hit a new all-time high.

Institutional investors also turned positive on Wednesday, with the BTC exchange-traded funds witnessing $91.55 million in net inflows. The inflows accelerated on Thursday and Friday, recording $280.69 million and $403.88 million, respectively, per SoSoValue data.

BTC’s bullish sentiment rubbed off on the entire cryptocurrency sector with several altcoins charging higher, led by Ether ETHUSD.

BitMEX co-founder Arthur Hayes, who had sold 2,373 ETH just a few days ago when the price was near $3,507, repurchased all of it at a much higher price around $4,150, according to a post on X.

Could BTC breakout to a new all-time high? Will altcoins follow BTC higher? Let’s analyze the charts of the top 10 cryptocurrencies to find out. 

S&P 500 Index price prediction

The S&P 500 Index (SPX) dipped below the 20-day simple moving average (SMA) (6,331) on Aug. 1, but the bulls swiftly reclaimed the level on Aug. 4.

The bulls will try to resume the uptrend by pushing the price above the 6,427 level. If they manage to do that, the index could surge to 6,500 and later to 6,696.

The first sign of weakness will be a break and close below the 20-day SMA. That suggests profit-booking at higher levels. The index may then decline to the breakout level of 6,147. Buyers are expected to defend the 6,147 level with all their might because a break below it signals a potential short-term top. 

US Dollar Index price prediction

The US Dollar Index (DXY) is trying to find support near the moving averages, but the long wick on Monday’s candlestick shows the bears are selling on rallies.

If the price dips below 97.94, the bears will try to pull the index to 97.10. Buyers are expected to fiercely defend the zone between 96.37 and 97.10 because a break below it opens the doors for a drop to 95.

On the upside, buyers will have to drive the price above 99.32 to suggest that the bears are losing their grip. The index could then climb to 100.54 and subsequently to 102. Sellers are likely to pose a strong challenge at the 102 level.

Bitcoin price prediction

BTC broke above the downtrend line on Sunday, and the bulls continued the momentum on Monday, reaching $122,335.

The bears are trying to guard the all-time high of $123,218, but a positive sign is that the bulls have kept up the pressure. That enhances the prospects of a break above $123,218. If that happens, the BTCUSDT pair could skyrocket toward $135,000.

The first sign of weakness will be a break and close below the 20-day SMA ($116,795). That signals a possible range formation in the near term. Bitcoin’s price could oscillate between $111,920 and $123,218 for a while. The pair will signal a short-term trend reversal below $110,530.

Ether price prediction

ETH picked up momentum after breaking above $3,745 on Thursday, and the bulls cleared the overhead hurdle at $4,094 on Saturday. 

The bears are unlikely to give up easily and will try to pull the price back below $4,094. If they manage to do that, the ETHUSDT pair could plummet to the 20-day SMA ($3,793). A solid bounce off the 20-day SMA indicates a positive sentiment, increasing the likelihood of the continuation of the up move toward $4,868.

Sellers will have to sink Ether’s price below the 20-day SMA to gain the upper hand. A short-term trend reversal will be signaled on a break below $3,350.

XRP price prediction

XRP XRPUSD turned up from $2.90 on Wednesday and surged above the 20-day SMA ($3.10) on Thursday.

The bears stalled the up move at $3.38 on Friday, but a positive sign is that the bulls have not allowed the price to dip back below the 20-day SMA.

If the price rises above $3.38, the XRPUSDT pair could march toward $3.66. Sellers are expected to aggressively defend the $3.66 level, but if the bulls have their way, the rally could extend to $4 and later to $4.50.

On the contrary, if the price continues lower and breaks below the 20-day SMA, it signals that the bears remain active at higher levels. XRP price could then tumble to the 50-day SMA ($2.81).

BNB price prediction

BNB BNBUSD has held above the $794 level for the past two days, but the bulls are struggling to sustain the price above $815.

The upsloping moving averages and the relative strength index (RSI) in the positive zone indicate that bulls have an edge. If the price rebounds off $794 and rises above $828, the BNBUSDT pair could soar to $861.

Instead, if the price turns down and breaks below the 20-day SMA ($785), it suggests profit booking at higher levels. BNB price may then plummet to the solid support at $732, where the buyers are expected to step in.

Solana price prediction

Solana (SOL) pierced the 20-day SMA ($176) on Saturday and reached the overhead resistance at $185.

The bulls will try to push the price above $185 and gain the upper hand. If they do that, the SOLUSDT pair could climb to $195 and later to $209. Sellers are expected to mount a strong defense at $209.

Conversely, a break below the 20-day SMA signals that the bears are aggressively defending the $185 level. Solana’s price could then drop to the 50-day SMA ($166) and later to the solid support at $155.

Dogecoin price prediction

Dogecoin (DOGE) rose above the 20-day SMA ($0.22) on Friday, but the bulls are struggling to push the price to $0.26.

If the price turns down and slips below the 20-day SMA, the DOGEUSDT pair could descend to the 50-day SMA ($0.20). That suggests a consolidation between $0.25 and $0.19 for some time.

If the price bounces off the 20-day SMA and breaks above $0.25, DOGE could rally to $0.29. On the downside, a break below $0.19 could sink the pair to $0.16 and eventually to $0.14.

Cardano price prediction

Cardano (ADA) rose above the 20-day SMA ($0.77) on Friday, indicating that the buyers are making a comeback.

Sellers tried to pull the price below the 20-day SMA on Sunday, but the bulls held their ground. The bounce off the 20-day SMA on Monday met with selling pressure at higher levels.

A break and close below the 20-day SMA weakens the bullish momentum. Cardano’s price may then descend to the 50-day SMA ($0.71). 

Buyers will be back in the driver’s seat if they drive the ADAUSDT pair above $0.86. That opens the gates for a rally to $0.94.

Hyperliquid price prediction

Hyperliquid (HYPE) has rebounded in the past few days, indicating aggressive buying at lower levels.

The HYPE/USDT pair is witnessing a tough battle between the bulls and the bears at the support line of the ascending channel pattern. If the price turns down from the support line, the HYPE price could drop to the moving averages. A bounce off the moving averages increases the likelihood of a rally to $50 and, after that, to $62.50.

Alternatively, a break and close below the moving averages suggests that the bears are trying to seize control. The pair may then slump to $35.50.

This article does not contain investment advice or recommendations. Every investment and trading move involves risk, and readers should conduct their own research when making a decision.

Source link

Go to Top