About Editorial team of BIPNs

Main team of content of bipns.com. Any type of content should be approved by us.
17 07, 2025

WTI rises with focus on API report

By |2025-07-17T08:27:15+03:00July 17, 2025|Forex News, News|0 Comments


  • West Texas Intermediate (WTI) edges higher, approaching the $65.00 mark.
  • WTI Crude Oil gains are restricted by the 100-day moving average, providing additional resistance at $65.31.
  • US Crude Oil inventory data could serve as an additional catalyst for WTI with the weekly API report due at 20.30 GMT.

West Texas Intermediate (WTI) Crude Oil is staging a mild rebound on Tuesday, as traders continue to monitor supply and demand dynamics.

WTI Crude Oil is trading near $65.00, with intraday gains nearing 1% at the time of writing.

As the US Oil benchmark continues to trade within a well-defined range between $64.00 and $65.00, focus turns to the upcoming American Petroleum Institute (API) report.

The API will release its weekly Statistical Bulletin (WBS), providing insight into US crude oil stockpiles. According to FXStreet data, Tuesday’s report is expected to show Oil stockpiles declining by 2.26 M barrels, after a 4.277 M barrel drawdown last week. 

Will US Oil inventory data drive WTI out of its current range? 

Over the past five weeks, the report has revealed that Crude Oil stockpiles have continued to decline, reflecting rising demand. However, the Israel-Iran conflict, which ignited fears over potential disruptions to the Strait of Hormuz, had been a major contributor to depleting stockpiles. 

With easing tensions in the Middle East, the Organization of the Petroleum Exporting Countries and its allies (OPEC+) continue to increase supply, limiting the upside move.

However, even with OPEC+ gradually adding supply, sentiment appears to be stabilizing after last week’s steep 12% slide. 

If Tuesday’s data points to a deeper-than-forecast draw, it could signal stronger domestic consumption and offer short-term support as the third quarter begins.

Crude Oil technical analysis: WTI rises toward $65.00

With WTI currently testing the $65.00 psychological level, the 100-day Simple Moving Average (SMA) is providing resistance near $65.31. A move above this level could see the price retest the next round number of $66.00, opening the door for the 50% Fibonacci level of the January-April decline at $67.00.

The Relative Strength Index (RSI) is pointing higher, but remains slightly bearish near 47.

WTI (US Crude) Oil daily chart

If prices fail to hold above $65.00, prices could fall to the 38.2% Fibo level, providing support at $64.18. The June low at $63.73 lies below, a break of which brings the 50-day SMA into play at $63.41.

Economic Indicator

API Weekly Crude Oil Stock

API’s Weekly Statistical Bulletin (WSB) has reported total U.S. and regional data relating to refinery operations and the production of the four major petroleum products: motor gasoline, kerosene jet fuel, distillate (by sulfur content), and residual fuel oil. These products represent more than 85% of total petroleum industry.


Read more.

WTI Oil FAQs

WTI Oil is a type of Crude Oil sold on international markets. The WTI stands for West Texas Intermediate, one of three major types including Brent and Dubai Crude. WTI is also referred to as “light” and “sweet” because of its relatively low gravity and sulfur content respectively. It is considered a high quality Oil that is easily refined. It is sourced in the United States and distributed via the Cushing hub, which is considered “The Pipeline Crossroads of the World”. It is a benchmark for the Oil market and WTI price is frequently quoted in the media.

Like all assets, supply and demand are the key drivers of WTI Oil price. As such, global growth can be a driver of increased demand and vice versa for weak global growth. Political instability, wars, and sanctions can disrupt supply and impact prices. The decisions of OPEC, a group of major Oil-producing countries, is another key driver of price. The value of the US Dollar influences the price of WTI Crude Oil, since Oil is predominantly traded in US Dollars, thus a weaker US Dollar can make Oil more affordable and vice versa.

The weekly Oil inventory reports published by the American Petroleum Institute (API) and the Energy Information Agency (EIA) impact the price of WTI Oil. Changes in inventories reflect fluctuating supply and demand. If the data shows a drop in inventories it can indicate increased demand, pushing up Oil price. Higher inventories can reflect increased supply, pushing down prices. API’s report is published every Tuesday and EIA’s the day after. Their results are usually similar, falling within 1% of each other 75% of the time. The EIA data is considered more reliable, since it is a government agency.

OPEC (Organization of the Petroleum Exporting Countries) is a group of 12 Oil-producing nations who collectively decide production quotas for member countries at twice-yearly meetings. Their decisions often impact WTI Oil prices. When OPEC decides to lower quotas, it can tighten supply, pushing up Oil prices. When OPEC increases production, it has the opposite effect. OPEC+ refers to an expanded group that includes ten extra non-OPEC members, the most notable of which is Russia.



Source link

17 07, 2025

Global Omega-3 Market to More Than Double to USD 13,323.1 million by 2035 Driven by Health Awareness and Product Innovation – FMIBlog

By |2025-07-17T08:24:07+03:00July 17, 2025|Dietary Supplements News, News|0 Comments


The global omega-3 market is projected to expand from USD 5,785.1 million in 2025 to USD 13,323.1 million by 2035, growing at a robust CAGR of 8.7%. This surge is propelled by heightened consumer awareness of omega-3 fatty acids’ benefits—spanning heart health, brain function, and inflammation control—coupled with wider availability across dietary supplements, functional foods, and nutraceuticals.

Rising demand for omega-3 supplements, fortified foods, and functional beverages is driving rapid expansion in the global omega-3 market. Consumers are increasingly prioritizing preventive health measures, clean-label ingredients, and nutritional transparency—factors that are boosting the adoption of omega-3-rich products. At the same time, improvements in global distribution channels and accessibility through e-commerce platforms are making these products more widely available across various demographic groups.

Uncover Essential Data – Get A Sample Copy https://www.futuremarketinsights.com/reports/sample/rep-gb-15976

Market Trends Highlighted

  • Rising Health Consciousness:

Consumers increasingly seek supplements and functional foods enriched with omega-3 to support cardiovascular well-being, cognitive health, and joint function.

The industry is seeing a boom in formulations like omega-3 gummies, vegan algal oils, microencapsulated powders, and omega-3 fortified snacks and beverages.

  • Plant-Based & Sustainable Sources:

Demand is shifting toward vegetarian and vegan-friendly omega-3 alternatives (e.g., algal and flaxseed oil), driven by sustainability and ethical consumption trends.

  • Functional Food & Beverages Expansion:

Food and beverage companies are embedding omega-3 into dairy products, smoothies, bars, and cereals for healthier and more appealing product portfolios.

  • E-commerce & Direct-to-Consumer Growth:

The rise of online retail is enabling supplement brands to reach broader audiences with subscription models, personalized recommendations, and transparent sourcing.

Key Takeaways of the Report

  • Strong Forecasted Growth:

The omega-3 market is expected to grow at 8.7% CAGR between 2025 and 2035, reaching USD 13.32 billion by 2035.

Evidence-backed benefits—heart, brain, and anti-inflammatory health—are fueling both consumer demand and physician recommendations of omega-3 supplements.

  • Shifting Formulation Preferences:

There is growing consumer demand for innovative delivery systems (e.g., gummies, gummies with probiotics, emulsions) and vegan alternatives.

  • Supply Chain and Sustainability Pressure:

Rising regulations and environmental concerns are pushing producers to source sustainable omega-3 through responsible fishing, algal extraction, and carbon-friendly manufacturing.

  • Premiumization and Quality Focus:

The market is seeing increased interest in molecularly distilled, concentrated, and certified omega-3 oils with verified purity and efficacy, enabling price premiums.

Innovation in Sustainable and Functional Solutions

Product innovation is reshaping the omega-3 landscape, with significant interest in sustainable alternatives such as algae- and plant-based omega-3 supplements. These options appeal to vegetarians and environmentally aware consumers, reducing dependency on marine sources. Technological advancements like supercritical CO₂ extraction and microencapsulation are also enhancing product quality—boosting bioavailability, ensuring longer shelf life, and minimizing oxidation. These improvements have allowed omega-3 to move beyond traditional supplement formats into functional foods and beverages with targeted health benefits.

Regional Market Outlook

North America (especially U.S.):

With a CAGR of around 4.2%, the U.S. leads in omega-3 usage, especially through dietary supplements and functional foods, supported by strong regulatory frameworks and consumer health awareness.

Asia-Pacific (China & Japan):

China is growing at approximately 5.1%, driven by rising incomes and health consciousness, while Japan’s aging population and wellness focus contribute to a 2.5% regional CAGR, supporting stable market growth.

EMEA Regions:

Europe and Middle East markets are showing steady gains in marine and plant-based omega-3, with growing public health initiatives and increased supplement consumption.

Leading Manufacturers

  • DSM Nutritional Products
  • BASF SE
  • Cargill, Inc.
  • Corbion N.V.
  • Omega Protein Corporation
  • Epax Norway AS
  • GC Rieber Oils
  • Croda International Plc
  • Archer Daniels Midland Company (ADM)
  • Nordic Naturals
  • KD Pharma Group
  • Novonesis Group
  • Golden Omega S.A

Top Investment Segments in the Omega 3 Market Report

By Product Type:

Docosahexaenoic Acid (DHA), Eicosapentaenoic Acid (EPA), Alpha-Linolenic Acid (ALA)

By Source Type:

Fish Oil, Krill Oil, Algal Oil, Flaxseed, Chia Seeds

By Form Type:

Soft Gels/Capsules, Oil, Powder, Gummies

By Region:

Industry analysis has been carried out in key countries of North America, Latin America, Europe, Middle East and Africa, East Asia, South Asia, and Oceania

Stay Ahead – Grab the Report: https://www.futuremarketinsights.com/checkout/15976  

About Future Market Insights (FMI)

Future Market Insights, Inc. (ESOMAR certified, recipient of the Stevie Award, and a member of the Greater New York Chamber of Commerce) offers profound insights into the driving factors that are boosting demand in the market. FMI stands as the leading global provider of market intelligence, advisory services, consulting, and events for the Packaging, Food and Beverage, Consumer Technology, Healthcare, Industrial, and Chemicals markets. With a vast team of over 400 analysts worldwide, FMI provides global, regional, and local expertise on diverse domains and industry trends across more than 110 countries.

Contact Us:

Future Market Insights Inc.
Christiana Corporate, 200 Continental Drive,
Suite 401, Newark, Delaware – 19713, USA
T: +1-347-918-3531
For Sales Enquiries: sales@futuremarketinsights.com
Website: https://www.futuremarketinsights.com
LinkedInTwitterBlogs | YouTube


Source link

17 07, 2025

Toncoin Surges 20% as TAC Mainnet Launch Boosts DApp Adoption

By |2025-07-17T06:29:02+03:00July 17, 2025|News, NFT News|0 Comments


The launch of the TAC mainnet on Tuesday has sparked significant interest in the cryptocurrency community, particularly for Toncoin (TON). This development is expected to facilitate interaction between Telegram’s one billion users and Ethereum Virtual Machine (EVM) decentralized apps (DApps) directly within the messenger. This integration is anticipated to lower the technical barrier for mainstream users, potentially boosting DApp adoption and asset inflows into the TON network.

Analysts have noted that TON has shown early signs of a breakout, which could pave the way for a rally to $3.50. The cryptocurrency has risen above its moving averages and is approaching the downtrend line of a descending triangle pattern. The 20-day exponential moving average (EMA) has started to turn up, and the relative strength index (RSI) has entered positive territory, indicating a buyer’s advantage. However, sellers are expected to defend the downtrend line vigorously, as a break above it could invalidate the negative setup and propel the TON/USDT pair to $3.69.

On the four-hour chart, both moving averages have started to turn up, and the RSI remains in positive territory, suggesting that bulls have the upper hand. Buyers are likely to attempt to push the price to the downtrend line, which could present a substantial challenge. If the price turns down from the downtrend line but bounces off the 20-day EMA, it indicates a bullish sentiment, increasing the likelihood of a break above the downtrend line. In this scenario, the pair could rally to $3.40 and then to $3.50.

Conversely, if the price turns down sharply from the downtrend line, it suggests that bears remain sellers on rallies, potentially keeping the pair within the triangle for an extended period. Sellers will gain the upper hand if they push the price below the $2.75 support. Similarly, a drop below the moving averages suggests that bulls are losing their grip, and the pair may slump to $2.90.

It is important to note that this analysis is based on technical indicators and does not constitute investment advice or recommendations. Every investment and trading move involves risk, and individuals should conduct their own research when making decisions.


Source link

17 07, 2025

Ms. Cattea Tea Bar at Potts Point has 100 varieties to try

By |2025-07-17T06:23:22+03:00July 17, 2025|Dietary Supplements News, News|0 Comments


The Potts Point shop can be overwhelming with its tea choices, but Lee Tran Lam has a cheat code for first-timers.


Source link

17 07, 2025

Altcoins Drive 60% DeFi Growth With Advanced Tools

By |2025-07-17T04:28:21+03:00July 17, 2025|News, NFT News|0 Comments


In July 2025, several altcoins are gaining attention for their innovative approaches to decentralized finance (DeFi), particularly through the implementation of advanced trade alert engines and wallet tracking tools. These developments are contributing to a reported growth of over 60 percent in platform activity, indicating a surge in user engagement and strategic maneuvers within the DeFi space. Despite the unpredictable volatility and macroeconomic factors, these altcoins are driving a shift towards greater accessibility and efficiency in managing DeFi protocols.

Key projects under scrutiny include AurealOne (DLUME), Algorand (ALGO), Worldcoin (WLD), and Sei (SEI). Each of these platforms offers unique technical architectures and strategic approaches to on-chain data and execution. Analysts are focusing on the increased reliance on automation, data precision, and behavioral tracking that these platforms provide. The adoption of real-time alerts and enhanced wallet analytics is enabling faster trade execution and more informed decision-making, which is particularly beneficial for users navigating the complex DeFi landscape.

AurealOne (DLUME) is notable for its integration of privacy-enhanced smart contracts with wallet-level analytics. DLUME employs a layered architecture that offers both anonymous asset management and precise trade notifications, a combination that some analysts view as unmatched in current DeFi infrastructure. As of early July, DLUME reported a 61% increase in weekly wallet interactions compared to the previous month, highlighting the effectiveness of its privacy and tracking features.

Algorand (ALGO), known for its speed and scalability, has integrated an internal trade alert system across DeFi protocols within its ecosystem. This tool allows for the tracking of market signals and the broadcasting of alerts tied to specific asset movements. Algorand’s activity has increased steadily, with smart contract usage up by 58% in the third quarter so far, according to on-chain data providers. This integration underscores Algorand’s commitment to real-time DeFi tools and its role in enhancing user experience.

Worldcoin (WLD) is incorporating biometric ID verification into its wallet tracking systems, aligning user identity with asset movement. Although this approach is controversial, it has resulted in a sharp 67% spike in verified DeFi wallet activations. Analysts note that Worldcoin’s combined identity and financial tracking systems offer a robust framework for compliance-aware DeFi applications, addressing regulatory concerns while maintaining user engagement.

Sei (SEI), recognized for its high-performance trading infrastructure, has implemented adaptive trade alert logic tailored for on-chain order flow. Data shows that Sei’s trading engine saw a 65% increase in throughput in the past 30 days, driven by demand for precision-based trading strategies powered by real-time data feeds. This development positions Sei as a leader in optimizing trading signals within the DeFi space, catering to users seeking efficient and accurate trading tools.

Overall, the shift towards automation and behavioral data in DeFi infrastructure signals a new phase of efficiency-focused innovation. These advancements are not only enhancing user retention and smart contract interactions but also addressing key themes such as privacy, speed, and regulatory alignment. As the DeFi sector continues to evolve, these altcoins are at the forefront of revolutionizing how users engage with decentralized financial protocols, paving the way for a more accessible and efficient DeFi ecosystem.


Source link

17 07, 2025

Natural Gas Price Forecast: Surge Clears Key Technical Barriers

By |2025-07-17T04:25:24+03:00July 17, 2025|Forex News, News|0 Comments


Bulls Remain in Charge

The bulls remain in charge at the time of this writing, with trading continuing in the upper half of the day’s trading range. A daily close above yesterday’s high of $3.54 to a new trend high and the 20-Day line, while a daily close above $3.57 confirms the swing breakout. Nevertheless, this is bullish behavior, and it establishes additional confirmation that the bearish correction is most likely complete.

Next Pivot, $3.75

If the price of natural gas keeps rising before a pullback, it heads towards the next pivot zone from the lower swing high at $3.75. A breakout above that level will trigger another bullish reversal signal. It is interesting to note that the convergence of the 20-Day MA, the 50-Day MA, and an AVWAP line from the April low, converged as price broke through. In addition, the prior uptrend line (dashed) was also part of the resistance zone. This makes today’s breakout potentially significant, and it increases the chance for a relatively shallow pullback, when it does occur.

200-Day Moving Average Support

Since the $3.53 price zone remains nearby, the 200-Day MA, now at $3.44, is a key potential support area. If natural gas continues to trade above the line, a bullish posture remains. In addition, a weekly bull breakout occurred this week, and it looks likely that the week will end above last week’s high of $3.47. That would confirm the breakout on a weekly basis.

$3.75 – Initial Upside Target

A key potential resistance zone shows from around the interim swing high at $3.75 to a prior swing high of $3.84 from May. The 61.8% Fibonacci retracement is within that range at $3.77. Given the likelihood that a bottom is complete, the supply and demand dynamics in a pullback should provide clues. In the short-term, the next potential resistance zone above today’s high is around the 50% retracement at $3.65.

For a look at all of today’s economic events, check out our economic calendar.


Source link

17 07, 2025

Matcha Tea Market to Witness 7.00% CAGR, Reaching USD 6.3 Billion

By |2025-07-17T04:22:31+03:00July 17, 2025|Dietary Supplements News, News|0 Comments


Matcha Tea Market

Matcha Tea Market was valued at USD 3.4 billion in 2023 and is expected to reach USD 6.3 billion by 2032, growing at a compound annual growth rate (CAGR) of 7.00% from 2024 to 2032.

matcha tea has become more than just a trend in the beverage industry-it’s now a global phenomenon. Originating from Japan, matcha tea is made from finely ground powder of specially grown green tea leaves, packed with antioxidants and nutrients. Its growing popularity worldwide has resulted in a significant rise in demand and innovation, driving the global matcha tea market to new heights.

Key Players are:

Nestle SA (Switzerland), Tata Beverages Ltd. (India), The Unilever Group (U.K.), AOI Tea Company (U.S.), Aiya Co. Ltd. (Japan), ITO EN LTD (Japan), Marukyu Koyamaen Co. Ltd. (Japan).

“REQUEST FREE SAMPLE REPORT” – Obtain a free sample report to get a firsthand look at our comprehensive insights: https://www.marketresearchfuture.com/sample_request/2382

Growing Demand for Matcha Tea Worldwide

The increasing global awareness of healthy lifestyles and wellness has led to a surge in demand for natural, functional beverages. As consumers seek alternatives to sugary drinks and caffeinated sodas, matcha tea has emerged as a favorite due to its impressive health benefits. Rich in antioxidants, vitamins, and amino acids, matcha helps in boosting metabolism, improving focus, and enhancing energy levels.

Matcha’s popularity has expanded well beyond Japan, reaching international markets such as the United States, Europe, and parts of Asia. In these regions, matcha has found its place in cafes, supermarkets, and even health food stores. It is commonly consumed as a hot or iced drink, and its versatility has made it a prime ingredient in a wide range of products-from smoothies and lattes to baked goods and even ice cream.

Moreover, the awareness around its traditional use in Japanese tea ceremonies has also contributed to its allure. Matcha is seen not only as a drink but also as an experience, often associated with mindfulness and well-being. This cultural connection is another factor driving its global appeal.

Rising Consumer Trends in the Matcha Tea Market

Health-Conscious Choices

As health-conscious consumers look for alternatives to traditional caffeinated drinks, matcha has taken center stage due to its numerous health benefits. Unlike regular green tea, matcha offers a sustained energy boost without the jitteriness associated with coffee. It also contains L-theanine, an amino acid known to enhance focus and relaxation simultaneously, making it a preferred option for individuals looking to boost productivity.

Matcha in Culinary Innovations

The demand for matcha has also sparked creativity in the culinary world. Chefs and food innovators have found ways to incorporate matcha into a variety of food products, including chocolates, protein bars, salad dressings, and even beauty products. Matcha-flavored desserts, such as cakes, cookies, and ice creams, have become incredibly popular worldwide. This innovation has further expanded the reach of matcha tea beyond just a drink to a versatile ingredient used in a wide range of products.

Organic and Premium Offerings

Consumers’ preference for organic and premium-quality products has spurred growth in the demand for high-quality matcha tea. Organic matcha, which is free from pesticides and chemicals, is particularly sought after by health-conscious individuals who prioritize sustainability and purity in their food and beverage choices. As the awareness of these premium matcha products increases, market players are stepping up to offer high-quality matcha with certifications and traceability.

Vegan and Plant-Based Movement

The rise of plant-based and vegan diets has also played a key role in matcha’s increased adoption. Since matcha is naturally vegan, it is highly favored by individuals following plant-based lifestyles. It’s also being used in vegan lattes and smoothies as a rich and nutritious alternative to other milk-based beverages.

“Browse Report” – Explore the report’s contents, sections, and key insights by browsing through its detailed information: https://www.marketresearchfuture.com/reports/matcha-tea-market-2382

Future Innovations in the Matcha Tea Market

The future of the matcha tea market looks promising, with continued growth driven by innovations in both product offerings and consumer engagement.

Ready-to-Drink (RTD) Matcha Beverages

With the increasing demand for convenience, ready-to-drink matcha beverages are expected to dominate the market. Brands are already introducing bottled matcha drinks, offering an easy way for consumers to enjoy matcha without the need for preparation. These RTD drinks are available in various flavors, and many are also infused with functional ingredients like collagen or probiotics to cater to wellness trends.

Matcha in Functional Foods

The trend of functional foods will continue to influence the matcha tea market. As people look for foods that offer more than just basic nutrition, matcha’s high antioxidant content, energy-boosting properties, and metabolism-enhancing benefits make it an ideal ingredient for functional snacks and meals. In the coming years, we can expect to see matcha incorporated into new food categories, such as protein powders, supplements, and even savory snacks.

Sustainability and Eco-Friendly Packaging

As consumers become more environmentally conscious, sustainable practices and eco-friendly packaging will be a significant focus for matcha tea producers. Companies are likely to adopt biodegradable or recyclable packaging, and sourcing matcha from sustainable farms will become an essential part of the market’s future.

Technological Advancements in Production

With growing demand, the production of matcha will likely see technological advancements aimed at improving quality and reducing costs. Innovations in farming practices, such as precision agriculture and vertical farming, could enable producers to grow matcha more efficiently, ensuring consistent quality while minimizing environmental impact.

TABLE OF CONTENTS

EXECUTIVE SUMMARY

MARKET INTRODUCTION

RESEARCH METHODOLOGY

MARKET INSIGHTS

MARKET DYNAMICS

MARKET FACTOR ANALYSIS

Discover more Research Reports on Food, Beverages & Nutrition Industry, by Market Research Future:

Animal Based Meat Dairy Product Market: https://www.marketresearchfuture.com/reports/animal-based-meat-dairy-product-market-41393

Apiculture Market: https://www.marketresearchfuture.com/reports/apiculture-market-41406

Automated Poultry Farm Market: https://www.marketresearchfuture.com/reports/automated-poultry-farm-market-41410

Baked Food And Cereals Market: https://www.marketresearchfuture.com/reports/baked-food-and-cereals-market-41463

Baking Soda Substitute Market: https://www.marketresearchfuture.com/reports/baking-soda-substitute-market-41400

Beta Agonist Feed Additives Market: https://www.marketresearchfuture.com/reports/beta-agonist-feed-additives-market-41482

About Market Research Future:

Market Research Future (MRFR) is a global market research company that takes pride in its services, offering a complete and accurate analysis with regard to diverse markets and consumers worldwide. Market Research Future has the distinguished objective of providing optimal quality research and granular research to clients. Our market research studies by products, services, technologies, applications, end users, and market players for global, regional, and country level market segments, enable our clients to see more, know more, and do more, which help answer your most important questions.

Contact Us:

Market Research Future (Part of Wantstats Research and Media Private Limited)

99 Hudson Street, 5Th Floor

New York, NY 10013

United States of America

+1 628 258 0071 (US)

+44 2035 002 764 (UK)

Email: sales@marketresearchfuture.com

Website: https://www.marketresearchfuture.com

This release was published on openPR.


Source link

17 07, 2025

Cardano Price Prediction: After Breaking Key Levels, Is ADA Still A Top Buy Or Has The Market Moved On?

By |2025-07-17T04:18:40+03:00July 17, 2025|Crypto News, News|0 Comments

The Cardano price forecast is in the spotlight again after ADA recently fell below important support, priced at $0.7180 — 3.59% lower in 24 hours. Although Cardano continues to have a market capitalization of $25.41 billion, the 24-hour trading volume has declined 18.16% to $1.45 billion, casting doubt on its short-term momentum.

Yet with long-term fundamentals still in place, has ADA been forgotten — or is it merely running out of steam in 2025?

ADA Outlook: Still One of the Best Crypto to Invest in Now?

ADA has been a long-standing stalwart among major altcoins. With its reputation for an energy-efficient proof-of-stake model and incremental methodology, Cardano was the poster child of crypto with actual utility.

Yet today, in spite of sound development news, rivals such as Solana and newer Layer 2 Ethereum options are stealing the limelight. The main question for numerous investors is if ADA is still among the best crypto to buy now, or if it’s being overshadowed by more agile DeFi projects.

Nevertheless, some analysts think the recent drop might be a setup for a relief phase, particularly with Bitcoin stabilizing. If ADA gets back on track, a retest of the $0.80 mark looks probable — particularly in the lead-up to the next crypto bull run.

Key Factors Affecting Cardano Price Forecast

The Cardano price forecast depends on various short- and long-term variables. Firstly, ongoing work on Hydra, its scaling solution, is key. Secondly, additional dApp adoption could get things back on track — especially if crypto staking and DeFi use gather pace.

Sentiment is nevertheless moving towards new altcoins to follow, many of which have faster product launches and more ambitious roadmaps. As interest increases regarding early stage crypto investments, ADA’s tempo might be too slow for certain investors.

Conversely, a few new tokens are building significant traction by coupling real-world applications with near-term delivery.

Why Remittix Could Steal the Limelight

Although Cardano has legacy appeal, newer entrants such as Remittix are now garnering retail and institutional attention. Remittix (RTX) just cleared a complete CertiK audit, announced its Q3 wallet release, and is providing a 50% bonus for its presale.

Priced at $0.0811, more than 553million RTX tokens have been sold already, with more than $16.2M raised. This Remittix DeFi project allows users to transfer crypto directly to bank accounts in more than 30 countries, providing a difficult-to-beat low gas fee crypto utility.

Why Remittix Is Catching Fire:

  • CertiK-audited with real product progress
  • Q3 wallet launch with live FX conversion
  • $250K giveaway fueling presale demand
  • Just $2M remaining to reach $18M soft cap
  • Utility-first design for international remittances

Unlike most top coins, Remittix is addressing a $19T payments issue — not simply generating hype. For people looking for the next 100x crypto or best crypto under $1, RTX is becoming ever more appealing. As ADA’s near-term performance remains questionable, investors are taking a fresh look at their exposure. As promising as Cardano remains, projects such as Remittix are emerging as dark horse fastest growing crypto 2025 contenders. With newer entrants coming in with more robust real-world use cases, it’s evident the crypto ecosystem is evolving rapidly — and early adopters are keeping pace.

Discover the future of PayFi with Remittix by checking out their presale here:

Website: https://remittix.io/ 

Socials: https://linktr.ee/remittix 

$250K Giveaway: https://gleam.io/competitions/nz84L-250000-remittix-giveaway

Source link

17 07, 2025

Softer PPI data underpins XAG/USD, bullish momentum persists

By |2025-07-17T02:23:25+03:00July 17, 2025|Forex News, News|0 Comments


  • Silver (XAG/USD) holds steady near $37.80 on Wednesday, recovering modestly from a mild pullback earlier in the week.
  • The headline PPI came in flat for June, while Core PPI also missed expectations.
  • Core PPI also disappointed, printing at 0.0% MoM and 2.6% YoY, both below market estimates.

Silver (XAG/USD) is holding firm near the $38.00 level on Wednesday, drawing support after US Producer Price Index (PPI) data for June came in softer than expected. At the time of writing, the metal is trading around $37.90 per ounce.

Silver showed little reaction after the release of the latest US PPI data, which came in softer than expected. Headline PPI was flat in June, showing no monthly growth, compared to the 0.2% increase markets had expected, and down from a 0.3% rise in May. On an annual basis, PPI slowed to 2.3%, also below the 2.5% forecast and the 2.6% reading from the previous month.

Core PPI, which excludes food and energy, was also weaker than expected. It came in at 0.0% MoM, missing the 0.2% forecast and down from 0.1% in May. On a yearly basis, Core PPI eased to 2.6%, compared to 2.7% expected and 3.0% in the previous month.

This follows Tuesday’s US Consumer Price Index (CPI) data, which showed headline inflation in line with expectations, but core inflation came in slightly softer. The mix of inflation data has reduced the urgency for rate cuts, keeping the US Dollar under modest pressure while non-yielding assets, such as silver, remain supported.

The metal touched a fresh 14-year high of $39.13 on Monday before retreating slightly as investors booked profits. However, the broader technical setup remains bullish, with buyers still in control amid lingering safe-haven demand and cautious risk sentiment.

On the daily chart, Silver (XAG/USD) is trading just above the midline of a rising parallel channel that has guided price action since early April. The recent move higher followed a breakout from a multi-week consolidation range between $35.50 and $37.00, which had kept the metal in check through much of June and early July.

The breakout was confirmed by a strong bullish daily candle, propelling Silver toward the channel’s upper boundary near $39.00. Following a modest round of profit-taking, the metal has stabilized near the midpoint of the channel, which now serves as dynamic support, suggesting that the uptrend remains intact and well-supported.

The 21-day Exponential Moving Average (EMA) at $36.82 continues to offer key dynamic support and has been consistently respected throughout the current uptrend, reinforcing the underlying bullish structure.

Immediate resistance is seen at the 14-year high of $39.13. A decisive daily close above this level would confirm the next leg of the uptrend and open the door toward the psychological $40.00 mark. If bulls manage to sustain momentum above $40.00, the upper boundary of the rising channel around $40.50 could act as the next upside target.

On the downside, initial support is located at $37.50, which marks the upper boundary of the previous consolidation zone. A break below this level would put focus back on the 21-day EMA at $36.82. Deeper losses may target stronger support near $36.00, aligning with the lower edge of the rising channel.

Momentum indicators continue to favor the bullish scenario. The Relative Strength Index (RSI) has eased slightly from overbought conditions, and now stands near 63.50. This pullback in the RSI indicates a healthy consolidation phase rather than a trend reversal.

At the same time, the Moving Average Convergence Divergence (MACD) remains firmly in positive territory with a steady histogram and no signs of bearish divergence, signaling that upward momentum remains intact.


Source link

17 07, 2025

EUR/USD Analysis Today 16/07: Bearish Trend Begins (Chart)

By |2025-07-17T02:22:04+03:00July 17, 2025|Forex News, News|0 Comments

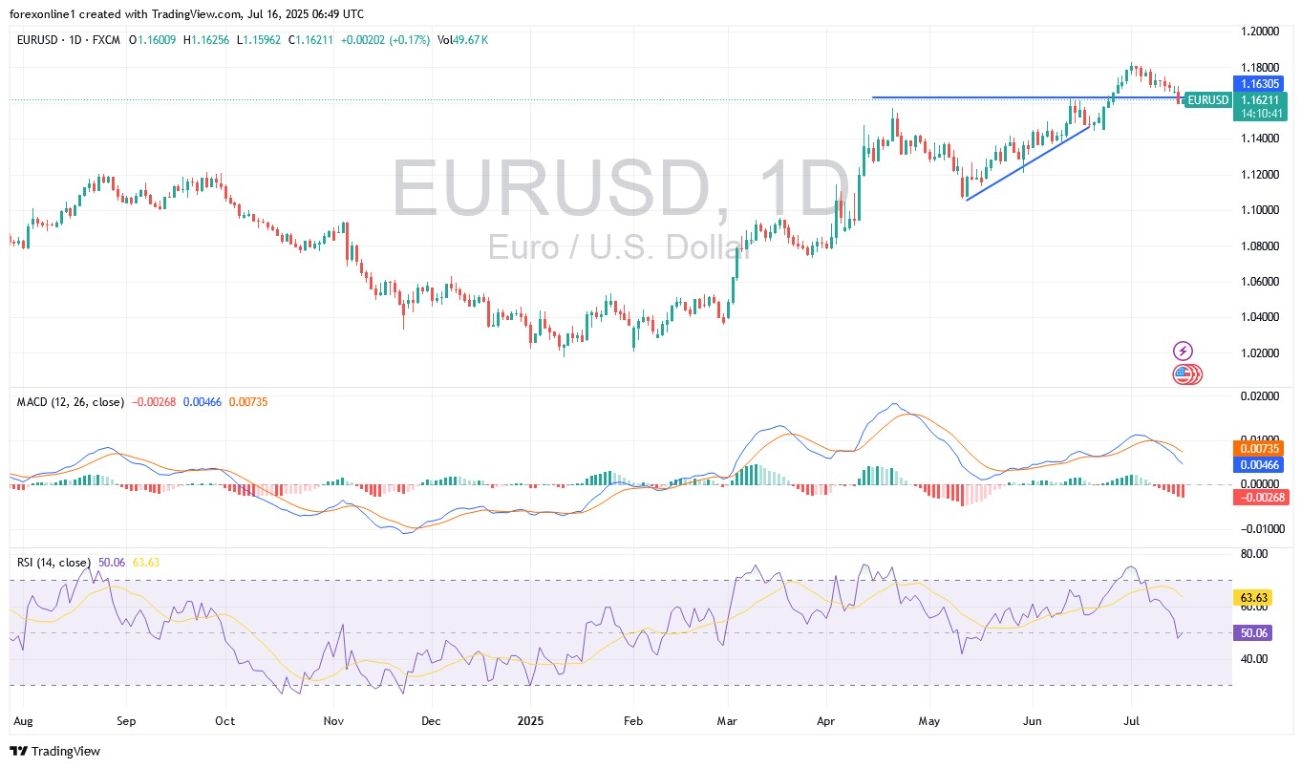
EUR/USD Analysis Summary Today

  • Overall Trend: Beginning a bearish inclination.
  • Today’s EUR/USD Support Levels: 1.1590 – 1.1500 – 1.1430.
  • Today’s EUR/USD Resistance Levels: 1.1700 – 1.1780 – 1.1840.

EUR/USD Trading Signals:

  • Buy EUR/USD from the support level of 1.1560 with a target of 1.1700 and a stop loss of 1.1500.
  • Sell EUR/USD from the resistance level of 1.1750 with a target of 1.1600 and a stop loss of 1.1800.

EUR/USD Technical Analysis Today:

Bears have successfully pushed the EUR/USD pair lower for two consecutive days, moving it below the 1.1600 support level. This sets the currency pair up for a new bearish path if the recent strength of the US dollar continues. Selling pressure intensified after mixed US consumer inflation data prompted traders to scale back their expectations for Federal Reserve interest rate cuts. While headline inflation matched monthly and annual forecasts, core inflation came in weaker than expected. Adding to the cautious outlook, Dallas Federal Reserve President Lorie Logan stated that the US central bank will likely need to keep interest rates steady for an extended period to ensure inflation remains contained amid tariff-induced price pressures. Overall, financial markets are now pricing in a lower probability of multiple interest rate cuts this year, with the likelihood of a September move hovering just above 50%.

Technical Levels for the EUR/USD Pair Today:

According to trading on the daily timeframe chart, the EUR/USD pair is at the beginning of a bearish shift, moving below the 1.1600 level. This movement has pushed the 14-day RSI (Relative Strength Index) to break the midline, giving bears sufficient momentum to start moving lower. At the same time, the blue MACD (Moving Average Convergence Divergence) line has moved below the orange line, supporting the technical bearish shift and preparing for stronger losses before technical indicators reach strong oversold levels. The most important target for bears to control the currency pair will remain the 1.1450 support level. On the positive side, the 1.1760 resistance will remain crucial for the return of bullish control. The recent performance of the currency pair confirms the strength of our free recommendations to sell EUR/USD from every upward level.

Today’s EUR/USD trading coincides with the announcement of the Eurozone’s trade balance reading at 12:00 PM Cairo time. On the US side, the Producer Price Index (PPI) reading, one of the tools for measuring US inflation, will be announced at 3:30 PM Cairo time. In addition, there will be statements from some US Federal Reserve officials.

Will the Euro Rise Again?

According to forex trading experts’ forecasts, Euro trading may see further increases as the trend towards European assets continues to accelerate. According to the latest global fund manager survey conducted by Bank of America, global fund managers continue to increase their investments in European assets, with little indication of an imminent shift in their fortunes. The July survey shows the highest overweight in Eurozone equities since July 2021, with a net overweight percentage of 41%, up from just 1% at the beginning of the year.

According to performance on trusted currency trading platforms, the Euro itself saw its highest overweight since January 2005, with a net overweight percentage of 20% of fund managers. This represents a positive shift in investor sentiment compared to the 18% low recorded in January. At the same time, 31% of fund managers consider the Euro undervalued, while 47% consider the US dollar overvalued.

“Shorting the US dollar” has been described as the most crowded trade for the first time in the survey’s history, which is something to consider in the short term, as extremes in trading positions can be considered a contrarian indicator for an imminent market reversal. However, strong demand for hedges against US dollar weakness may limit the dollar’s ability to recover, reinforcing the advance of the EUR/USD exchange rate towards the psychological 1.20 resistance.

According to the report, the proportion of fund managers looking to increase their hedges against a weaker dollar reached 33% in July, down slightly from 39% in June, while 41% reported that they do not plan any changes to their foreign exchange hedging ratios.

Ready to trade our daily Forex forecast? Here’s a list of some of the best regulated forex brokers to check out.

Source link

Go to Top