About Editorial team of BIPNs

Main team of content of bipns.com. Any type of content should be approved by us.
6 07, 2025

Solana Dominates DApp Revenue with $570 Million in Q2 2025, 46.3% Market Share

By |2025-07-06T22:59:46+03:00July 6, 2025|News, NFT News|0 Comments


Solana has once again proven its dominance in the decentralized application (DApp) revenue rankings, generating over $570 million in revenue in the second quarter of 2025. This figure not only surpasses the combined revenue of all other blockchain networks but also marks the fifth consecutive quarter that Solana has outperformed its competitors in DApp revenue. This achievement underscores the growing adoption and utility of the Solana blockchain, which has become a preferred platform for developers and users alike.

The surge in revenue for Solana-based DApps can be attributed to several factors. Firstly, the Solana network is known for its high transaction speed and low fees, making it an attractive option for developers looking to build scalable and efficient applications. Secondly, the ecosystem around Solana has been rapidly expanding, with a growing number of projects and partnerships that have contributed to its success. This includes a diverse range of applications, from decentralized finance (DeFi) platforms to non-fungible token (NFT) marketplaces, all of which have benefited from the network’s robust infrastructure.

Despite a 52.2% annual decrease in DApp revenues, Solana maintained its leadership position. This is a testament to the network’s resilience and the continued trust of its user base. The striking point is that Solana’s revenue share was 46.3%, almost three times the 17.3% share of second-place Ethereum. Ethereum generated $213 million in app revenue this quarter, followed by Tron with $165 million and BNB with $150 million. This highlights the significant gap between Solana and its competitors, further cementing its position as the leading platform for DApp revenue.

The significance of Solana’s achievement extends beyond just financial metrics. It highlights the broader trend of decentralized technologies gaining traction in the real world. As more users and developers embrace blockchain solutions, the demand for efficient and reliable platforms like Solana is likely to continue growing. This trend is particularly notable in the context of the broader cryptocurrency market, where established players like Bitcoin and Ethereum have long dominated the conversation. However, the rise of altcoins like Solana indicates a shift towards more specialized and innovative solutions that cater to specific use cases and user needs.

The success of Solana also raises important questions about the future of decentralized technologies. As the ecosystem continues to evolve, it will be crucial for platforms like Solana to maintain their competitive edge by innovating and adapting to changing market conditions. This includes not only technical advancements but also strategic partnerships and community engagement. By doing so, Solana can continue to lead the way in the DApp revenue rankings and solidify its position as a key player in the decentralized technology landscape.



Source link

6 07, 2025

Here’s What XRP Could Be Worth If It Handles 25% of Global Remittances by 2029

By |2025-07-06T22:42:11+03:00July 6, 2025|Crypto News, News|0 Comments

What could XRP price be if it handled 25% of the projected value of global remittances by 2029, especially if the market fully priced in its value?

Notably, crypto proponents believe XRP remains undervalued, especially when you consider its speed, scalability, and growing role in cross-border payments. Currently changing hands at $2.22, it still trades below what some say reflects its real-world use. 

Specifically, Ripple continues to build partnerships across key regions, but the market has yet to fully recognize the long-term value behind that adoption.

XRP Set to Capture a Growing Remittance Market

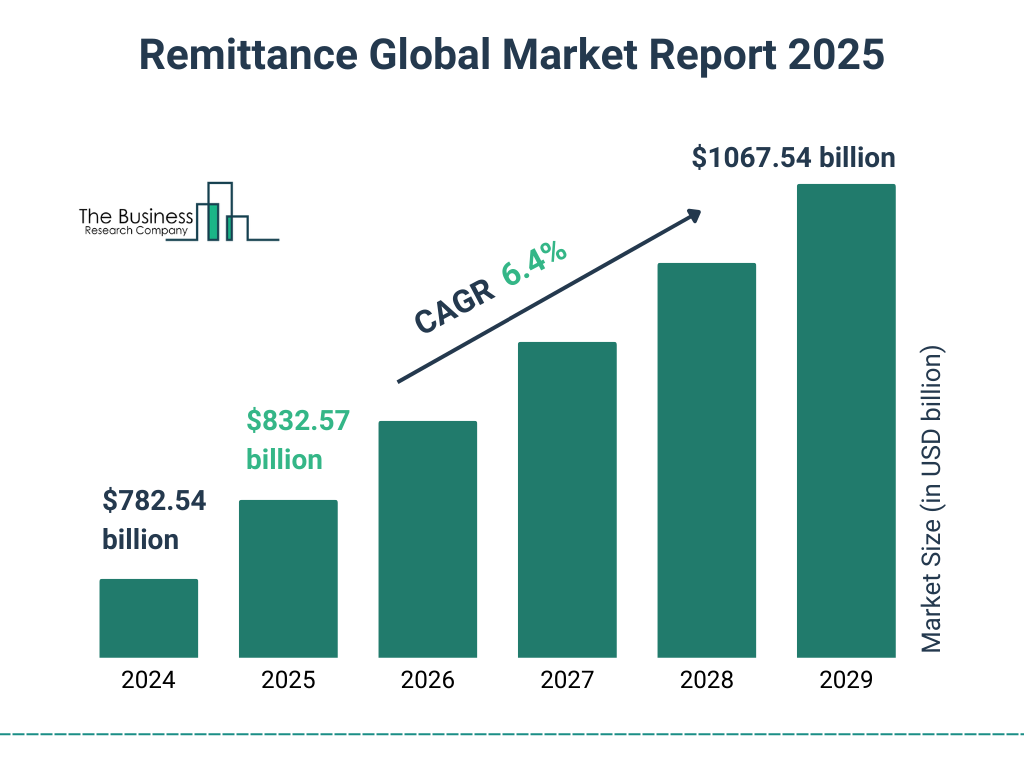
Meanwhile, the remittance market keeps expanding. According to recent projections, the global remittance industry will grow from $782.54 billion in 2024 to $832.57 billion in 2025, marking a steady 6.4% annual growth rate. That same growth pace should carry the industry to about $1.067 trillion by 2029. 

Remittance Market Size and growth rate 2025 to 2029: Graph

A recent business report suggested that factors such as rising migration, economic gaps between countries, and the spread of mobile and digital financial services could trigger this growth. 

Amid the projected expansion, Ripple has set itself up to take advantage of the change. Specifically, the company has already secured partnerships in high-remittance markets such as Brazil, Mexico, the UAE, Saudi Arabia, Vietnam, and the Philippines. 

Ripple leverages XRP because it processes transactions in seconds using a consensus mechanism that doesn’t rely on energy-heavy mining. The network can handle thousands of transactions per second, making it suitable for the high-volume demands of international payments. 

Moreover, legal clarity has improved, particularly in the U.S., where XRP is no longer treated as a security in retail sales. Importantly, this will allow more financial institutions to now use XRP without fear of regulatory pushback.

XRP Price if It Handles 25% of Global Remittances by 2029

With such an expected growth, we assessed where XRP’s price could go if it plays a major role in global remittances, leveraging a market share-based model. 

Instead of just measuring how much money XRP could move, this model estimates how the market might value its network in line with how investors typically value remittance and payment companies like Visa, PayPal, or Western Union. 

Most of these companies trade at valuations equal to one to three times their annual payment volume. For this analysis, we used a middle-ground 2x multiplier on the projected 2029 remittance volume of $1.067 trillion. This gives the remittance industry an estimated market capitalization of $2.134 trillion by 2029.

If XRP captures 25% of that market cap, it would represent a network value of $533.5 billion. With a circulating supply of 60 billion XRP, the token would need to trade at $8.89 to reflect that value. This alone would mark a strong price increase from its current level.

However, this estimate only reflects XRP’s practical use. In crypto, real-world utility often drives more demand, which in turn brings extra buying pressure. If growing adoption and investor confidence add just a 4x demand premium, XRP’s price could rise to $35.56.

DisClamier: This content is informational and should not be considered financial advice. The views expressed in this article may include the author’s personal opinions and do not reflect The Crypto Basic opinion. Readers are encouraged to do thorough research before making any investment decisions. The Crypto Basic is not responsible for any financial losses.

Source link

6 07, 2025

Natural gas price faces the negative pressure– Forecast today – 4-7-2025

By |2025-07-06T20:54:49+03:00July 6, 2025|Forex News, News|0 Comments


The EURJPY pair formed a new bullish attack, taking advantage of the repeated positive pressure, to attack the resistance of the bullish channel’s resistance at 170.60, achieving the suggested target in the previous report.


The price might be forced to provide mixed trading due to the strength of the current resistance besides stochastic attempt to exit the overbought level, to increase the chances of activating the attempts of gathering the gains by targeting 169.20 and 168.60 level, while breaching the resistance and holding above it will open the way for recording new gains that might extend to 171.10 and 171.60.


The expected trading range for today is between 169.20 and 170.60


Trend forecast: Fluctuated within the bullish track


Source link

6 07, 2025

XRP Rallies Toward $2.30 as Symmetrical Triangle Nears Resolution

By |2025-07-06T20:41:08+03:00July 6, 2025|Crypto News, News|0 Comments

After weeks of range-bound movement, XRP price is gaining momentum as it tests the upper trendline of a symmetrical triangle formation. XRP price today has moved above $2.26 with volume support and a clean break above short-term resistance at $2.24. Traders are watching this zone closely as the breakout attempt from the long-standing compression structure continues to unfold.

What’s Happening With XRP’s Price?

XRP has been trading inside a multi-month symmetrical triangle since its November 2024 peak near $3.60. This structure has compressed volatility into a tightening apex, now approaching its final phase. As of July 6, XRP has tagged the upper boundary of the triangle while holding above the rising support base at $2.05.

The daily TSI shows a shallow positive crossover forming, indicating the first early sign of momentum return. Meanwhile, Parabolic SAR dots have flipped below price action, further hinting that bullish control may be building. A breakout above the $2.30–$2.34 region would confirm the pattern and potentially open the path to $2.58 and $3.00.

Why Is The XRP Price Going Up Today?

The post XRP Price Prediction for July 7, 2025: XRP Rallies Toward $2.30 as Symmetrical Triangle Nears Resolution appeared first on Coin Edition.

Source link

6 07, 2025

XAG/USD advance stalls near $37.00 as holiday lull masks bullish setup

By |2025-07-06T18:53:48+03:00July 6, 2025|Forex News, News|0 Comments


  • Silver forms double-bottom near key support, signaling a potential breakout above $37.31.
  • Doji candle and thin US holiday volume suggest pause, not reversal.
  • Bulls eye resistance at $37.49 and $38.00; downside risk begins below $36.00.

Silver price traded sideways on Friday, remaining virtually unchanged at $36.84, due to thin trading volumes as US markets were closed for a holiday. The market mood turned slightly sour as headlines surrounding the US trade war, with its trading patterns taking center stage, following the approval of the One Big Beautiful Bill.

XAG/USD Price Forecast: Technical Outlook

From a technical standpoint, the grey metal is pausing its advance, although it remains upwardly biased as it has formed a double-bottom chart pattern. Nevertheless, the formation of a doji suggests that a pause is underway, as traders eye key resistance levels, such as the year-to-date (YTD) high of $37.31.

Momentum is bullish as depicted by the Relative Strength Index (RSI). That said, the path of least resistance is upwards.

Silver key resistance level to watch would be $37.00, the YTD high, and the February 29, 2012, at $37.49. Once cleared, the next stop is $38.00. On the other hand, if XAG/USD falls below $36.00, it clears the path for testing $35.82. Once hurdled, the next stop would be $35.00, before challenging the 50-day Simple Moving Average (SMA) at $34.39.

XAG/USD Price Chart – Daily

Silver FAQs

Silver is a precious metal highly traded among investors. It has been historically used as a store of value and a medium of exchange. Although less popular than Gold, traders may turn to Silver to diversify their investment portfolio, for its intrinsic value or as a potential hedge during high-inflation periods. Investors can buy physical Silver, in coins or in bars, or trade it through vehicles such as Exchange Traded Funds, which track its price on international markets.

Silver prices can move due to a wide range of factors. Geopolitical instability or fears of a deep recession can make Silver price escalate due to its safe-haven status, although to a lesser extent than Gold’s. As a yieldless asset, Silver tends to rise with lower interest rates. Its moves also depend on how the US Dollar (USD) behaves as the asset is priced in dollars (XAG/USD). A strong Dollar tends to keep the price of Silver at bay, whereas a weaker Dollar is likely to propel prices up. Other factors such as investment demand, mining supply – Silver is much more abundant than Gold – and recycling rates can also affect prices.

Silver is widely used in industry, particularly in sectors such as electronics or solar energy, as it has one of the highest electric conductivity of all metals – more than Copper and Gold. A surge in demand can increase prices, while a decline tends to lower them. Dynamics in the US, Chinese and Indian economies can also contribute to price swings: for the US and particularly China, their big industrial sectors use Silver in various processes; in India, consumers’ demand for the precious metal for jewellery also plays a key role in setting prices.

Silver prices tend to follow Gold’s moves. When Gold prices rise, Silver typically follows suit, as their status as safe-haven assets is similar. The Gold/Silver ratio, which shows the number of ounces of Silver needed to equal the value of one ounce of Gold, may help to determine the relative valuation between both metals. Some investors may consider a high ratio as an indicator that Silver is undervalued, or Gold is overvalued. On the contrary, a low ratio might suggest that Gold is undervalued relative to Silver.


Source link

6 07, 2025

Cardano (ADA) Price Prediction for July 6

By |2025-07-06T18:40:11+03:00July 6, 2025|Crypto News, News|0 Comments

The end of the week has turned out to be bullish for the market, according to CoinStats.

ADA chart by CoinStats

ADA/USD

The price of Cardano (ADA) has gone up by 2.32% over the last 24 hours.

Article image
Image by TradingView

On the hourly chart, the rate of ADA might have set a local resistance of $0.5906. As most of the ATR has been passed, any sharp moves are unlikely to happen by tomorrow.

Article image
Image by TradingView

On the bigger time frame, neither buyers nor sellers are dominating as the price is far from the main levels.

You Might Also Like

Title news

The volume keeps going down, which means ongoing sideways trading in the narrow range of $0.58-$0.60 is the more likely scenario.

Article image
Image by TradingView

From the midterm point of view, the picture is similar. The weekly bar is about to close neutral, which means traders are unlikely to witness increased volatility next week.

ADA is trading at $0.5847 at press time.

Source link

6 07, 2025

Global matcha ‘obsession’ drinks Japan’s tea farms dry

By |2025-07-06T16:44:29+03:00July 6, 2025|Dietary Supplements News, News|0 Comments


At a minimalist Los Angeles matcha bar, powdered Japanese tea is prepared with precision, despite a global shortage driven by the bright green drink’s social media stardom.

Of the 25 types of matcha on the menu at Kettl Tea, which opened on Hollywood Boulevard this year, all but four were out of stock, the shop’s founder Zach Mangan said.

“One of the things we struggle with is telling customers that, unfortunately, we don’t have” what they want, he said.


Source link

6 07, 2025

XRP Surges 2% in 24 Hours Amid Bullish Technical Signals

By |2025-07-06T16:38:25+03:00July 6, 2025|Crypto News, News|0 Comments

XRP, the cryptocurrency associated with Ripple, has been experiencing a period of consolidation following a significant surge. Currently trading at $2.27, XRP has seen a nearly 2% increase in the last 24 hours and over 3% growth in the past week. This momentum is driven by heightened speculation from technical analyst Crypto Michael, who has highlighted XRP’s long-term consolidation phase.

According to Crypto Michael, XRP has been compressing within a symmetrical triangle for seven years before breaking out in late 2024. This breakout resulted in a 700% surge from approximately $0.60 to over $2.00. Since then, XRP has been range-bound for seven months, a phase Michael describes as “healthy consolidation.” The chart indicates that prices are stabilizing just above key resistance levels, suggesting that this consolidation phase is nearing completion.

XRP’s technical stability is occurring while Bitcoin hovers near its own historic resistance—an 8-year trendline. Michael suggests that Bitcoin’s move above this line could serve as the macro trigger that lifts altcoins, such as XRP, into a fresh leg higher. This correlation between Bitcoin and XRP is crucial for understanding the potential for a bullish breakout in XRP.

On the 4-hour chart, the XRP price prediction appears bullish. XRP has reclaimed the $2.2175 level, now acting as short-term support. The price is also riding along a well-defined ascending trendline from late June, creating a pattern of higher lows. This bullish structure is reinforced by a recent bullish engulfing candle and a rising Relative Strength Index (RSI), which now approaches the 60 mark but remains below overbought levels.

The 50-SMA currently sits at $2.2175 and has been reclaimed, a positive signal for trend continuation. XRP is also reclaiming the mid-range of its prior swing, positioning it well for a breakout above $2.285. Key technical takeaways include XRP/USD trading bullish above the 50-SMA and ascending trendline, with the RSI rising, indicating growing bullish momentum. Resistance levels are at $2.285, followed by $2.337 and $2.406, while support levels are at $2.2175, $2.146, and $2.080.

If XRP holds above $2.2175 and gains traction beyond $2.285, traders could see a push toward the $2.40–$2.47 range. This setup favors breakout traders looking for confirmation and continuation. As XRP approaches $2.285 resistance, volume and candle structure will be key. Entry points for a long position are suggested between $2.27 and $2.29 on a strong breakout close, with targets set at $2.337 to $2.406 and a stop-loss below $2.21 to manage downside risk.

With the RSI rising, price above trendline support, and consolidation nearing its end, XRP appears well-positioned for a decisive move—especially if Bitcoin breaks its own resistance in tandem. This analysis underscores the potential for a significant upward movement in XRP, driven by both technical indicators and broader market dynamics.

Source link

6 07, 2025

Euro to dollar forecast: Third-party price target

By |2025-07-06T14:50:54+03:00July 6, 2025|Forex News, News|0 Comments

EUR/USD prediction: Analysts’ outlook

Analysts remained divided in 2025 on the near-term EUR forecast, with monetary policy divergence and growth differentials driving sentiment.

Wells Fargo expected the Fed to begin easing in September with 75 bps of total cuts by year-end, citing a likely slowdown in growth and labour market cooling. By contrast, the ECB has already cut 200 bps since late 2024 and may be nearing the end of its cycle. ‘We see just one final 25 bps ECB rate cut, to 1.75%, in September,’ the bank noted.

Trading Economics saw signs of stabilisation in the eurozone, with inflation expectations falling and 2025 GDP forecast at 0.9%. The June PMI rose to 40.5 – the slowest decline in nearly three years – and business confidence hit a three-year high.

In the US, the Fed held rates steady at 4.25%-4.50% for a fourth meeting in June. Growth is now seen at 1.4% for 2025, with PCE inflation forecast at 3.0%. Trading Economics noted a cautious stance as policymakers assess the economic impact of President Trump’s policies on tariffs, immigration, and taxation.

Meanwhile, S&P Global’s US Manufacturing PMI held at 52 in June, signalling modest growth, though some analysts warned the recent strength may be short-lived. “Such a boost is likely to unwind in the coming months,” said S&P Global’s Chris Williamson.

Capital.com analyst input: Daniela Hathorn

On 1 July, Capital.com analyst Daniela Hathorn said the euro is expected to stay ‘moderately bullish’ in the second half of 2025, supported by signs of eurozone resilience. With ECB rates at 2% as of June, she noted that the bank can now take ‘a more conservative approach going forward’. This front-loaded stance, she said, had been ‘widely celebrated by euro traders’, giving the currency an extra boost.

At the same time, she highlighted that the US dollar had come under ‘significant downside pressure’ due to President Trump’s trade policies, helping lift EUR/USD above 1.17 – its highest level since September 2021.

‘A recovery in European industrial output or improved risk sentiment from continued easing geopolitical tensions could bolster the pair above the 1.18 level,’ Hathorn added. But she warned of lingering risks tied to US trade talks and ‘fragile peace dynamics in the Middle East and Eastern Europe’.

Is the US dollar losing its crown?

Forecasts remain subject to change and should not be used as a substitute for your own market research. Always consider your risk tolerance and trading strategy before trading or investing.

Source link

6 07, 2025

Cardano Price Prediction & Upcoming Updates To Keep An Eye On

By |2025-07-06T14:37:26+03:00July 6, 2025|Crypto News, News|0 Comments

The latest Cardano price prediction has rekindled interest with ADA changing hands at $0.5739, up 1.19%. While optimism is once again building, the general market climate — especially Cardano’s lower trading volume — is causing analysts to tread carefully with expectations. Nevertheless, attention is starting to divert, with some watchers now keeping an eye on newer names like Remittix for more volatile upside in Q3.

What’s Driving Current Cardano Price Prediction Sentiment?

Analysts remain divided on where Cardano goes next. As it currently sits at a market cap of $20.3 billion and a 35.46% drop in trading volume, short-term volatility is keeping expectations in check.

Some bullish estimates foresee that ADA could burst through $0.65 if general sentiment becomes positive. Others warn that without a driver — such as the highly-anticipated governance upgrades — momentum can stall again before any breakout.

Future Cardano Upgrades Could Alter Momentum

The Cardano price prediction could alter depending on what the development team does in the future. ADA’s latest development under the Voltaire era is to move governance completely to the community.

Cardano’s new approach to decentralized governance and staking rewards continues to attract developers. But the market is hungry for more concrete, real-world applications. Otherwise, ADA might fall behind other Layer-1s that are shipping faster and getting more users on board.

Until then, ADA’s price might trade in a tight range, absent whale activity or macro trends inciting wider market action.

Why Traders Are Following Remittix (RTX) Instead

While ADA holders wait for movement, investors looking for high-growth potential are looking to Remittix (RTX) — a crypto-to-fiat remittance platform that’s gaining serious traction.

Remittix allows users to send crypto like BTC and ETH directly to bank accounts worldwide in minutes. That’s not hype — it’s a real-world use case that simplifies an enormous pain point in cross-border payments.

The project has already raised over $15.9 million, 548 million+ tokens sold, and a current price of $0.0811. On top of that, purchasers currently have a 50% token bonus as Remittix targets its $18 million softcap target.

And also: the official Remittix wallet was recently released, with a Q3 launch pending. This positions Remittix to start producing real user activity and potential revenue — something that many altcoins can’t say even years after launching.

With such a clear roadmap, real use, and strong community backing, Remittix stands to be one of this cycle’s biggest winners. Some analysts believe RTX could follow a similar trajectory as early XRP or Stellar but at a faster rate. 

ADA vs Remittix: Where Is the Smarter Play?

If your goal is long-term portfolio strength, both ADA and Remittix deliver — just for entirely different reasons. Cardano remains a good legacy Layer-1 with a committed team and ecosystem.

But for pure upside and growth momentum, Remittix is getting hard to ignore. With product launches, plausible adoption potentials, and a working model, RTX is marking all of the boxes for a 2025 breakout altcoin.

Whether you’re a Cardano loyalist or just exploring newer projects, keeping an eye on both could be a smart move — especially as the market heats up again in Q3.

Join the Remittix (RTX) presale and community: 

Join Remittix (RTX) Presale

Join the Remittix (RTX) Community

Source link

Go to Top