The main category of Crypto News.
You can use the search box below to find what you need.
[wd_asp id=1]
The main category of Crypto News.
You can use the search box below to find what you need.
[wd_asp id=1]
Key takeaways
The Ethereum network, launched in 2015, is a decentralized platform that enables developers to create smart contracts and dApps using blockchain technology without intermediaries, enhancing security. The Ethereum blockchain is accessible to everyone and built to support scalability, programmability, security, and decentralization, allowing for the creation of secure digital technology. Its native digital currency, ether (ETH), and smart contracts have attracted investors’ recognition and interest, while developers appreciate its utility in developing blockchain and decentralized finance applications. It also helps traders trade Ethereum more easily.
So, what can traders and investors expect in the coming months and years? “Is ETH likely to go up? What will ETH be worth in 5 years?”
Let’s get into the details by exploring Ethereum’s price predictions from 2025 through 2031.
| Cryptocurrency | Ethereum |
| Symbol | ETH |
| Current price | $4,474 |
| Market cap | $539.76B |
| Trading volume (24-hour) | $25.69B |
| Circulating supply | 120.7M |
| All-time high | $4,891 on Nov 16, 2021 |
| All-time low | $0.4209 on Oct 22, 2015 |
| 24-hour high | $4,497 |
| 24-hour low | $4,338 |
| Metric | Value |
| Price volatility | 9.30% |
| 50-day SMA | $ 3,973 |
| 200-day SMA | $ 2,789 |
| Sentiment | Bullish |
| Fear and Greed Index | 48 (Neutral) |
| Green days | 13/30 (43%) |
Ethereum’s 1-day chart on Aug 31 shows a cautiously optimistic outlook. The price is trading at $4,469, showing resilience after bouncing near the middle Bollinger Band support at $4,488. The upper band at $4,869 remains a strong resistance level to reclaim before testing the psychological $5,000 barrier.
RSI sits around 57, suggesting moderate bullish momentum without being overbought. MACD, though still positive, shows narrowing gaps, hinting at weakening strength unless a surge in volume confirms continuation. If ETH maintains above $4,450, bulls may attempt another push higher. A drop below $4,100, however, could shift control back to sellers and deepen consolidation.
On the 4-hour chart, Ethereum (ETH) is trading near $4,475, showing consolidation after recent volatility. The Bollinger Bands are tightening, indicating reduced volatility and a potential breakout. ETH is hovering close to its mid-band at $4,421, with resistance around $4,566 and support near $4,277

The MACD histogram is turning slightly positive, hinting at a potential momentum shift, though the signal lines remain weak. Balance of Power indicates indecision, suggesting neither buyers nor sellers dominate. If ETH breaks above $4,566, bullish momentum could extend, but a drop below $4,277 may trigger renewed downside pressure in the short term.
| Period | Value ($) | Action |
| SMA 3 | 3,504.67 | BUY |
| SMA 5 | 3,993.63 | BUY |
| SMA 10 | 4,310.03 | BUY |
| SMA 21 | 4,379.16 | BUY |
| SMA 50 | 3,973.17 | BUY |
| SMA 100 | 3,278.07 | BUY |
| SMA 200 | 2,789.00 | BUY |
| Period | Value ($) | Action |
| EMA 3 | 4,240.10 | BUY |
| EMA 5 | 3,959.27 | BUY |
| EMA 10 | 3,432.51 | BUY |
| EMA 21 | 2,856.61 | BUY |
| EMA 50 | 2,500.42 | BUY |
| EMA 100 | 2,555.16 | BUY |
| EMA 200 | 2,710.14 | BUY |
On the 1-day chart, Ethereum is trading around $4,469, holding above the mid-Bollinger Band near $4,488, suggesting buyers are still active despite recent volatility. RSI at 57.55 points to neutral momentum, leaving room for either continuation or retracement. On the 4-hour chart, ETH trades at $4,475, moving within a compressed Bollinger range between $4,277 and $4,566, reflecting consolidation after a period of weakness. The MACD is stabilizing, showing fading bearish pressure and the possibility of a crossover. Overall, ETH remains in a consolidation phase, with the next breakout direction dependent on whether buyers defend support or sellers force a breakdown.
Ethereum is the largest DeFi hub with a vibrant layer-two ecosystem in the crypto market. The blockchain constantly develops, making it a go-to choice for many Web3 developers. ETH, its native token, shows promise, and the possibility of an Ethereum ETF approval makes it favorable for day traders. Over the long term, explore our price predictions. However, the opinions expressed are not investment advice; traders should consider researching before investing.
The realistic price for Ethereum in 2025 is around $5,019 at the maximum.
One Ethereum is expected to be worth $36,694 maximum in 2030.
Ethereum’s price potential depends on multiple factors, including market trends, institutional adoption, network upgrades, and macroeconomic conditions. Realistically, ETH could reach $5,000 to $7,000 in the next bullish cycle if demand increases and Ethereum’s Layer 2 solutions and scalability improvements boost adoption.
If institutional interest strengthens, ETH may push past $10,000 over the long term, especially if Ethereum remains the dominant smart contract platform. However, volatility remains a key risk, with price corrections likely along the way. Regulatory clarity and Ethereum’s shift to proof-of-stake (PoS) efficiency could also positively influence its long-term valuation.
Ethereum is projected to exceed $10,000 as early as 2027, with its potential low starting at $10,133 and a high of $11,875.
Ethereum is predicted to surpass the $25,000 level by 2029 and reach a potential high of $25,866. This optimistic outlook is based on Ethereum’s ongoing development, network security, and increasing adoption. However, cryptocurrency markets are highly volatile, so long-term projections should be cautiously approached.
Based on our analysis, Ethereum will likely reach the $40,000 mark. The highest expected price is around $51,567 in 2031.
Most well-known altcoins are trading at lower levels, but ETH is trading above its average price of the last two years. However, a positive outbreak can be expected. The ETH/USD pair is expected to reach the $56,126 mark by 2031, so holding it longer can be beneficial.
Ethereum Celebrates 10 Years as DeFi’s Foundation
Ethereum marks its 10th anniversary, transforming from a visionary whitepaper into the backbone of decentralized finance. Since its launch, Ethereum has enabled billions in value to move seamlessly across a vibrant DeFi ecosystem. The transition to proof-of-stake following The Merge has established staking as a core network feature, attracting over one million validators who now secure the network. Institutions increasingly choose platforms like Figment to stake, citing non-custodial options, SOC 2 Type II compliance, robust MEV policies, and audit-ready reporting. As Ethereum enters its second decade, it continues to shape an open, secure financial future.
In August 2025, Ethereum is projected to reach a minimum price of $3,772, an average price of $4,125, and a maximum price of $4,243
| Price Prediction | Potential Low ($) | Average Price ($) | Potential High ($) |
| August 2025 | $3,772 | $4,125 | $4,243 |
Changes within Ethereum itself and the larger market will affect its path in 2025. Vitalik Buterin’s RISC-V project could make Ethereum’s infrastructure stronger, which could bring in more developers and make it easier to scale.
If Ethereum can successfully roll out protocol upgrades and more people start using Layer 2, momentum could return. Market rules, business integration, and trends in the crypto industry will also be very important. While positive predictions say prices could reach $6,000, bearish conditions could bring ETH down to $4,531.
| Year | Potential Low ($) | Average Price ($) | Potential High ($) |
| 2025 | $4,531 | $4,688 | $5,019 |
| Year | Potential Low ($) | Average Price ($) | Potential High ($) |
| 2026 | $6,962 | $7,150 | $7,896 |
| 2027 | $10,133 | $10,491 | $12,070 |
| 2028 | $14,529 | $14,949 | $17,204 |
| 2029 | $21,185 | $21,932 | $25,866 |
| 2030 | $30,372 | $31,250 | $36,694 |
| 2031 | $45,184 | $46,747 | $51,567 |
The lowest price Ethereum is expected to reach in 2026 is $6,962. The ETH price could go as high as $7,896, with an average forecast price of $7,150.
According to the forecast price and technical analysis, Ethereum’s price is expected to drop to at least $10,133 in 2027. The average price of ETH is $10,491, but it can go as high as $12,070.
In 2028, the price of one Ethereum is expected to be at least $14,529. The average price of ETH in 2028 will be $14,949, but the highest price could be $17,204.
It is expected that the price of Ethereum to be at least $21,185 in 2029. The average trading value of Ethereum in USD is $21,932, but the price can go as high as $25,866.
By 2030, Ethereum’s forecast minimum price could rise to $30,372, while the expected average trading price is projected at $31,252. A potential high that may reach $36,694 showcases Ethereum’s increasing appeal to investors.
According to the forecast and technical analysis, the price of Ethereum should be at least $45,184 in 2031. The average price of ETH is $46,747, but it can go as high as $51,567.

| Firm Name | 2025 | 2026 |
| DigitalCoin Price | $7,568.11 | $8,954.29 |
| Coincodex | $ 5,848.26 | $ 6,245.61 |
Cryptopolitan forecasts Ethereum’s price to range between $3,646 and $4,161 by the end of 2025. By 2031, prices may surge and trade at $43,075.

Zach Anderson
Sep 01, 2025 11:39
MATIC price prediction shows potential 32-53% upside to $0.50-$0.58 range by October 2025, contingent on breaking $0.43 resistance amid current technical challenges.
The Polygon ecosystem continues to face technical headwinds as MATIC trades at $0.38, sitting 70% below its 52-week high of $1.27. Despite current bearish momentum indicators, multiple analyst predictions suggest potential recovery scenarios that could drive significant upside in the coming months.
• MATIC short-term target (1 week): $0.40-$0.42 (+5-11%)
• Polygon medium-term forecast (1 month): $0.50-$0.58 range (+32-53%)
• Key level to break for bullish continuation: $0.43 (SMA 20)
• Critical support if bearish: $0.33-$0.35
The latest MATIC price prediction consensus from leading analysts reveals cautious optimism for Polygon’s recovery. Blockchain.News maintains a conservative Polygon forecast targeting $0.50-$0.58 in the medium term, representing potential 32-53% upside from current levels. This prediction hinges on MATIC breaking above the critical $0.43 resistance level.
More optimistic projections come from CoinGenius, whose MATIC price prediction extends to $1.70-$2.10 for medium-term scenarios. However, this bullish case requires MATIC to first defend the $0.33-$0.35 support zone and subsequently break through multiple resistance levels at $0.58, $0.69, and $1.00.
PricePredictions.com offers a MATIC price target of $0.785114 for September 2025, suggesting an average trading price around $0.70006. This represents the most aggressive near-term prediction among recent analyst forecasts.
Current Polygon technical analysis reveals mixed signals that support a cautious but optimistic outlook. MATIC’s RSI at 38.00 sits in neutral territory, avoiding oversold conditions that could trigger immediate selling pressure. However, the MACD histogram at -0.0045 indicates persistent bearish momentum that needs to reverse for sustained upside.
The Bollinger Bands positioning shows MATIC at 0.29 within the bands, closer to the lower band at $0.31 than the upper band at $0.56. This positioning often precedes mean reversion moves toward the middle band at $0.43, which aligns with the critical resistance level identified by analysts.
Volume analysis on Binance shows relatively low trading activity at $1.07 million in 24-hour volume, suggesting consolidation rather than active distribution. This low-volume environment could facilitate sharp moves once directional momentum emerges.
The primary MATIC price target in a bullish scenario centers on the $0.50-$0.58 range, requiring a break above the SMA 20 at $0.43. Technical confluence at $0.50 includes the midpoint between current price and the upper Bollinger Band, making it a logical first target.
Sequential resistance levels create a roadmap for extended upside: $0.58 represents the immediate resistance and upper Bollinger Band, followed by $0.69 (SMA 200) and psychological $1.00. The most optimistic scenarios targeting $1.70-$2.10 would require broad crypto market recovery and specific Polygon ecosystem catalysts.
Downside risks materialize if MATIC fails to hold the $0.35 immediate support level. A break below this level targets the strong support at $0.33, representing the lower boundary of analyst support zones. Further breakdown could test the 52-week low at $0.37, though current price proximity suggests limited additional downside.
The stochastic indicators (%K at 25.19, %D at 19.74) remain in oversold territory, indicating potential for short-term bounces that could limit downside momentum.
Current technical levels suggest a buy or sell MATIC decision should focus on risk-defined entries near support levels. Conservative buyers might consider accumulating between $0.35-$0.38, using the $0.33 level as a stop-loss for 8-13% maximum downside risk.
More aggressive traders could wait for a break above $0.43 with volume confirmation before entering, targeting the $0.50-$0.58 range for 16-36% potential upside. This approach trades lower risk for reduced upside potential but offers better probability of success.
Position sizing should account for MATIC’s current volatility (ATR of $0.03) and the distance from major moving averages, suggesting 2-3% portfolio allocation maximum for most investors.
The MATIC price prediction for the next 1-2 months targets $0.50-$0.58 with medium confidence, representing 32-53% upside potential. This Polygon forecast depends critically on breaking above $0.43 resistance and maintaining support above $0.33.
Key indicators to monitor include RSI movement above 50, MACD histogram turning positive, and sustained trading volume above $2 million daily. Failure to break $0.43 within the next two weeks would invalidate the bullish scenario and potentially trigger retests of $0.33 support.
The prediction timeline extends through October 2025, with initial confirmation signals expected within 7-14 days based on current momentum patterns and analyst consensus views.
Image source: Shutterstock
Updated Sep 1, 2025, 1:36 p.m. Published Sep 1, 2025, 1:36 p.m.
More For You
XRP Price Holds Near $2.75 as Analyst Maps Path Between $2.40 Risk and $3.70 Upside
XRP trades around $2.75 after intraday swings, with Martinez warning of a $2.40 downside risk if support fails and outlining a bullish path toward $3.70.
What to know:
Cardano (ADA) is entering Q4 2025 at a decisive moment, with traders weighing fresh institutional interest against months of sideways consolidation. ADA price today is holding key support levels, and analysts suggest that a breakout could fuel gains toward $1.30 and beyond.
With optimism building around a potential Cardano ETF and strengthening fundamentals, the next few months could determine ADA’s role in the broader altcoin rally.
Cardano is starting Q4 2025 on an intriguing note as ADA price today holds around $0.80 despite market volatility. After weeks of defending support near $0.79 and $0.75, ADA looks poised for a potential breakout that could shape its trajectory into the year’s final quarter. Traders are closely watching the descending wedge formation, a setup that has historically preceded sharp upward moves in similar assets.
Momentum indicators such as RSI show ADA in oversold territory, suggesting room for recovery. If the bulls succeed in pushing the Cardano price above the $0.94 barrier, the breakout might be as high as $1.32 and even $1.80.
This would mean a 120% rally in the coming months. On the downside, losing the $0.75 support would expose ADA to risks of a retrace near $0.32, but for now, consolidation signals resilience.

Institutional optimism is also fueling momentum. Grayscale’s recent filing for a Cardano ETF boosted approval odds to 87%, making headlines across ADA News. A successful ETF launch could bring significant liquidity, mirroring the institutional inflows seen in Bitcoin and Ethereum after their ETF approvals.
This catalyst positions Cardano as more than just a speculative altcoin. Its ecosystem continues to expand while long-term holders accumulate, showing confidence in ADA price prediction models pointing higher into Q4.
Whether ADA breaks out above key resistance or consolidates longer, the setup for Q4 2025 looks more bullish than bearish, with fundamentals and institutional interest both aligning in Cardano’s favor.

Remittix continues to stand out in a crypto market that often feels crowded by speculation. While ADA price today hovers near support zones as traders debate its Q4 direction, Remittix has already raised $23 million and sold over 637 million tokens at $0.10. The project’s focus on solving real-world remittance bottlenecks gives it a layer of stability that Cardano News and other legacy projects sometimes lack in the short term.
This practical foundation has made investors increasingly view Remittix as a “crypto with utility” rather than just another speculative play. At the same time, Cardano price prediction models show ADA may rally if ETF optimism delivers fresh inflows, but it still depends on technical triggers.
The balance is clear: ADA continues to consolidate, while Remittix actively builds adoption. For Q4 2025, analysts suggest that investors blending proven altcoins with utility-first projects like Remittix could find the best hedge between stability and growth.
Discover the future of PayFi with Remittix by checking out their project here:
Website: https://remittix.io/
Socials: https://linktr.ee/remittix
$250K Giveaway: https://gleam.io/competitions/nz84L-250000-remittix-giveaway
XRP is once again at the center of crypto market discussions as technical analysts highlight a potential correction before the token attempts its next rally.
A widely followed chartist has suggested that XRP price may dip into the $2.2–$2.5 support range, with a bullish reversal expected if this level holds firm.
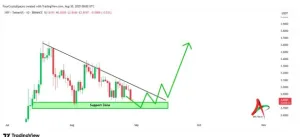
Crypto analyst AlienOvichO recently shared a detailed chart analysis pointing to a “double three” correction forming on the XRP chart. This Elliott Wave pattern, which often appears during prolonged consolidation phases, suggests XRP could enter a multi-step decline before resuming upward momentum.
XRP remains in a double three correction pattern, with the $2.5–$2.2 zone emerging as the next key support area before a potential bullish reversal. Source: AlienOvichO via X
The $2.2–$2.5 range looks like a key accumulation zone, the analyst noted, highlighting a green upward arrow on the chart to suggest a possible rebound from this support.
Academic research supports the method: a 2025 study published in the Journal of Financial Economics found that Elliott Wave patterns correctly forecast price movements in 68% of volatile crypto markets. If the projection holds, investors may view a dip toward this range as a buying opportunity.
The potential reversal zone is further reinforced by Fibonacci retracement levels. According to AlienOvichO, XRP’s decline has lined up with the 61.8% retracement, a level historically associated with price rebounds. Prior supports in this same zone add weight to the outlook.

XRP’s price history suggests a final upward leg, with TradingView data showing its September 1 drop to $2.76 still holding above key supports despite bearish sentiment. Source: EGRAG CRYPTO via X
A 2023 altFINS study revealed that 61.8% retracements acted as effective reversal triggers in 72% of crypto cases examined. This confluence of technical signals strengthens the analyst’s view that XRP could rebound once the correction completes.
Beyond technicals, regulatory risk continues to shape XRP news today. The U.S. Securities and Exchange Commission (SEC) recently delayed its decision on proposed spot XRP ETFs, moving the deadline to October 24, 2025.
Delays of this nature often trigger short-term price pressure. A 2024 report by the National Bureau of Economic Research found that ETF decision postponements were tied to average declines of 15% in altcoin markets. With the Ripple vs. SEC case still casting uncertainty over the token, traders remain cautious.
At the time of writing, the price of XRP today is hovering near $2.73. However, persistent selling pressure has been visible. Coinglass data showed $22.6 million in net outflows on September 1, underscoring liquidity challenges.
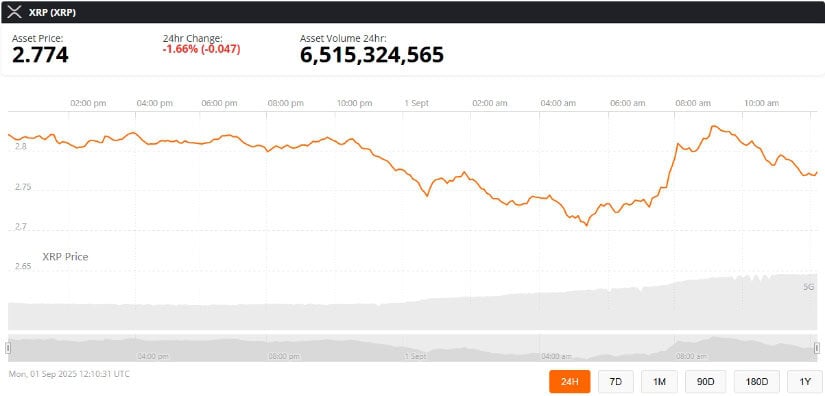
XRP was trading at around $2.77, down 1.77% in the last 24 hours at press time. Source: XRP price via Brave New Coin
On the technical side, XRP continues to battle descending resistance from mid-August, with repeated rejections near $2.95–$3.00. Momentum indicators also lean bearish. The Relative Strength Index (RSI) recently dipped into oversold territory at 28, hinting at exhaustion but also reflecting the depth of current weakness.
Market watchers have identified $2.66 and $2.55 as crucial short-term supports. If XRP manages to hold these levels, analysts expect a rebound toward $2.85–$2.90 in the coming days. Failure, however, could expose $2.30 as the next downside target.
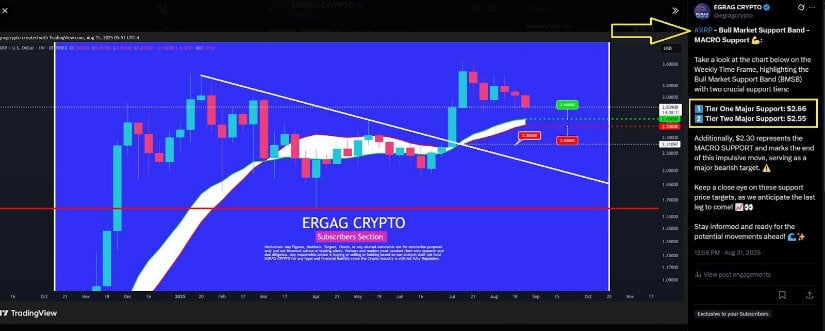
XRP price action remains short-term noise until major structural levels are broken. Source: @egragcrypto via X
EGRAG Crypto, another analyst following XRP predictions, explained that XRP remains within its broader bull market support band: “As long as $2.30 holds, the macro bullish cycle remains valid. Breaking past $3.18 could reignite momentum toward $27 in the longer term.”
The coming weeks could be decisive for XRP. If the XRP crypto price prediction based on Elliott Wave patterns proves accurate, a rebound from the $2.2–$2.5 zone may spark a new leg higher, possibly leading to fresh yearly highs.
However, regulatory developments—particularly any updates on the SEC’s ETF decision—could sway sentiment sharply. Traders are advised to watch both technical structures and news flow closely.
For now, XRP’s consolidation suggests that volatility is far from over. Whether it breaks lower before reversing or stabilizes at current support, the $2.2–$2.5 range will remain the focal point for the XRP community heading into September.
The crypto market is buzzing with activity, and the latest Solana price prediction has analysts forecasting impressive new highs for SOL this cycle. But while the established powerhouse captures headlines, a different kind of opportunity is generating serious excitement among savvy investors. They’re looking for the next wave of explosive growth, and many believe they’ve found it in Layer Brett ($LBRETT), a project that is quickly earning the title of the best meme coin to buy now.
There’s no doubt that Solana is a force to be reckoned with. Its high-speed blockchain, thriving ecosystem, and strong community support are why many analysts remain incredibly bullish on its future. Forecasts for SOL reaching new all-time highs are common, and for many investors, it represents a relatively safe bet in the volatile crypto market.

However, the very size and success of SOL also mean that its days of delivering life-changing 100x returns are likely in the past. For an asset with a multi-billion dollar market cap, growth becomes more incremental. This reality is pushing investors who are chasing exponential gains to look towards emerging low-cap gems with a much higher ceiling for growth.
This is where Layer Brett enters the conversation, not just as another memecoin, but as a strategic alternative for high-growth portfolios. While the Solana price prediction is promising, Layer Brett offers a ground-floor opportunity through its ongoing crypto presale. It represents the chance to get in on a project before it hits the mainstream, a strategy that has created countless crypto millionaires.
What makes it the best meme coin to buy now? It’s a project that fuses the viral, community-driven energy of a meme token with the powerful, real-world utility of an Ethereum Layer 2 network. It’s not just hype; it’s a high-performance blockchain designed to solve the critical issues of speed and cost that have plagued the Ethereum mainnet for years. This is the next evolution of meme-powered crypto.
Unlike first-generation memecoins that were all bark and no bite, Layer Brett is built for performance. As an Ethereum Layer 2, it processes transactions at lightning speed while slashing gas fees to a fraction of a cent. This technical superiority gives it a significant edge, creating a seamless and affordable experience for users.

The project’s ecosystem is designed to reward its community from day one. Early investors in the crypto presale can acquire $LBRETT for just $0.0053 and immediately stake their tokens to earn a massive 1,230% APY. This incredible incentive is backed by a transparent tokenomics model that allocates 25% of the total supply to staking rewards. Furthermore, a $1 million giveaway is planned to supercharge community engagement and growth.
While the future looks bright for SOL, the opportunity for truly explosive returns lies with projects like Layer Brett. It combines a low entry point, superior technology, and a powerful incentive structure to create the perfect storm for a breakout performance. The presale window is limited, and the chance to secure $LBRETT at its lowest price while accessing a stunning APY is quickly slipping away.
Get in now to stake, earn massive rewards, and ride what could be the most scalable meme project ever to launch on Ethereum Layer 2.
Website: https://layerbrett.com
Telegram: https://t.me/layerbrett
X: (1) Layer Brett (@LayerBrett) / X
This article contains information about a cryptocurrency presale. Crypto Economy is not associated with the project. As with any initiative within the crypto ecosystem, we encourage users to do their own research before participating, carefully considering both the potential and the risks involved. This content is for informational purposes only and does not constitute investment advice.
Anything below there opens up a bigger drop toward the $100,000 level, which of course would be a previous support level and an area that I think a lot of people suddenly get interested in. The biggest problem is of course that the overall risk appetite right now is just not good.

So, with that being said, I think you have to look at this as a market that you need to see pick up a little bit of momentum to the upside before you start buying. I don’t know if I would short it, but I certainly wouldn’t be piling in right here considering that we have returned to this level yet again. Longer term, I do think Bitcoin not only comes back to the $120,000 level, but it probably goes much higher than that.
But in the short term, I think we’ve got a situation where you are just waiting to see some type of V pattern, if you will, that you can start buying. So, with that being said, this is a market that has not given you that signal yet. So, a little bit of patience probably goes a long way.
Keep in mind that the NASDAQ 100 and Bitcoin tend to move in the same overall direction, and with that being the case, you have to recognize that we’re in an environment right now where everybody seems to be running for cover. And as long as that’s the case, I don’t think Bitcoin does well.
Ready to trade Bitcoin forex forecast? Here’s a list of some of the best crypto brokers to check out.
Christopher Lewis has been trading Forex and has over 20 years experience in financial markets. Chris has been a regular contributor to Daily Forex since the early days of the site. He writes about Forex for several online publications, including FX Empire, Investing.com, and his own site, aptly named The Trader Guy. Chris favours technical analysis methods to identify his trades and likes to trade equity indices and commodities as well as Forex. He favours a longer-term trading style, and his trades often last for days or weeks.
Polygon (POL), once known as MATIC, is finally waking up after months of quiet trading. Polygon price today jumped nearly 5% to trade around $0.27, sparking excitement in the market. While rising adoption and network demand are fueling this move, the real excitement comes from analysts who see this rally as just the start.
Some are now eyeing a bold target of $1.30 for the POL token.
One of the biggest drivers is the clear growth in activity on the Polygon blockchain. Active addresses are up 25%, climbing from 447,000 to 665,000, while daily transactions have grown nearly 8% to 4 million. This shows that more users are actively relying on the Polygon network.
Another reason for the bullish momentum is Polygon’s upgrade of its PoS USDT to the new USDT0 standard. This move improved transaction efficiency and increased its dominance in stablecoin activity, making the network more attractive for users and investors.
Polygon is also positioning itself as a stablecoin hub in Singapore and Asia more broadly. Data shows strong growth in XSGD stablecoin transfers on the network, with volumes hitting $66 million, $88 million, $74 million, and $94 million in the last four months, reflecting steady growth in usage.
Lastly, market activity around the token itself has been impressive. Polygon’s trading volume has spiked by more than 110% in just the last 24 hours. Such a sharp rise in trading often signals strong investor interest and can directly push prices higher.
Polygon has been stuck in a long downtrend since its 2021 highs. Even when the wider crypto market rallied, POL kept sliding lower, making it feel like the token had spent the bull run in its own bear market.
Analyst Venturefounder says the first real sign of strength would be a move to $0.38, while the key breakout point sits at $0.71. Crossing that level, he believes, would mark the start of a true bull market for Polygon.
Adding to the optimism, analyst Javon Marks points out a strong bullish divergence, a signal that selling pressure is weakening and a reversal may be close. Based on this setup, he suggests POL could climb back to around $1.30, which would mean a 354% gain from current levels.
 Price Prediction Today")
Meanwhile, the Relative Strength Index (RSI) climbed to 42, indicating strengthening momentum.
Stay ahead with breaking news, expert analysis, and real-time updates on the latest trends in Bitcoin, altcoins, DeFi, NFTs, and more.
POL surged 5% to ~$0.27 due to a 25% spike in active addresses, 8% growth in daily transactions, and a 110% trading volume increase in 24 hours.
Polygon (POL) shows strong potential with rising network activity, stablecoin upgrades, and bullish analyst targets. However, it carries typical crypto volatility risks.
Yes. Growing adoption in Asia, increased transactions (4M daily), and its role as a stablecoin hub position Polygon for long-term utility and growth.
Analysts project a rally to $1.30 (354% gain) if key resistance at $0.71 is broken, based on current momentum and network growth trends.
PRESS RELEASE
Published September 1, 2025
Ripple’s XRP price prediction remains a hot topic as the token struggles near the $3 mark, with whales showing cautious moves amid market turbulence. Yet while XRP News points to retraces, big players aren’t sitting idle.
Many are hedging with Remittix (RTX), dubbed “XRP 2.0,” a PayFi project solving real-world cross-border payments. With $23 million raised, Remittix is quickly becoming the hedge whales trust.

The XRP price today is testing investor patience after slipping below the $3 mark, closing near $2.82 in a sharp weekly decline. Despite strong fundamentals like Ripple’s partnership with SBI Holdings to expand RLUSD stablecoin adoption, the bearish sentiment in the wider market has kept bulls on the sidelines. The disconnect between positive Ripple News and weak short-term momentum has many traders reassessing entry points.
Technical indicators add to the caution. The RSI has dipped to 42, pointing to mounting selling pressure, while MACD readings confirm accelerating bearish momentum. XRP News shows whales reducing aggressive trading activity, with inflows into exchanges shrinking significantly. This is often a sign that large holders are holding back supply in anticipation of better prices.
Resistance remains tough around $3.10 to $3.25, while strong support sits at $2.72. A daily close above $2.90 could signal recovery and open the door for a retest of $3.00. On the downside, a failure to defend $2.72 risks pushing the XRP price prediction closer to $2.40.
For now, whales appear cautious, hedging their positions and exploring alternatives like Remittix, a project offering real-world PayFi solutions. This blend of hesitancy and quiet accumulation leaves the next move for Ripple price prediction hanging in the balance.

Remittix has quickly become the talk of crypto circles, proving why many traders now call it “XRP 2.0.” While the XRP price prediction continues to fluctuate around the $3 zone, Remittix is offering something XRP cannot—instant, low-cost fiat conversion at scale. By raising over $23 million and selling more than 636 million tokens at $0.10, RTX has already demonstrated investor confidence that rivals older networks.
Unlike Ripple News, where fundamentals often clash with volatile market sentiment, Remittix provides a payments framework built for freelancers, NGOs, and global businesses needing fast remittance solutions. Analysts argue that this Remittix model bridges the gap between DeFi and TradFi, attracting whales looking to hedge their XRP positions.
With real utility and an expanding roadmap, RTX positions itself as not just another altcoin, but the most compelling hedge to Ripple’s long-term uncertainty.
Discover the future of PayFi with Remittix by checking out their project here:
Website: https://remittix.io/
Socials: https://linktr.ee/remittix
$250K Giveaway: https://gleam.io/competitions/nz84L-250000-remittix-giveaway
Information contained on this page is provided by an independent third-party content provider. Binary News Network and this Site make no warranties or representations in connection therewith. If you are affiliated with this page and would like it removed please contact contact@binarynewsnetwork.com
The XRP Price Prediction is capturing investor interest heading into 2026, with regulatory clarity and institutional backing fueling optimism. While forecasts vary, many expect XRP to close the year well above current levels.
At the same time, Remittix (RTX) is drawing attention as a PayFi alternative, backed by a $250,000 giveaway and a Q3 wallet beta launch
Analysts are projecting a range of outcomes for XRP Price Prediction by December 31. Changelly expects XRP to average around $3.04 by year’s end, with a likely range between $2.98 and $3.32. CoinCentral sketches a path to $5 and beyond for XRP, but only if institutions continue to invest and regulators remain supportive.
Bitget’s desk is in the same camp, calling for $5 by late 2025 on the back of corporate uptake and improving mood. In the wild-bull case, a broad crypto melt-up plus ETF tailwinds has some whispering $9–$10 or higher. Taken together, expectations for XRP Price Prediction range from a conservative $3 to an optimistic $10, depending on regulatory momentum and institutional interest.


When looking at XRP Price Prediction, investors weigh gradual appreciation based on compliance and scale. Remittix, by contrast, offers a different narrative, fast-moving adoption in payments infrastructure, and an engine ready for explosive growth.
At $0.1000, Remittix has sold over 637 million tokens and raised more than $23 million. It secured a BitMart listing after passing the $20 million threshold, followed by LBANK once it exceeded $22 million. A Q3 2025 wallet beta is imminent, bolstered by a $250,000 community giveaway.
Here is why Remittix stands distinct in comparison with XRP:
Unlike XRP Price Prediction that hinges on regulatory events and institutional sentiment, Remittix builds growth from foundational infrastructure and tangible milestones, making it a compelling high conviction alternative.
XRP Price Prediction spans a broad spectrum, ranging from a steady $3 to an optimistic $10 by year’s end, rooted in legal developments and institutional momentum. However, Remittix stakes its case on practical execution, wallet deployment, exchange listings, community engagement, and infrastructure, augmenting its appeal beyond speculative factors.
For investors torn between XRP’s legacy and Remittix’s innovation, this juxtaposition may shape capital flows going into 2026.
Discover the future of PayFi with Remittix by checking out their project here:
Website: https://remittix.io/
Socials: https://linktr.ee/remittix
$250,000 Giveaway:https://gleam.io/competitions/nz84L-250000-remittix-giveaway


")
