The main category of Crypto News.
You can use the search box below to find what you need.
[wd_asp id=1]
The main category of Crypto News.
You can use the search box below to find what you need.
[wd_asp id=1]
BNB-USD (Binance Coin) traded around $840 on Thursday, December 18, 2025, slipping in a choppy session that saw prices probe the low $830s before stabilizing. Real-time quotes showed BNB down roughly 2% versus the prior close, with an intraday swing that—depending on venue and data source—reached from about $830 up toward the mid-$870s. [1]
The bigger story behind “BNB price today” is less about one number and more about a tug-of-war: risk-off macro sentiment and bearish derivatives positioning versus ongoing ecosystem headlines (including fresh stablecoin activity on BNB Smart Chain) that could become bullish catalysts if liquidity and on-chain usage follow through. [2]
Below is a roundup of the current news, forecasts, and market analysis published or updated on 18.12.2025, plus a scenario-based outlook for where BNB-USD could go next.
As of today’s trading (Dec. 18), BNB was quoted around $840. One real-time feed showed $840.06, with a session high near $874.93 and low near $830.42.
Other widely followed datasets put the day’s range similarly anchored around the low-$830s, with one historical table showing a low near $830.60 and a high near $852.99 for Dec. 18 (venue/time-window differences can explain the mismatch versus other feeds). [3]
Zooming out one step, CoinGecko’s BNB page showed BNB around $840.56, and also flagged that over the last month BNB was down about 8.20%, underperforming a broader crypto market that was down roughly 6.60% over the same window. [4]
And yes, the “gravity” number remains the prior peak: CoinGecko lists BNB’s all-time high at $1,369.99, leaving the token roughly ~39% below that level at current prices. [5]
One of the most detailed market write-ups today described a classic de-risking pattern: spot price pressing the lower band of its recent range while derivatives traders reduce exposure. The report cited rising volume alongside falling open interest, a combination often associated with position unwinding rather than confident dip-buying. [6]
In a Dec. 18 technical note, IG said BNB failed to hold above roughly $928 earlier in December and has since drifted below its 200-day simple moving average (SMA), framing the near-term bias as bearish while BNB remains under a key resistance zone. [7]
IG also linked crypto’s softer tone to macro conditions—arguing that even with a widely anticipated Fed rate cut, markets interpreted guidance as relatively cautious, keeping pressure on risk assets (including BNB). [8]
Separate, broader regulatory context came from Reuters on Dec. 18: the piece highlighted crypto-friendly shifts in 2025 (including regulatory and legislative wins), but warned of uncertainty heading into 2026 as major market-structure legislation remains stalled—an overhang that can feed into cautious positioning across the sector. [9]
A Dec. 18 market update noted BNB’s position among the largest non-stablecoin cryptocurrencies by market capitalization—important because many funds and index-like products manage exposure based on size and liquidity. [10]
Technical analysis isn’t prophecy—it’s a map of where traders are likely to react. Today’s coverage (Dec. 18) converged on a few key zones.
A market analysis today described BNB trading near the lower Bollinger Band around $830, with repeated failures to reclaim the mid-band area around the high-$800s—implying sellers still control the short-term rhythm unless price can reclaim nearby resistance. [11]
IG’s Dec. 18 levels were notably specific:
On the upside, IG said bulls would want to see reclaiming $899.70 to bring the $928 area back into play, with higher resistance levels above that if momentum truly returns. [13]
Investing.com’s BNB/USD technical panel (timestamped Dec 18, 2025 02:48 PM GMT) summed the setup as “Neutral” overall, but with a split personality underneath: technical indicators leaned “Buy,” while moving averages leaned “Sell.” [14]
It also published a full set of classic pivot levels, including a classic pivot near 846.73, with nearby resistance and support bands traders often reference for intraday planning. [15]
Forecasts come in two flavors: (1) scenario-based analysis from human analysts, and (2) algorithmic projections that extrapolate price/volatility patterns. Today’s coverage includes both.
Base case (range + volatility):
If risk appetite remains muted and leverage continues to unwind, BNB can keep rotating inside a wide band where buyers defend the low $800s and sellers show up into rebounds. Today’s reports emphasize that price behavior still favors sellers until key resistance is reclaimed. [16]
Bear case (breakdown):
A decisive move below the most watched support zone (roughly $802–$792) increases the odds of a deeper slide toward the next historical low area around $729 cited in today’s technical analysis. [17]
Bull case (trend repair):
To flip the script, today’s technical playbook is clear: reclaim ~$870–$872, then build acceptance above ~$900. If that happens, the early-December resistance area around $928 becomes the next “prove it” level. [18]
A Binance-hosted “price prediction” tool displayed short-horizon projections clustered in the high-$830s to low-$840s into mid-January 2026 (and includes its own cautionary language about technical analysis and trading bots). [19]
CoinCodex’s algorithmic forecast also pointed to modest movement in the near term—projecting around $842.85 for Dec. 19 and a range that implies small percentage changes into year-end, while noting a broadly cautious/bearish framing for 2025 based on its indicators. [20]
And Investing.com’s indicator snapshot landing on “Neutral” aligns with a market that’s not screaming “new trend” yet—more like “wait for confirmation.” [21]
How to use this without fooling yourself: algorithmic forecasts often behave like a “statistical weather report”—helpful for framing possible ranges, unreliable for pinpointing turning points. The more useful takeaway today is which levels would invalidate bearish momentum (reclaiming ~$870–$900) and which levels would confirm deterioration (losing ~$802–$792). [22]
Even on red days, fundamentals can change—and today’s news cycle included a meaningful ecosystem headline: stablecoin expansion on BNB Chain.
A Dec. 18 press release announced the launch of $U, a stablecoin deployed on BNB Smart Chain and Ethereum, positioned around cross-chain liquidity and a broad set of use cases spanning DeFi, payments, and settlement. [23]
The release and republished brief also described:
This matters for BNB-USD because stablecoin liquidity is often the “plumbing” for on-chain trading and DeFi activity—especially on ecosystems where stablecoin volume is a major driver of fees and usage.
A CoinMarketCap Academy update created/updated within the last day (aligned with today’s cycle) described a market dominated by fear/risk-off behavior, noting weakness across BNB Chain-related tokens week-over-week, while also emphasizing that development continues despite the soft tape. [25]
The same roundup flagged that BNB Chain teased an upcoming stablecoin initiative aimed at “next-gen liquidity” and large-scale on-chain activity—suggesting stablecoins are becoming a central narrative for the ecosystem heading into 2026. [26]
BNB’s near-term direction is likely to be decided by a handful of variables that showed up repeatedly in today’s reporting and dashboards:
BNB price today sits in a tense spot: near $840, pressured by a risk-off backdrop and technical weakness below major moving averages—but with ecosystem headlines (especially around stablecoins and liquidity) that could become bullish if they translate into higher on-chain activity and improved sentiment. [31]
For now, the most defensible “forecast” from today’s coverage is scenario-based:
Binance Founder: “The Real Bull Market Hasn’t Even Started Yet” (BNB hits $1,000)
1. www.coingecko.com, 2. www.ig.com, 3. www.investing.com, 4. www.coingecko.com, 5. www.coingecko.com, 6. crypto.news, 7. www.ig.com, 8. www.ig.com, 9. www.reuters.com, 10. www.coindesk.com, 11. crypto.news, 12. www.ig.com, 13. www.ig.com, 14. www.investing.com, 15. www.investing.com, 16. crypto.news, 17. www.ig.com, 18. www.ig.com, 19. www.binance.com, 20. coincodex.com, 21. www.investing.com, 22. www.ig.com, 23. www.globenewswire.com, 24. cryptobriefing.com, 25. coinmarketcap.com, 26. coinmarketcap.com, 27. www.ig.com, 28. crypto.news, 29. cryptobriefing.com, 30. www.reuters.com, 31. www.ig.com, 32. www.ig.com, 33. crypto.news, 34. www.ig.com
December 18, 2025 — Ethereum’s dollar price (ETH-USD) is trading around $2,941, roughly flat on the session after a notably volatile day that saw ETH swing between an intraday low near $2,793 and a high around $3,024.
That “whipsaw range” tells you almost everything you need to know about the current Ethereum setup: buyers are still defending the psychologically important $2,800 area, but upside momentum keeps running into supply near $3,000+, especially while U.S. spot Ethereum ETF flows remain negative and crypto regulation headlines keep landing like anvils on risk sentiment. [1]
What follows is a roundup of the key Ethereum price news, forecasts, and market analyses published on December 18, 2025, plus a scenario-based ETH-USD forecast built from today’s most-cited support/resistance levels and the day’s major catalysts.
As of the latest market print on Dec. 18, 2025, ETH-USD is near $2,941 with:
The broader context: multiple market updates today framed Ethereum as stuck below $3,000, with analysts describing ETH as stabilizing only because buyers keep stepping in around the high-$2,700s to low-$2,800s. [2]
A central theme in today’s reports is that U.S. spot Ethereum ETFs extended a streak of outflows, even as Bitcoin’s ETF complex showed a burst of inflows.
This matters for ETH-USD forecasting because ETF flows are one of the few “institutional tape” signals that can overpower short-term chart patterns. When ETH ETFs are consistently bleeding while BTC ETFs are gathering inflows, it often expresses itself as relative weakness in ETH vs. BTC and repeated failures to sustain breaks above major round-number resistance (like $3,000). [5]
Another recurring driver today was Washington risk. An Economic Times market report (dated Dec. 18) tied a broader crypto pullback to the U.S. Senate deferring key crypto legislation until 2026, arguing this extended regulatory uncertainty into the new year. [6]
Even if you don’t treat one headline as destiny, the mechanism is straightforward: in thin year-end liquidity, “rules uncertainty” tends to widen spreads, amplify liquidations, and increase the odds that rallies get sold quickly.
Today’s market read was less “crypto is dead” and more “crypto is rotating.” Several updates described a tape where Bitcoin holds steadier (helped by ETF inflows) while Ethereum and other major alts struggle to regain their footing.
FXStreet explicitly framed the day as Bitcoin attempting to hold above $87,000 while Ethereum “defends support around $2,800” but remains pressured by ETF outflows. [7]
One widely circulated analysis today focused on upcoming Ethereum scaling work. FX Leaders reported that developers are preparing to raise Ethereum’s gas limit from 60 million to 80 million, a change that could increase throughput and potentially reduce fees—though it also highlighted weakening on-chain engagement and the drag from ETF outflows in the near term. [8]
Whether you’re a fundamentals purist or a chart maximalist, this type of “capacity expansion” story matters because it feeds the long-running ETH valuation debate: is Ethereum’s base layer becoming a more efficient settlement engine, or are users continuing to migrate activity to Layer-2 networks in a way that suppresses fee-driven narratives?
A second Ethereum-specific headline theme today: complexity is a risk factor.
A Cointelegraph-sourced report circulated on Dec. 18 quoted Vitalik Buterin arguing that a key (often overlooked) aspect of trustlessness is increasing the number of people who can understand the protocol end-to-end, and that Ethereum should “get better at this” by making the protocol simpler—even if that sometimes means fewer features. [9]
This aligns with Buterin’s broader 2025 writing on simplifying Layer 1 design (including discussions of making Ethereum more “Bitcoin-simple” over a multi‑year horizon). [10]
From a price/forecast perspective, this “simplification” discourse is not a same-day catalyst like an ETF flow print—but it does influence the longer-term institutional story: protocol robustness, auditability, and decentralization are increasingly part of what big allocators claim to care about when they decide whether ETH is a core holding or a trading vehicle.
Forecasting crypto is like forecasting a cat’s next decision: it will do something, and it will be emotionally confident about it. So instead of pretending there’s one “correct” ETH-USD forecast, today’s professional-style coverage mostly converged on scenarios driven by support/resistance and flow trends.
Support
Resistance
If ETF flows remain negative and macro/regulatory headlines keep risk appetite constrained, the most likely near-term behavior is a choppy range:
This is essentially what much of today’s “ETH holds steady but can’t recover” framing points to.
Some shorter-term “price prediction” coverage today leaned rebound-ish, arguing that oversold conditions could fuel a recovery leg.
For this bullish scenario to look credible on the chart, today’s coverage implies ETH would need to:
If the $2,800 floor fails decisively, multiple analyses point to “air pockets” below:
A practical takeaway: $2,800 is not just a number today—it’s the narrative anchor. Lose it, and the forecast shifts from “range and rebound attempts” to “find the next durable bid.”
A lot of “ETH price prediction” content comes from algorithmic models. They’re useful as sentiment signals (what the crowd is being told), but they are not consensus truth.
For example:
These projections can be directionally interesting, but they often diverge wildly from one another over longer horizons. The higher-quality way to use them in a news-style forecast is simple: compare them to the hard levels ($2,800 / $3,000) and to real flow data (ETF inflows/outflows). [25]
On December 18, 2025, ETH-USD is hovering around $2,940 after a volatile session that reinforced the current regime: $2,800 is the battlefield, $3,000 is the ceiling, and ETF flows are the gravity. [30]
The near-term forecast is best expressed in scenarios:
If you invest in Ethereum.. HOLD ON!! ETH to skyrocket 🚀📈
1. www.fxstreet.com, 2. www.fxstreet.com, 3. www.fxstreet.com, 4. farside.co.uk, 5. www.fxstreet.com, 6. m.economictimes.com, 7. www.fxstreet.com, 8. www.fxleaders.com, 9. openexo.com, 10. vitalik.eth.limo, 11. www.fxstreet.com, 12. bravenewcoin.com, 13. www.fxleaders.com, 14. www.fxstreet.com, 15. www.fxleaders.com, 16. www.fxstreet.com, 17. www.fxstreet.com, 18. blockchain.news, 19. www.investing.com, 20. www.fxstreet.com, 21. www.fxleaders.com, 22. bravenewcoin.com, 23. changelly.com, 24. coincodex.com, 25. farside.co.uk, 26. farside.co.uk, 27. www.fxstreet.com, 28. m.economictimes.com, 29. www.fxleaders.com, 30. www.fxstreet.com, 31. blockchain.news, 32. www.fxleaders.com
Dogecoin price continued its downward trend as headwinds in the crypto market rose and demand for its ETFs plunged. DOGE was trading at a crucial support level at $0.1265, down by nearly 60% from its highest point in September.
The main reason why the Dogecoin price has crashed recently is that sentiment in the crypto industry has waned. A closer look at the sector shows that Bitcoin and most altcoins have been in the red as the Fear and Greed Index remains in the fear zone.
DOGE price has also slumped as demand for its exchange-traded funds remained muted. Data shows that the Grayscale and Bitwise DOGE ETFs have had no inflows since December 11. The last date these funds had inflows was on December 10 when an investor bought ETFs worth $171k.
Therefore, these funds have brought in $2 million in inflows since their inception in November, and they now hold $5.2 million in assets, which is equivalent to 0.03% of the market capitalization.
Grayscale’s GDOG has $3.95 million in assets, while Bitwise’s BWOW has $1.25 million. Therefore, the implication of all this is that these companies may ultimately decide to shutter the funds in the future if they fail to attract enough assets.
GDOG has an expanse ratio of 0.35%, meaning that its annual revenue will be less than $14,000 if the assets remain this low. Similarly, BWOW will make Bitwise less than $5,000 a year, which is not much for a company with billions of dollars in assets
The ongoing DOGE ETF woes are a sharp contrast to the performance of other altcoin ETFs. For example, the recently launched XRP ETFs have accumulated over $1 billion in inflows, while Solana funds have gained $725 million in inflows.

The daily chart shows that the DOGE price sits at a crucial support level today. It has dropped to $0.1260, a level it has failed to move below several times since April 7 this year.
Dogecoin price has remained below the 50-day and 100-day Exponential Moving Averages (EMA), while the Awesome Oscillator has remained below the zero line since October 9.
Therefore, the most likely DOGE price forecast is bearish as buyers have remained in the sidelines. If this happens, the next key support level to watch will be at the psychological level at $0.10, which is about 20% below the current level.
READ MORE: Top Catalysts for an Altcoin Season in 2026
Dogecoin (DOGE) trades in the red on Thursday, following a 4% decline on the previous day. The DOGE supply in profit declines as large wallet investors trim their portfolios. Derivatives data shows a surge in bearish positions amid declining retail interest. The technical outlook for Dogecoin indicates bearish bias as DOGE breaks below April’s low, targeting $0.1000.
Cardano (ADA) price trades in the red, slipping below $0.37 on Thursday after correcting more than 7% so far this week. The ongoing pullback could deepen further as ADA’s social dominance declines and dormant wallet activity rises, suggesting bearish sentiment among traders. On the technical side, deteriorating momentum indicators suggest further downside.

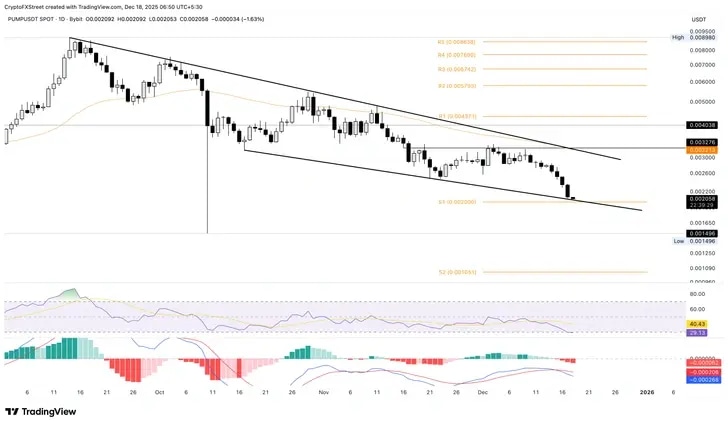
Pump.fun edges lower by nearly 2% at press time on Thursday, extending the 10% decline from the previous day. The meme coin launchpad token approaches the support trendline connecting the November 17 and 21 lows, part of a falling wedge pattern. If PUMP marks a decisive close below the S1 Pivot Point at $0.002000, it would confirm the bearish breakout. The declining trend in PUMP could find support at the October 10 low at $0.001496 or the S2 Pivot Point at $0.001051.
Cardano price is testing the crucial $0.38 support zone as bearish technical signals raise the risk of a deeper pullback towards $0.29, keeping participants cautious on near-term direction.
Cardano price is trading near a technically sensitive zone as price action consolidates around the $0.38 level, a threshold analysts consider critical for near-term stability. While ADA has avoided an aggressive breakdown so far, multiple technical signals suggest downside risk remains if buyers fail to defend current levels.
Despite modest intraday strength, the broader structure continues to reflect weakness, keeping participants cautious as Cardano searches for directional clarity.
As of December 17, 2025, Cardano price was trading around $0.38, posting minor gains on the day but remaining under pressure on higher timeframes. Price action has slipped below previous consolidation ranges, leaving Cardano price vulnerable to further downside if demand fails to step in.
Cardano trades near $0.38 as price tests a key short-term demand area. Source: Brave New Coin
From a technical perspective, the $0.38–$0.36 region stands out as the nearest support band where buyers have historically attempted to slow declines. A clean hold above this zone could allow for short-term stabilization, while a decisive breakdown would weaken the structure further.
Technical analyst Ali Martinez recently highlighted a bearish development on Cardano’s higher timeframe chart, noting that the SuperTrend indicator has flipped bearish. Historically, similar signal shifts on ADA have coincided with extended corrective phases rather than brief pullbacks.

Previous SuperTrend reversals on ADA coincided with major corrective phases. Source: Ali Martinez via X
Ali pointed out that the last comparable SuperTrend reversal preceded a sharp decline, reinforcing the importance of current support levels. While historical comparisons do not guarantee identical outcomes, the signal adds weight to the broader bearish bias unless structure improves.
Adding to downside concerns, Cardano price has recently broken down from a long-standing price channel on the daily timeframe. In another chart from Ali Martinez, the analyst points out that this structural failure places the $0.29 level into focus as the next major area of interest.

A confirmed channel breakdown places $0.29 as a key downside reference. Source: Ali Martinez via X
This level aligns with prior accumulation zones and historically strong demand, suggesting it could act as a reaction point if selling pressure accelerates. However, a move towards $0.29 would represent a continuation of the current downtrend rather than a confirmed bottom.
While price structure remains fragile, Cardano’s on-chain metrics paint a more mixed picture. Recent data indicates that Cardano DEX volumes have increased 2–3x on average following recent ecosystem developments tied to the NIGHT protocol.

Cardano DEX activity shows elevated volumes despite price consolidation. Source: melon via X
Rising decentralized exchange activity suggests growing network usage, even as price struggles to regain momentum. Melon notes that increased on-chain activity does not always translate into immediate price appreciation, particularly during broader market corrections.
Adding to the mixed outlook, Cardano price continues to see strong adoption in key markets. Recent data indicates that ADA ranks among the top 10 most held cryptocurrencies in India, overtaking assets such as Solana (SOL) and Polygon (POL) in investor ownership.

ADA ranks among the top 10 most held cryptocurrencies in India. Source: MinswapIntern via X
While adoption metrics support Cardano’s long-term relevance, short-term price action remains driven primarily by technical structure and overall market sentiment.
Cardano remains significantly below its 2021 all-time high of $3.09, reflecting a prolonged corrective phase shared by many large-cap altcoins. Short-term traders remain focused on defending the $0.38 region, while longer-term investors view deeper pullbacks as potential structural retests rather than a breakdown of fundamentals. Market sentiment around ADA remains mixed, with price direction likely influenced by broader crypto market conditions, particularly Bitcoin’s trend.
Cardano price is at a pivotal point. The $0.38 support level serves as a key reference for short-term stability, while a confirmed breakdown could expose ADA to a move towards $0.29. Technical indicators lean cautiously, though on-chain activity and adoption trends provide partial balance to the bearish narrative.
For now, ADA’s outlook remains conditional. Holding current support could allow consolidation, while further weakness would reinforce the broader downtrend. Monitoring structural levels and broader market cues remains essential for assessing Cardano’s next move.
Dec. 17, 2025 — Solana’s U.S. dollar pair (SOL-USD) is trading around the $123 area as the broader crypto market remains cautious and risk-sensitive, while Solana-specific headlines range from a major network stress test (a large DDoS attack) to fresh security research around post-quantum signatures. [1]
Multiple pricing feeds show SOL down roughly ~3.6% to ~3.8% over the past 24 hours, with heavy turnover and an unusually wide intraday range — a setup that has kept short-term “breakout or breakdown” talk front and center in today’s technical commentary. [2]
At the time of writing, widely followed trackers place Solana around $123:
Context: CoinGecko also shows SOL down about ~11% over the past 7 days, highlighting that the latest slide is part of a broader December pullback rather than a single-candle move. [9]
Today’s SOL price action is being pulled by two forces at once: (1) a risk-off crypto tape and (2) Solana-specific headlines that are, paradoxically, long-term constructive even as price chops lower in the short term.
Reuters reports crypto investors have become more cautious after the market’s downturn from October highs, with greater emphasis on hedged/active strategies and risk management tools. That kind of positioning shift can reduce dip-buying urgency in large-cap alts like SOL. [10]
(Separate market coverage also points to crypto behaving more like a risk asset than a gold-like hedge in this phase, which can keep pressure on majors when sentiment turns defensive.) [11]
A widely discussed Solana story on Dec. 17 is the network’s ability to remain operational through a massive DDoS attack. Unchained reports the attack lasted over a week and peaked around 6 Tbps, yet the network appeared “unimpacted” and saw zero downtime or performance degradation in that account. [12]
Unchained also notes Solana co-founder Anatoly Yakovenko publicly framed the attack as “bullish” in the sense that an attacker was allegedly spending heavily to generate traffic without taking the chain down—adding to the narrative that Solana’s infrastructure resilience has improved. [13]
Why it matters for SOL-USD: In past cycles, Solana’s reliability has been a major investor talking point. Stories that emphasize resilience can strengthen long-term confidence, but they don’t always translate into immediate upside if the overall market is risk-off.
Another major Dec. 17 headline: Cointelegraph (via TradingView) reports the Solana Foundation partnered with Project Eleven for a quantum computing threat assessment and prototyped a Solana testnet using post-quantum digital signatures, claiming end-to-end “quantum-resistant transactions” can be practical and scalable. [14]
BeInCrypto similarly reports Solana deployed post-quantum signatures on a testnet as a proactive security measure amid growing industry focus on quantum readiness. [15]
Why it matters for the forecast: This is not a “next week” price catalyst in most models, but it supports a longer-term investment narrative: Solana positioning itself as infrastructure that can evolve with future security standards.
Although announced Dec. 16, Visa’s move is part of what traders are still digesting on Dec. 17 because it directly references Solana in a TradFi settlement context. Visa says initial U.S. banking participants Cross River Bank and Lead Bank have begun settling with Visa in USDC over the Solana blockchain, with broader availability planned through 2026. [16]
Why it matters for SOL-USD: Even when SOL token price doesn’t respond immediately, the “Solana as payments/settlement infrastructure” storyline is strengthened when a global network like Visa names Solana as a settlement rail in an official release.
Earlier this month, Reuters reported J.P. Morgan arranged a $50 million short-term debt deal for Galaxy Digital on Solana’s blockchain, with USDC used in the flow—another signal of institutional experimentation on Solana. [17]
Separately, State Street Investment Management and Galaxy Asset Management announced plans (Dec. 10) for the State Street Galaxy Onchain Liquidity Sweep Fund (SWEEP), anticipating ~$200 million seed from Ondo Finance and an early 2026 debut on Solana, using stablecoins (including PYUSD) for subscriptions and redemptions. [18]
Galaxy’s own research recap from Breakpoint week framed these types of announcements as evidence of ecosystem maturation and increasing institutional traction around the “internet capital markets” thesis. [19]
Today’s technical commentary is unusually aligned on one point: SOL is coiling, and the next big move likely depends on whether support breaks or holds.
Takeaway: Market structure is “compressed.” In practice, that often means traders watch for a decisive move below ~$120–$122 (bearish expansion) or a reclaim above ~$132 (bullish relief rally). [26]
No forecast is guaranteed—crypto is notoriously headline- and liquidity-driven—but today’s mix of price structure and news flow lends itself to scenario-based expectations.
Given the tight compression highlighted by multiple analysts, a common near-term path is continued sideways-to-choppy trade as long as SOL holds the widely watched support band. [27]
In this base case, traders often look for mean reversion toward the $130–$132 area (the first meaningful resistance cluster) rather than an immediate trend reversal. [28]
A bullish break typically requires SOL to:
If that happens, some technical roadmaps start pointing toward $135 and beyond (with higher resistance levels mentioned in certain write-ups), though follow-through will likely depend on whether the broader crypto market stabilizes. [30]
If SOL loses the $120–$122 support area decisively, analysts highlighting the compression pattern argue the move could accelerate, with $100 often cited as a psychological downside target from the current structure. [31]
This scenario becomes more plausible if macro-driven crypto weakness persists and risk appetite remains subdued. [32]
A number of widely circulated SOL price prediction pages updated around this period broadly cluster around “low $120s to low/mid $130s” for late December, but they vary meaningfully on timing and volatility assumptions.
Important nuance: These models can lag real-time developments (macro shocks, security headlines, liquidity events) and may not “understand” Solana-specific catalysts like Visa settlement rails or post-quantum testnets in a fundamental sense. Treat them as reference points, not promises. [35]
If you’re tracking SOL-USD into the end of 2025, today’s coverage suggests five practical watch items:
On Dec. 17, 2025, Solana USD (SOL-USD) sits at a technically sensitive spot near $123, with analysts largely converging on a simple framework: $120–$122 is key support; $130–$132 is the first major resistance. [41]
Meanwhile, Solana’s news cycle is unusually infrastructure-heavy—DDoS resilience, post-quantum signature experiments, and large institutional rails name-checking Solana for settlement—suggesting the ecosystem story remains active even as price stays tied to a cautious, risk-off crypto tape. [42]
This article is for informational purposes only and does not constitute financial advice. Cryptocurrency prices can change rapidly, and different data providers may show slightly different prices due to exchange and methodology differences. [43]
1. coinmarketcap.com, 2. coinmarketcap.com, 3. coinmarketcap.com, 4. coinmarketcap.com, 5. coinmarketcap.com, 6. coinmarketcap.com, 7. coinmarketcap.com, 8. www.investing.com, 9. www.coingecko.com, 10. www.reuters.com, 11. www.barrons.com, 12. unchainedcrypto.com, 13. unchainedcrypto.com, 14. www.tradingview.com, 15. beincrypto.com, 16. usa.visa.com, 17. www.reuters.com, 18. investors.statestreet.com, 19. www.galaxy.com, 20. crypto.news, 21. bravenewcoin.com, 22. www.altcoinbuzz.io, 23. cryptorank.io, 24. cryptorank.io, 25. www.altcoinbuzz.io, 26. crypto.news, 27. crypto.news, 28. cryptorank.io, 29. cryptorank.io, 30. cryptorank.io, 31. crypto.news, 32. www.reuters.com, 33. changelly.com, 34. coincodex.com, 35. usa.visa.com, 36. crypto.news, 37. cryptorank.io, 38. unchainedcrypto.com, 39. usa.visa.com, 40. www.reuters.com, 41. coinmarketcap.com, 42. unchainedcrypto.com, 43. coinmarketcap.com
Ethereum USD (ETHUSD) has seen a sharp drop to $2810.69, a significant decrease of $153.71 since opening. This downturn, reflected by a 5.19% drop today, raises questions about the market’s next move for this top cryptocurrency.
Ethereum USD has just hit $2810.69, recording a notable decline of 5.19% today. The intraday low touched $2790.01, while the high reached $3028.99. With a market cap of approximately $354 billion, Ethereum’s trading volume climbed to 369,841,310, surpassing its average volume of 291,012,931. This surge in volume indicates growing market interest amidst volatility.
Several technical indicators suggest a bearish trend for Ethereum USD. The RSI stands at 40.89, indicating potential oversold conditions. The MACD, at -86.59 with a histogram of 36.25, further supports a bearish outlook. Meanwhile, the ADX at 38.15 shows a strong trend, reinforcing current market conditions.
ETHUSD’s monthly forecast predicts a potential dip to $2644.67, aligning with current bearish signals. However, a quarterly forecast of $3457.34 suggests possible recovery in the medium term. Long-term predictions show promising growth, with a yearly target of $3367.76 and a five-year forecast of $4809.89. Forecasts can change due to macroeconomic shifts, regulations, or unexpected events affecting the crypto market.
Recent coverage by Yahoo Finance highlights broader market declines impacting Ethereum. With major cryptos experiencing downturns, Ethereum’s recent price action reflects broader market jitters. The fluctuating sentiment underscores caution, and traders are closely monitoring global economic pointers and regulatory updates for cues.
Ethereum USD’s recent price drop highlights significant market volatility. While technical indicators lean bearish, the forecast suggests mixed signals with potential for mid-term recovery. Traders should stay informed, considering factors like economic policy changes or regulatory shifts that could alter the crypto landscape drastically.
As of the latest data, the price of ETHUSD is $2810.69 after a decline of 5.19% today, dropping by $153.71 from its previous close of $2964.4.
ETHUSD
Key indicators include an RSI of 40.89, MACD at -86.59, and ADX at 38.15, all pointing to a bearish sentiment in the current market conditions for ETHUSD.
The monthly forecast is $2644.67, while the quarterly forecast is $3457.34. Long-term projections expect ETHUSD to reach $3367.76 annually and $4809.89 in five years.
Recent news coverage indicates broader market declines, impacting Ethereum USD and reflecting general market uncertainty. Economic policies and regulations are closely watched for potential impacts.
While current technical indicators show a bearish trend, the mid-term forecast suggests a possible recovery. Traders should keep an eye on macroeconomic and regulatory developments.
Disclaimer:
Cryptocurrency markets are highly volatile. This content is for informational purposes only.
The Forecast Prediction Model is provided for informational purposes only and should not be considered financial advice.
Meyka AI PTY LTD provides market data and sentiment analysis, not financial advice.
Always do your own research and consider consulting a licensed financial advisor before making investment decisions.
Bitcoin’s USD price (BTC-USD) is trading in a tense range on December 17, 2025, as traders weigh conflicting signals: persistent U.S. spot Bitcoin ETF outflows, a still-uncertain Federal Reserve rate path, and evidence that institutional interest remains real—but increasingly selective.
As of writing, Bitcoin (BTC-USD) is around $86,108, down about 1.6% versus the prior close, after printing an intraday high near $90,187 and low near $85,355.
That level keeps BTC well below its October peak (around the mid-$126,000s), and it helps explain why “year-end rebound” headlines are being met with skepticism across both crypto-native and traditional markets. [1]
While price action has been choppy, several market reads describe Bitcoin as range-bound rather than in free-fall.
In other words: BTC-USD is still moving fast (as it always can), but the bigger story today is the tug-of-war between structural support and overhead selling pressure.
One of the most watched BTC-USD drivers in late 2025 remains spot ETF flow momentum—and the latest data has turned into a clear headline.
Farside Investors data shows U.S. spot Bitcoin ETFs recorded a net outflow of about $277.2 million on Dec. 16, with IBIT at -$210.7 million, while FBTC showed +$26.7 million (and several others were negative or flat). [4]
That matters because multiple market notes argue ETF demand is now the “swing factor” for Bitcoin—especially as other sources of incremental buying have slowed (more on that below). [5]
Bitcoin has increasingly traded like a high-beta risk asset in 2025—moving with (and sometimes exaggerating) shifts in broader risk sentiment.
Investing.com explicitly pointed to:
That “macro-first” framing also shows up in on-chain commentary: Glassnode described weak ETF flows, thin spot liquidity, and defensive positioning leaving BTC sensitive to macro catalysts. [7]
A Reuters analysis published today says the recent downturn has pushed investors toward risk-managed strategies, highlighting a broader shift: crypto exposure is increasingly expressed through ETFs, options, and structured tools, rather than pure directional bets. [8]
Reuters also emphasized how the downturn hit some of the most “hyped” corners of the market—particularly bitcoin-treasury companies, whose premiums have compressed sharply as BTC fell from its October highs. [9]
Forecasts for Bitcoin tend to cluster around levels—because in crypto, narratives often change at specific prices.
Here are the most-cited BTC-USD zones in today’s analysis:
Why this area matters: If Bitcoin loses the low-$80Ks, the market conversation can quickly shift from “consolidation” to “breakdown.”
Why this area matters: A clean break above ~$95k would reduce the “overhead supply” pressure narrative and could shift market tone quickly back toward $100k debates.
No one can forecast Bitcoin perfectly—especially in a market where macro headlines can reprice risk in minutes. But today’s research largely points to scenario planning.
If ETF flows remain mixed and macro data doesn’t surprise, analysts describing BTC as “range-bound” see price oscillating between low-$80Ks support and mid-$90Ks resistance into year-end. [15]
Glassnode also notes large December options expiries (including Dec. 26) may contribute to “pinning” behavior that reinforces range trading. [16]
A decisive move below $80k is the level where several forecasts get harsher. DailyForex suggests that a breakdown could open the door to much deeper downside targets (with $65k mentioned as a potential level in that scenario). [17]
If macro risk sentiment improves and ETF flows stabilize, a move above ~$95k is widely treated as the “regain momentum” trigger, with $100k the next major psychological battleground. [18]
Long-range BTC-USD forecasts vary wildly—but a few calls are dominating the December conversation because they come with clear assumptions about where demand will come from next.
Reuters’ Live Markets report (Dec. 10) said Standard Chartered’s Geoff Kendrick cut 2025 and 2026 forecasts in half, now expecting around $100,000 by end-2025 and $150,000 by end-2026, while still keeping a longer-run view that Bitcoin could reach $500,000 by 2030. [19]
Investing.com’s coverage adds important color: Kendrick argued the recent drawdown is steep but “within historical norms,” and that future upside is expected to be driven largely by ETF inflows, with bitcoin-treasury-company buying no longer assumed to be a reliable incremental support. [20]
That same demand-shift theme is echoed in Reuters’ broader Dec. 17 analysis: the crypto market is “maturing,” with more structured tools and more nuanced exposure replacing the earlier era of reflexive leverage. [21]
The Motley Fool’s Dec. 17 piece explicitly questions whether BTC can hit $200,000 in 2026, calling the “more than doubling” required from current levels a tall task and pointing to more cautious outlooks after the late-2025 pullback. [22]
While these aren’t bank research notes, they’re indicative of a broader shift in tone: fewer “straight line up” calls, more probability-weighted framing around macro conditions, ETF flows, and risk sentiment.
One of the most important through-lines in today’s reporting is the idea that Bitcoin has become more “institutional” in market structure—without necessarily becoming less volatile.
Reuters highlighted ongoing institutional involvement (including endowments and sovereign wealth funds) even as investors get more cautious after the drawdown. [23]
At the same time, crypto’s relationship with broader tech-and-risk narratives continues to show up in coverage. Barron’s described Bitcoin as behaving less like gold and more like a risk-sensitive asset tied to broader market sentiment, while warning of downside tests if risk aversion persists. [24]
If you’re tracking Bitcoin price today with an eye on the forecast, the next catalysts most cited in today’s reporting are:
1. www.reuters.com, 2. www.investing.com, 3. insights.glassnode.com, 4. farside.co.uk, 5. www.investing.com, 6. www.investing.com, 7. insights.glassnode.com, 8. www.reuters.com, 9. www.reuters.com, 10. insights.glassnode.com, 11. www.dailyforex.com, 12. www.barrons.com, 13. insights.glassnode.com, 14. www.dailyforex.com, 15. insights.glassnode.com, 16. insights.glassnode.com, 17. www.dailyforex.com, 18. www.dailyforex.com, 19. www.reuters.com, 20. www.investing.com, 21. www.reuters.com, 22. www.fool.com, 23. www.reuters.com, 24. www.barrons.com, 25. www.investing.com, 26. farside.co.uk, 27. insights.glassnode.com, 28. insights.glassnode.com
The Cardano market is navigating a decisive phase as price action compresses around a long-defended technical zone.
At press time, Cardano (ADA) was trading near $0.396, up about 2.7% over the past 24 hours.
But despite the short-term bounce, ADA price remains down roughly 14% on the week and close to 19% over the past month, reflecting persistent pressure across the broader crypto market.
Cardano price has spent recent sessions probing the $0.37–$0.40 region, an area that has emerged as critical support on multiple timeframes.
This zone has repeatedly absorbed selling pressure following a sharp pullback from above $0.40, where profit-taking intensified amid a broader Bitcoin-led sell-off.
Earlier today, the market briefly lost the $0.38 handle before bouncing back and stabilising, keeping the focus firmly on whether buyers can continue to defend the lower boundary.
From a technical standpoint, ADA is sitting on a multi-year ascending trendline that has historically separated prolonged corrections from recovery phases.
$ADA is holding the multi year trendline so far.
We need a strong bounce from here to engage a reversal.

Rather than breaking decisively lower, the price has compressed along this trendline, suggesting consolidation rather than capitulation.
Trading volume remains elevated near $500 million over 24 hours, but the balance between buyers and sellers still appears fragile, with technical momentum indicators reflecting this tension.
Oscillators such as RSI and Stochastic RSI remain bearish, while deeply negative readings on momentum measures hint at oversold conditions. Mostly, this combination often precedes short-term relief rallies, though it does not guarantee a trend change on its own.
Several analysts argue that Cardano price forecast models are starting to lean constructive as downside momentum shows signs of exhaustion.
According to Ali Matinez, a TD Sequential buy signal has appeared on the daily chart, highlighting $0.37 as the key invalidation level.
As long as ADA holds above that threshold, the model allows for a recovery path toward the $0.50–$0.54 zone, which aligns with prior reaction highs.
Chart structure also supports this view since Cardano has been trading within a falling channel for several months, as highlighted by analyst Nehal, and recent price action suggests selling pressure is weakening near the lower boundary.
A confirmed breakout above the channel’s upper trendline would shift focus toward higher resistance between $0.60 and $0.68, levels defined by earlier consolidation and volume clusters.
Beyond near-term signals, longer-cycle analysis adds another layer.
TradingView analyst Migoreng_wrap frames the current decline as the latter stage of a corrective Wave 2 within a broader Elliott Wave Pattern.
In this view, the low near $0.37 completes the correction following the prior impulse that carried ADA to $1.32 in late 2024.
If the structure holds, a powerful Wave 3 could follow, with projections that ultimately challenge and exceed the previous all-time high.
Fundamentals are also part of the conversation with ongoing efforts to expand stablecoin liquidity and treasury-backed DeFi initiatives aiming to address long-standing constraints within the Cardano ecosystem.
At the same time, scaling solutions and privacy-focused infrastructure are designed to improve execution speed and institutional readiness, factors that could matter if market sentiment turns.
The post Cardano price forecast: critical support tested as reversal signals emerge appeared first on Invezz
XRP-USD is trading around $1.88 on December 17, 2025, extending a choppy pullback that has kept the token pinned below the psychologically important $2.00 level. At the time of writing, XRP is down roughly 2.6% versus the prior close, with an intraday range near $1.85–$1.98—a sign that volatility remains elevated even as liquidity concentrates around a few key technical levels. [1]
The bigger story for traders and long-term holders is the tension between near-term bearish price action and structural tailwinds: multiple reports show U.S.-listed spot XRP ETFs drawing more than $1 billion of net inflows within roughly a month of launch, while Ripple-related regulatory and infrastructure headlines continue to stack up. [2]
Below is what’s moving XRP today, what analysts are watching next, and the scenarios shaping the XRP price forecast into early 2026.
Here are the headline numbers for XRP USD price on 17.12.2025:
Prices vary slightly by venue and data provider, but the takeaway is consistent: XRP is struggling to reclaim $2.00, and the market is repeatedly reacting around the $1.90 zone. [6]
Several market briefs published today describe a defensive backdrop across major digital assets—Bitcoin and Ethereum included—where crypto is trading more like a high-beta risk asset than a safe haven. [7]
That matters for XRP because, in this type of tape, breakouts tend to fail quickly and bounces are often sold—especially when traders are reducing leverage and chasing liquidity. Investing.com’s analysis framed XRP’s current weakness as part of a broader regime that “punishes” failed breakouts, even when the fundamental backdrop looks constructive. [8]
One of the most-circulated XRP market updates on Dec. 17 linked XRP’s slide to sudden volatility in bitcoin—describing XRP breaking below a nearby support zone amid heavier selling pressure. [9]
Even when XRP-specific headlines are positive, short-term correlation often dominates—especially during high-volatility sessions.
The standout narrative on 17 December 2025 is the scale and persistence of demand for spot XRP ETFs.
This is a meaningful structural shift for XRP-USD because ETFs can create a steadier channel for allocation—particularly for investors who prefer regulated vehicles over direct exchange exposure.
But the market’s message today is equally clear: ETF inflows alone haven’t been enough to flip the short-term trend yet, as spot and derivatives selling has continued to pressure price under $2.00. [13]
Regulatory headlines from earlier this month remain in focus today because they connect directly to the “institutionalization” narrative around XRP.
Reuters reported that the Office of the Comptroller of the Currency (OCC) granted preliminary/conditional approval for multiple crypto firms—including Ripple—to establish national trust banks, while clarifying that such charters do not allow firms to take deposits or make loans. [14]
Ripple also published a company announcement describing conditional approval to establish a federally supervised trust bank and tying the effort to oversight and stablecoin reserve management. [15]
A critical anchor point for XRP’s U.S. regulatory story in 2025 is the SEC’s August litigation release stating it filed a joint stipulation dismissing its appeal and Ripple’s cross-appeal—while noting the district court’s final judgment (including a $125,035,150 civil penalty and an injunction) remains in effect. [16]
The ETF boom in late 2025 did not happen in a vacuum. Reuters reported in September that the SEC approved rule changes enabling exchanges to adopt generic listing standards for spot crypto/commodity ETPs, cutting the maximum timeline from filing to launch and explicitly noting that early products were expected to include Solana and XRP-linked ETFs. [17]
Ripple’s own updates this week emphasize stablecoin infrastructure and cross-chain reach. In a post published two days ago, Ripple said RLUSD is expanding to Ethereum Layer-2 networks using Wormhole’s NTT standard and described RLUSD as issued under a New York Department of Financial Services (NYDFS) limited purpose trust company framework. [18]
Whether or not this directly boosts XRP price in the short run, it reinforces the broader theme repeated in today’s market commentary: regulated rails and institutional product wrappers are becoming central to the XRP narrative. [19]
Analyst coverage published on Dec. 17, 2025 clusters around a few widely watched levels. The names and models differ, but the map is surprisingly consistent: $1.90 is the line in the sand, and $2.00–$2.30 is the ceiling XRP must break to shift sentiment. [20]
Investing.com’s analysis highlighted:
If XRP defends this region and the broader crypto tape calms, a mechanically simple relief path is: $2.00 → $2.20–$2.30, with momentum traders watching for a higher-high sequence and improving volume.
FXStreet’s XRP update warned that a daily close below $1.90 could extend the correction toward $1.82 (described as November support), with the next major demand zone around $1.61 (April low). [22]
Investing.com’s deeper downside “hierarchy” adds intermediate zones around $1.73 and $1.64, while acknowledging a lower-probability tail risk into the mid-$1s if macro conditions deteriorate materially. [23]
If XRP can decisively flip $2.00 into support and reclaim $2.20–$2.30, Investing.com identifies upside targets in the $2.41–$2.50 region and then $3.00 as the next big psychological zone. [24]
This is also where ETF flows become more than a headline—because, in a breakout regime, steady inflows can amplify trend continuation as shorts cover and sidelined capital re-enters.
For longer-horizon readers searching “XRP price forecast 2026,” the dominant theme in today’s forward-looking commentary is volatility first, opportunity second.
FXStreet also quoted a Bitget Wallet research analyst projecting:
Those targets are not “base case” predictions for most market participants—they’re better understood as endpoints in a high-volatility probability distribution. But they show how analysts are framing XRP: one of the most sentiment- and structure-dependent large-cap altcoins in the current cycle.
For readers following XRP USD price today and trying to understand what could move the market next, these are the near-term catalysts repeatedly referenced across today’s coverage:
On Dec. 17, 2025, XRP’s price action is bearish-to-neutral in the short term—still below $2.00 and fighting to hold the $1.90 area. [32]
At the same time, the newsflow is unusually constructive: multiple sources report spot XRP ETFs pulling in over $1 billion in net inflows in about a month, while Ripple-related regulatory and infrastructure headlines reinforce the broader institutional narrative around XRP. [33]
As always with crypto, forecasts are scenarios—not promises. XRP’s next major move likely hinges on whether the market stays risk-off (pressuring support) or shifts back into a risk-on regime where ETF demand and improved market structure can translate into higher highs.
1. www.investing.com, 2. www.investing.com, 3. www.coingecko.com, 4. www.investing.com, 5. www.investing.com, 6. www.fxstreet.com, 7. www.fxstreet.com, 8. www.investing.com, 9. www.coindesk.com, 10. www.investing.com, 11. www.fxstreet.com, 12. www.dlnews.com, 13. www.fxstreet.com, 14. www.reuters.com, 15. www.businesswire.com, 16. www.sec.gov, 17. www.reuters.com, 18. ripple.com, 19. www.businesswire.com, 20. www.fxstreet.com, 21. www.investing.com, 22. www.fxstreet.com, 23. www.investing.com, 24. www.investing.com, 25. www.coingecko.com, 26. www.fxstreet.com, 27. www.fxstreet.com, 28. www.fxstreet.com, 29. www.fxstreet.com, 30. www.reuters.com, 31. ripple.com, 32. www.fxstreet.com, 33. www.investing.com
")


")