The main category of Crypto News.
You can use the search box below to find what you need.
[wd_asp id=1]
The main category of Crypto News.
You can use the search box below to find what you need.
[wd_asp id=1]
Solana price drops to a 5-month low of $138, testing key support with risks of sliding to $120 if the level breaks.
Solana (SOL) is currently at a critical juncture, with the price hovering around a significant support zone.
After a sharp decline, the cryptocurrency has reached a fresh 5-month low, leading many traders and analysts to closely monitor whether SOL will break down further or experience a short-term rebound.
As of now, Solana is trading near $138, with the key support zone between $134 and $140. The next few days are crucial, as a breach of this level could open the door for further downside movement, possibly pushing the price towards $120.
Solana’s recent price movement has raised concerns among traders. After months of gradual decline from highs near $210, SOL now finds itself at a critical support zone.
The price has been consistently forming lower highs and lower lows, signaling weakening momentum in the market. The $135–$138 range is an important level for Solana, as it has previously served as a key support zone.
Traders are focused on how the cryptocurrency reacts to this level. If the price holds above this support, a potential rebound to $165–$175 could occur.
However, a breakdown below $134 would suggest further downside, with targets near $120. These levels could see increased selling pressure, especially with SOL’s volume thinning out, which is a typical sign of reduced buying interest.
As the price tests these levels, Solana’s fate will depend on whether buyers can defend the support zone or if sellers will take control and push the price lower. This key moment could define the next major movement in SOL’s price.
Despite the bearish trend, lower timeframes are showing signs of potential reversal. On both the 4-hour and daily Relative Strength Index (RSI), bullish divergences are beginning to appear. This suggests that selling pressure may be slowing, even though the price is still near key support.
$SOL
Solana got a daily bullish divergence and one on 4h as well. Double divergences, across multiple timeframes do call for some relief in price as long as they aren’t invalidated.But if they do get invalidated, as it causes a lot of “expected” traders to get stuck, we get… pic.twitter.com/OIQdYFLVJZ
— Umair Crypto (@Umairorkz) November 17, 2025
If these bullish signals hold, there could be a short-term rebound. The price may attempt to move upwards towards $150, with potential resistance at $168.
However, traders remain cautious, as these divergences need confirmation. If SOL fails to hold above the support, the bullish setup could be invalidated, and the price may resume its downward trajectory.
For now, the appearance of bullish divergence on lower timeframes offers some hope for a reversal, but caution is necessary given the broader downtrend. A sustained rebound or further decline will depend on how the support zone holds up in the coming days.
Related Reading: Fidelity Advances Solana Spot ETF Plan as SOL Tests Key Price Levels
In addition to the bullish divergences, a TD Sequential “1” buy signal has appeared on Solana’s chart, which typically indicates a potential short-term bottom. This signal often shows up after a series of consecutive down candles, suggesting that selling momentum may be fading.
TD Sequential flashes a buy signal for Solana $SOL! pic.twitter.com/06LpcaSShm
— Ali (@ali_charts) November 17, 2025
The buy signal on the TD Sequential indicator comes after a prolonged period of decline, with SOL testing the $138–$142 range.
If this signal holds, a short-term rally could occur, with targets near $150 to $155. However, it’s important to note that the broader trend remains fragile, and this counter-trend signal requires confirmation.
If the TD Sequential setup plays out as expected, it could provide some relief to traders, but the overall market structure will determine how sustainable any price recovery will be.
A strong reaction from the support zone is essential for SOL to regain its footing and avoid further declines.
BNB continues to demonstrate relative strength within broader market conditions, with price action maintaining a stable higher-timeframe structure despite recent retracement phases.
Market behavior reflects measured participation, controlled volatility, and technical positioning that favors structural preservation rather than disorderly decline.
Participants appear to be monitoring confirmation zones rather than initiating high-leverage exposure, keeping the coin within a controlled consolidation channel.
BNB trades at $915 as the market enters a neutral consolidation phase, while open interest data highlights a lack of strong leveraged positioning.
The one-hour BNB/USD chart shows the price recovering from a short-term dip to $885, then gradually climbing into the current range.
However, aggregated open interest has been grinding lower between $863M and $860M, signaling reduced speculative positioning and a preference for passive exposure instead of directional leverage buildup.
Source: BNB Open Interest data
The absence of forced liquidations or sharp spikes reflects controlled positioning, which may help reduce volatility risk if the price continues to stabilise above $900.
Current derivatives behaviour implies that the BNB Price Prediction outlook remains dependent on renewed conviction rather than short-term speculative swings as the market tests whether buyers can reclaim initiative in the coming sessions.
Publicly available market statistics position BNB at approximately $928.74, recording a 0.58% increase over the past 24 hours.
Market capitalization stands near $125,018,531,846.00, supported by $3,329,292,453.00 in trading volume, while the current circulating supply reflects 137,736,891 coins. Data positioning confirms the coin remains within the upper-tier capitalization bracket, holding its status inside the global top five
Recent trading behavior shows price fluctuating inside a $928.74 intraday channel, aligning with stable liquidity readings rather than high-volatility displacement.
Volume activity shows consistent but non-expansive engagement, indicating balanced participant presence. The neutral profile does not reflect either forced selling pressure or early breakout accumulation patterns typically seen at trend inflection points.
Funding, VWAP Behaviour and Sentiment Indecision
CoinGlass data shows visible oscillations in volume-weighted behavior relative to price movement, with a clear divergence emerging during the most recent trend shift.
While the coin showed upward progression earlier, funding sentiment and VWAP indications moved in alternating bands, revealing short-lived phases of dominance from both sides of the market.

Source: Coinglass analytics
The price-to-volume relationship also reflects a transition from momentum continuation to range equilibrium conditions.
Based on current derivatives rhythm and order-flow cooling, BNB Price Prediction modelling favours neutrality until stronger conviction returns, potentially aligning with rising volume and break-level confirmation.
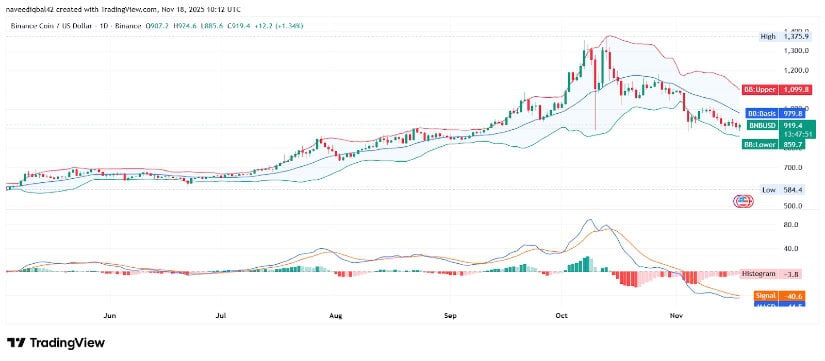
TradingView’s daily analysis shows BNB holding the lower Bollinger Band near $859, while the price remains below the middle band resistance at $979.
The Bollinger structure reflects a completed volatility expansion cycle turning into controlled compression. MACD remains in negative territory with the histogram showing a gradual reduction in selling momentum, suggesting deceleration rather than trend continuation.
Source: TradingView BNB chart
The price range between $885 and $920 forms a near-term accumulation zone, and sustained closes above $950 would represent the first technical confirmation of a short-term shift.
Technical structure remains consistent with a measured correction cycle, making the BNB Price Prediction outlook dependent on price reclaiming mid-range levels with directional volume support.
Jessie A Ellis
Nov 18, 2025 09:29
MATIC price prediction shows potential for recovery to $0.50 within 4-6 weeks as technical indicators suggest oversold conditions, though immediate weakness persists below key resistance.
Polygon (MATIC) finds itself at a critical juncture as November 2025 trading continues, with the token hovering near multi-month lows at $0.38. Our comprehensive MATIC price prediction analysis reveals a complex technical picture that suggests potential for significant upside movement despite current bearish momentum indicators.
• MATIC short-term target (1 week): $0.42 (+10.5%) – testing SMA 20 resistance
• Polygon medium-term forecast (1 month): $0.48-$0.55 range – 26-45% upside potential
• Key level to break for bullish continuation: $0.43 (SMA 20 resistance)
• Critical support if bearish: $0.33 (strong support level)
The latest Polygon forecast from multiple analytical sources presents a notably divergent picture. Recent MATIC price prediction models show targets ranging from conservative $0.165 estimates to extremely bullish $7.692 projections for medium-term timeframes.
Changelly’s near-term MATIC price target of $0.165 appears overly pessimistic given current support levels, while LongForecast’s $7.692 projection seems unrealistic without fundamental catalysts. The most credible predictions center around PricePredictions.com’s $0.732773 target and CoinGape’s $0.255771 forecast, both suggesting meaningful upside from current levels.
CoinArbitrageBot’s AI-driven $0.23048 short-term target aligns more closely with current technical resistance levels, though our analysis suggests higher probability for the $0.42-$0.50 range based on historical support and resistance patterns.
Current Polygon technical analysis reveals MATIC trading significantly below all major moving averages, with the token sitting 45% below its SMA 200 at $0.69. However, several indicators suggest oversold conditions that often precede meaningful reversals.
The RSI reading of 38.00 positions MATIC in neutral territory but approaching oversold levels, while the Bollinger Bands show price action in the lower 29% of the bands – historically a zone where bounces occur. The daily ATR of $0.03 indicates relatively low volatility, suggesting potential for increased movement as consolidation ends.
MACD momentum remains bearish with a -0.0045 histogram reading, but the narrow spread between MACD (-0.0246) and signal line (-0.0202) suggests weakening selling pressure. Stochastic indicators show %K at 25.19, approaching oversold territory that typically generates buying interest.
Volume analysis reveals relatively light trading at $1.07 million on Binance spot, indicating limited conviction in current price levels and potential for significant moves on increased participation.
The primary bullish MATIC price target focuses on a recovery to $0.50-$0.55, representing 30-45% upside from current levels. This projection relies on several technical factors aligning:
First, MATIC must reclaim the SMA 20 at $0.43, which would signal the beginning of short-term trend reversal. Success above this level opens the path to test the upper Bollinger Band at $0.56, closely aligned with strong resistance at $0.58.
Our most confident MATIC price prediction sees initial resistance at $0.43 giving way to momentum-driven moves toward $0.48-$0.50 within 4-6 weeks. This scenario requires RSI to break above 50 and MACD to generate a bullish crossover above the signal line.
The ultimate bullish target sits at $0.58, representing the confluence of multiple resistance levels and offering 52% upside potential. However, this level would require significant fundamental catalysts or broader market recovery to achieve.
Downside risks for this Polygon forecast center on a breakdown below current support at $0.35, which could trigger stops and accelerate selling toward the strong support zone at $0.33. This level represents the 52-week low vicinity and would likely generate defensive buying.
A break below $0.33 would invalidate our bullish MATIC price prediction and potentially target the psychologically important $0.30 level. Such a scenario would require broader cryptocurrency market weakness or Polygon-specific negative developments.
The most concerning technical development would be RSI falling below 30 combined with increased selling volume, which could trigger a deeper correction toward $0.28-$0.30 levels.
Current levels present a compelling buy or sell MATIC decision point for medium-term traders. Our recommendation favors accumulation strategies given the oversold technical conditions and proximity to strong support levels.
Optimal entry points for MATIC purchases include current levels around $0.38 with additional buying at $0.35 if weakness persists. This dollar-cost averaging approach capitalizes on potential volatility while managing downside risk.
Risk management requires strict stop-loss placement below $0.32, representing approximately 16% maximum loss from current entry levels. Position sizing should remain conservative given the uncertain broader market environment, with recommendations for 1-2% portfolio allocation maximum.
For aggressive traders, call options targeting the $0.50 strike price with 6-8 week expiration may offer leveraged exposure to potential upside moves, though these positions require careful risk management.
Our comprehensive analysis generates a medium confidence MATIC price prediction targeting $0.50 within 4-6 weeks, representing approximately 30% upside from current levels. This forecast relies on successful defense of the $0.35 support level and subsequent reclaim of $0.43 resistance.
Key technical indicators to monitor for prediction confirmation include RSI breaking above 45, MACD generating a bullish crossover, and volume expansion above 1.5 million daily average. Invalidation signals include breaks below $0.33 support with confirmed selling volume.
The timeline for this Polygon forecast extends through December 2025, with intermediate checkpoints at $0.42 (1-2 weeks) and $0.46 (3-4 weeks) serving as confidence builders for the ultimate $0.50 target. Traders should remain flexible and adjust positions based on evolving technical conditions and broader market sentiment.
Image source: Shutterstock
XRP’s price is down – but its fundamentals are hotter than ever. Canary’s XRPC ETF launched with a bang last week, attracting $58 million in opening-day volume. The move reflects deep institutional interest – and excitement is growing, with Franklin Templeton’s XRP ETF set to launch today.
Despite ETF tailwinds, the XRP price followed the broader market into bearish territory this week, falling 12% to $2.15 today. However, with institutional appeal clearly there, could we see XRP rebound in the weeks ahead?
Our XRP price prediction aims to evaluate the potential impact these ETFs could have on the asset’s short- and long-term pricing dynamics. We’ll consider both the historical performance of other cryptos with ETFs and analyst opinions.
But as the market focuses on XRP, analysts have spotted another crypto that’s currently flying under the radar – but could offer massive upside. It’s called Maxi Doge (MAXI), and it’s building traction in its presale at an impressive pace, raising $4 million thus far.
This publication is sponsored. CryptoDnes does not endorse and is not responsible for the content, accuracy, quality, advertising, products or other materials on this page.
Canary’s XRPC ETF burst out of the gate with $245 million of creations (new shares of the ETF) on day one. ETF expert Eric Balchunas declared that both XRPC and the newly listed Bitwise Solana ETF BSOL “are in a league of their own,” with no other 2025 ETF launch coming close to their initial momentum, reflecting deep investor appetite for mainstream altcoin exposure.
Congrats to $XRPC for $58m in Day One volume, the most of any ETF launched this year (out of 900), BARELY edging out $BSOL‘s $57m. The two of them are in league of own tho as 3rd place is over $20m away. pic.twitter.com/MjsOeceeNb
— Eric Balchunas (@EricBalchunas) November 13, 2025
The crypto analyst Diana underlined that Franklin Templeton is next in line to launch its XRP ETF today. This will be followed by Bitwise on Thursday, then 21Shares, CoinShares, Grayscale, and WisdomTree – all within the next week.
🚨UPDATE: FRANKLIN TEMPLETON’S XRP ETF (EZRP) GOES LIVE TUESDAY 🚨
…and Bitwise is right behind it on November 20. 😳🔥
Franklin Templeton (@FTI_US) — a $1.5 TRILLION asset manager — is launching its $XRP ETF (EZRP) on the CBOE THIS TUESDAY.
Analysts are already saying EZRP… pic.twitter.com/tMV70zsTQT
— Diana (@InvestWithD) November 16, 2025
Both Bitcoin and Ethereum ETF launches in 2024 demonstrated a similar dynamic to what we’ve seen so far with XRP and Solana: strong institutional demand, but negative immediate price movements. However, the long-term effects of ETF demand helped fuel the BTC and ETH rallies during this market cycle.
It took Bitcoin less than one month after its January 2024 ETF launch to gain bullish momentum, whereas it took Ethereum between 4 months and a year, due to intermittent volatility.
Judging by Canary’s ETF launch, Franklin Templeton and other issuers are likely to drive significant fresh demand into XRP, which could help fuel the next rally – especially if the broader market rebounds. But what are analysts saying?
Steph Is Crypto notes that XRP has a deep liquidation cluster above $3, suggesting that the price could move in this direction next.
However, Crypto Fergani suggests that the rally could extend toward $6. One reason this analysis holds credibility is that unlike other major cryptos such as Bitcoin, Ethereum, and Solana, XRP has successfully defended its key $2 support level despite the crash, providing structural strength that could enable a stronger rebound.
XRP’s combination of institutional appeal, upside liquidity risk, and structural chart strength is an exciting setup. It makes the project one of the standout players in line for an aggressive rebound. But as optimism builds, another project analysts believe is poised for substantial gains is Maxi Doge – so let’s look at what it’s all about.
Maxi Doge (MAXI) is undergoing a presale – and it’s on fire. The project has successfully raised over $4 million so far, fueled by rising investor appetite as projects already listed on exchanges struggle.
It’s branded around Dogecoin’s Shiba Inu motif, but introduces an entirely new concept. Futures trading integrations, community rewards, and degen-themed branding are its three main pillars.
The team plans to integrate MAXI into perpetual futures platforms, allowing users to trade it with leverage in both directions if they wish. There will also be weekly trading competitions, where MAXI holders with the highest trading ROI receive free tokens, adding an interactive, competitive element to the project.

Furthermore, the team plans to run community activation events to boost holder engagement. It has also added a staking mechanism to the presale that provides passive rewards, currently valued at a 76% APY.
With over $4 million raised, it’s clear that a lot of investors have belief in Maxi Doge’s potential. And leading analysts do too: Alessandro De Crypto recently predicted MAXI could see 100x gains, for example.
The past few months have been rough for crypto. Bitcoin has slid 28% from its ATH, and most altcoins have taken even bigger hits. But with institutional capital now flowing into altcoin ETFs, the tide may finally be turning.
If bullish momentum rekindles, XRP hitting $6 in the coming months is a real possibility. Meanwhile, Maxi Doge’s early-stage positioning, fast-growing presale, and innovative meme-utility approach give it the potential to deliver even larger upside.
This publication is sponsored. CryptoDnes does not endorse and is not responsible for the content, accuracy, quality, advertising, products or other materials on this page. Readers should do their own research before taking any action related to cryptocurrencies. CryptoDnes shall not be liable, directly or indirectly, for any damage or loss caused or alleged to be caused by or in connection with use of or reliance on any content, goods or services mentioned.

Nikolay is a cryptocurrency analyst and market writer with years of experience tracking digital asset trends and emerging blockchain technologies. A long-time crypto enthusiast, he actively trades across major exchanges and specializes in identifying early-stage projects and meme tokens. His analysis combines technical insight with a strategic, long-term investment perspective.

Cardano (ADA) is largely in bearish hands, trading above support at $0.45 at the time of writing on Tuesday. The downtrend builds on a bearish outlook that has weighed on the smart contracts token since July, when ADA peaked at $1.02.
Bitcoin’s falling further, down 25% from its record high of 126.2k at the start of October, dropping to a low of 89.1k today, a level last seen in April. The largest cryptocurrency has fallen in seven of the past eight sessions, a losing streak that has left it trading in the red for 2025.

Bitcoin (BTC) is trading above $91,000 at the time of writing on Tuesday, down slightly on the day but trimming some earlier losses, weighed by risk-off sentiment in the broader cryptocurrency market. Altcoins, including Ethereum (ETH) and Ripple (XRP), are showing signs of mild recovery, hovering above $3,000 and around $2.18, but the broader trend remains bearish.

41.5% of XRP supply is at a loss, raising concerns of further downside risk, while new ETFs could help drive recovery.
XRP is currently facing a challenging market environment, with a significant portion of its supply at a loss. Around 41.5% of XRP holders are now underwater, which signals potential further downside if the trend continues.
At present, the cryptocurrency’s price stands at about $2.15, showing a noticeable decline from its recent highs.
Data shows that 41.5% of XRP’s circulating supply is now in a loss position.
This creates a top-heavy market, with many investors who bought at higher prices now facing significant unrealized losses. The current price level of $2.15, although still higher than last year, reflects the vulnerability of the market.
The share of XRP supply in profit has fallen to 58.5%, the lowest since Nov 2024, when price was $0.53.
Today, despite trading ~4× higher ($2.15), 41.5% of supply (~26.5B XRP) sits in loss — a clear sign of a top-heavy and structurally fragile market dominated by late buyers.
📉… https://t.co/CBXPzDalxV pic.twitter.com/UpLNKV7LqD— glassnode (@glassnode) November 17, 2025
The number of tokens held at a loss is substantial, which raises concerns for future price movements.
A large portion of XRP’s market may look to sell if the price continues to decline, adding downward pressure. This could increase the risk of further losses if the market fails to show recovery soon.
Many investors who bought XRP earlier this year at higher prices are now experiencing losses. The recent price drop has caught some by surprise, especially for those who bought in at over $3.00. With XRP now trading around $2.16, this has left many holders in a difficult position.
As a result, market sentiment has become increasingly cautious. There is a heightened risk of forced sales and stop-loss triggers, which could push the price lower. This sentiment shift has caused some investors to reconsider their positions, increasing the chances of further downside.
Related Reading: XRP Whales Dump 200 Million Coins -Crash Incoming?
Despite the current market struggles, there is hope that the introduction of new exchange-traded funds (ETFs) could provide a boost.
The launch of the first spot-XRP ETF has generated positive interest, and several more ETFs are expected to launch soon. These new products could help increase demand for XRP by offering an easier way for both retail and institutional investors to gain exposure.
However, despite the buzz surrounding the ETFs, XRP’s price has yet to show significant signs of recovery. It is still trading more than 40% lower than its peak price in July.
For XRP to see a meaningful rebound, it will need to break above key levels, such as $2.70, to regain investor confidence and drive prices higher.
While the ETF launches could be a positive catalyst, the market remains fragile. Until XRP can confirm a solid recovery, the risk of further declines persists.
Solana (SOL) edges higher by 2% at press time on Tuesday, holding above the $130 mark. The technical outlook for Solana focuses on key support at $126 amid heightened selling pressure. However, steady inflows from Solana Exchange Traded Funds (ETFs) and an underlying shift in the spot and futures markets could help SOL rebound.
Solana is experiencing a surge in demand from large wallet investors, commonly referred to as whales, who are keen to buy the dip. According to CryptoQuant, the average order size of the executed trades in the SOL spot market indicates large whale orders. Furthermore, the Cumulative Volume Delta (CVD) indicates a positive difference in the market’s buy and sell order volume, suggesting buy-side dominance.
At the same time, the volume bubble map, which tracks the difference in trading volume, indicates a decline in both spot and futures markets. This decrease in trading volume, amid a prevailing declining trend, signals reduced selling pressure that could act as dry powder for the subsequent Solana rebound.
Meanwhile, despite Solana being down over 30% from October 28, the institutional demand remains steady. The SOL ETFs recorded a net inflow of $8.25 million on Monday, marking 15 consecutive days of positive flows.

Solana holds above the S2 Pivot Point at $128, slightly above the bearish target of $126, marked by the June 22 low, as previously reported by FXStreet. However, the close alignment of these strong supports could absorb the incoming supply, potentially leading to a bounce back.
This potential rebound in SOL could test the $150 psychological level near the $155 supply zone.
Still, the technical indicators on the daily chart tilt bearish, as the Moving Average Convergence Divergence (MACD) continues to extend the declining trend with the signal line.
Even the Relative Strength Index (RSI) at 30 hovers near the oversold boundary, signaling heightened selling pressure. However, extreme oversold conditions, indicated by RSI values below 30, signal a potential reversal as investors shift to buy the dip at undervalued prices.

If SOL drops below $126, it would nullify rebound chances and likely test the April 7 low of $95.
What if a single crypto could turn today’s dip market into your next big win? Amid falling prices, red candles, and growing market uncertainty, the MoonBull presale offers a rare opportunity for investors seeking both stability and explosive growth. As enthusiasm builds, MoonBull ($MOBU) continues to capture attention while Polkadot (DOT) maintains steady growth and Polygon (MATIC) gains momentum, creating a balanced approach for diversified crypto strategies.
With the MoonBull top 1000x crypto presale already live, early participants are enjoying eye-popping returns and exclusive rewards that amplify investor confidence. Could this be the moment to ride the next crypto wave while others struggle to keep up? This article will explore the latest updates and developments for all three coins: MoonBull, Polkadot, and Polygon.
Looking for a crypto that turns market dips into massive gains? MoonBull ($MOBU), a top 1000x crypto presale, is capturing investor attention with explosive growth and unmatched earning potential. From the moment it launched, MoonBull has captured the imagination of crypto enthusiasts seeking stability and upside potential. Its referral system rewards both the referrer and the new buyer with 15% extra $MOBU tokens, creating instant momentum and growth. With 8.05 billion $MOBU tokens allocated to the referral program, community engagement fuels organic expansion.
Meanwhile, starting at Stage 12, the governance system empowers holders to vote directly on proposals like campaign initiatives, supply burns, and incentive reserves. Each token equals one vote with no restrictions, making every participant a project architect. These mechanisms ensure that MoonBull presale remains rewarding, transparent, and scalable.
And the synergy of rewards and governance keeps investor excitement alive, turning dips into profit opportunities while creating lasting community loyalty. The MoonBull presale is in Stage 6 at $0.00008388, surpassing $600K in raised capital. Early investors enjoy an ROI of over 7,244% on the listing $0.00616. Investing $5,000 now yields 59.6M $MOBU tokens with projected returns of $ 367K. With 23 stages, act fast to join this top 1000x crypto opportunity.
Polkadot (DOT) is holding strong with a live price today of $2.82 and a 24-hour trading volume of $219,042,362. Investors are eyeing this coin for its interoperability features and robust ecosystem growth. Analysts provide an optimistic price forecast, suggesting potential upside as adoption rises.
With steady network upgrades and growing developer interest, the DOT price prediction continues to intrigue traders seeking sustainable crypto opportunities. Could Polkadot maintain momentum in the coming weeks? Crypto enthusiasts are watching closely to see whether DOT can ride the wave and deliver returns in line with broader market trends.
Polygon (MATIC) trades at $0.150905 today, with a 24-hour volume of $151,061,571. Known for its scalable Layer 2 solutions on Ethereum, Polygon continues to attract attention from investors seeking lower fees and faster transactions. Analysts are offering optimistic crypto price forecasts, suggesting a potential recovery and growth.
The MATIC price prediction remains bullish as partnerships and adoption expand. Could Polygon be a hidden gem for investors looking for consistent performance amid market turbulence? Traders and long-term holders are watching closely as MATIC demonstrates resilience and steady growth, making it a noteworthy part of any portfolio.
In a market riddled with uncertainty, MoonBull ($MOBU) stands out as a beacon for investors looking to capitalize on dips. While Polkadot (DOT) and Polygon (MATIC) offer stability and growth, MoonBull presale is delivering eye-popping returns, unmatched engagement, and unprecedented community-driven governance.
Early participants benefit from massive ROI, exclusive referral rewards, and an active role in shaping the project’s future. The MoonBull presale is live, and momentum is building fast. Don’t wait until the train leaves the station – secure your $MOBU tokens today, ride the gains, and become part of the next top 1000x crypto presale.

For More Information:
Website: Visit the Official MOBU Website
Telegram: Join the MOBU Telegram Channel
Twitter: Follow MOBU ON X (Formerly Twitter)
MoonBull ($MOBU) stands out as the best crypto to buy during market dips. The MoonBull presale offers low entry prices, high ROI potential, and referral rewards, making it ideal for investors seeking gains in volatile conditions.
The MoonBull presale highlights MoonBull ($MOBU) as a meme coin with exceptional growth potential. Early participants can secure tokens at discounted prices while enjoying governance rights, referral bonuses, and a projected ROI of thousands of percent.
To join the MoonBull presale, investors can purchase $MOBU tokens across 23 live stages. Early participation secures low entry prices, referral bonuses, and voting rights in governance, giving holders maximum growth potential while capitalizing on one of the top 1000x crypto presale opportunities.
MoonBull ($MOBU) stands out for its structured presale, referral rewards, and governance system. Early investors benefit from high ROI potential, token scarcity, and a robust roadmap, positioning it as one of the most promising cryptocurrencies this year.
MoonBull ($MOBU) ensures security and transparency during its presale, with verified token allocations, governance participation, and structured stages. Early investors benefit from a reliable system that rewards loyalty and long-term commitment while capitalizing on market dips.
The MoonBull presale is creating waves as investors hunt for opportunities in today’s dip market. With Stage 6 live, early participants are seeing eye-popping ROI while the project demonstrates stability even in bearish conditions. Combining referral rewards, governance, and staking, MoonBull ($MOBU) is positioned to outperform competitors. With 23 presale stages and growing momentum, this is the chance to secure a stake in the top 1000x crypto presale, ride massive gains, and capitalize on one of the most promising meme coins of 2025.
This content is for informational purposes only and does not constitute financial advice. Cryptocurrency investments, including MoonBull ($MOBU), carry high risk. Always conduct your own research and consult a financial advisor before investing.
Disclaimer: This is a sponsored press release for informational purposes only. It does not reflect the views of Times Tabloid, nor is it intended to be used as legal, tax, investment, or financial advice. Times Tabloid is not responsible for any financial losses.
Jakarta, Pintu News – The price of Dogecoin has recently fallen sharply, mirroring Bitcoin’s precipitous drop below $100,000 as well as the overall crypto market weakness. Market sentiment shifted from optimism to caution overnight, as increasedwhale activity triggered a massive wave of sell-offs.
A total of $700 million worth of DOGE was recorded flowing out of the wallets of large holders, amplifying downward pressure and raising concerns among retail traders.
When the price broke the crucial level at $0.16466, the bearish technical signal became undeniable, signaling a breakdown. Amidst these tense market conditions, investors began to question: will DOGE find a stabilizing point soon, or will it continue to fall deeper?
On November 18, 2025, Dogecoin’s price fell by 5.53% over the past 24 hours, trading at $0.1513, or approximately IDR2,543. During that period, DOGE fluctuated between IDR2,739 and IDR2,511.
At the time of writing, Dogecoin’s market capitalization is estimated at around IDR385.95 trillion, with a 24-hour trading volume of approximately IDR47.67 trillion.
Looking at Dogecoin’s 4-hour chart (11/17), the price action shows a story of resilience being tested by market pressure. DOGE price slipped below the 78.6% Fibonacci retracement level at $0.16466 and briefly traded around $0.1619 – recording a daily decline of 0.69% and a weekly decline of 10.56%.
Technical signals remain bleak, with the RSI dropping to 45.99 and approaching theoversold area. Currently, the nearest support level is at the October low of $0.1525. If the selling pressure from the bears breaks this level, the next downside target is around $0.14.

Every time the price retests this support, the risk for the bulls increases, especially since many stop-losses are embedded below the Fibonacci zone, which could accelerate the decline. Meanwhile, the 200-day SMA which is now well above, at $0.20925, makes it clear how far the DOGE price has moved away from its intermediate trend.
For price watchers hoping for a recovery, the key point to watch is $0.171. A daily close above this level could trigger short-term bullish momentum and prompt a quick rise towards $0.18766.
However, as long as buyers haven’t returned significantly to reclaim lost territory, sentiment remains skewed towards the bearish side.
Read also: Ethereum Plunges to $2,900 Today — Is a Recovery on the Horizon for ETH?
If the next support at $0.1525 is broken, the decline could quickly continue to $0.14. Conversely, if there is a breakout above $0.171, the sentiment could change and open up opportunities for a quick rise in the higher price range.
The movements of DOGE are known to be quite fast and often surprising. Based on the current momentum, a possible drop to $0.1525 or a bounce to $0.171 could occur in the next 3 to 5 trading sessions.
That’s the latest information about crypto. Follow us on Google News to get the latest crypto news about crypto projects and blockchain technology. Also, learn crypto from scratch with complete discussion through Pintu Academy and stay up-to-date with the latest crypto market such as bitcoin price today, xrp coin price today, dogecoin and other crypto asset prices through Pintu Market.
Enjoy an easy and secure crypto trading experience by downloading Pintu crypto app through Google Play Store or App Store now. Also, get a web trading experience with various advanced trading tools such as pro charting, various types of order types, and portfolio tracker only at Pintu Pro.
*Disclaimer
This content aims to enrich readers’ information. Pintu collects this information from various relevant sources and is not influenced by outside parties. Note that an asset’s past performance does not determine its projected future performance. Trading crypto carries high risk and volatility, always do your own research and use cold hard cash before investing. All activities of buying and selling bitcoin and other crypto asset investments are the responsibility of the reader.
Reference:
Cardano (ADA) is stabilizing around the daily support level of $0.45 at the time of writing on Tuesday, after correcting nearly 4% the previous day. Despite the recent dip, on-chain and derivatives indicators are showing early signs of recovery, with the Market Value to Realized Value (MVRV) ratio undervalued and funding rates turning positive. On the technical side, if price action holds above the key $0.45 support level, ADA could be positioned for a short-term rebound.
Santiment’s Market Value to Realized Value (MVRV) metric is used to identify whether a token is undervalued or overvalued in a given time frame. The 30-day and 7-day MVRV ratios for Cardano read negative 20.47% and 13.44% respectively. This means that ADA is currently undervalued.
These negative MVRV values could be interpreted as a buy signal, likely increasing buying pressure on the token across crypto exchanges. Historically, when MVRV has dropped to similar levels, the ADA price has often recovered.
Apart from the undervalued conditions, the derivatives data also support a recovery rally for Cardano. Coinglass’s OI-Weighted Funding Rate data shows that the number of traders betting that the price of ADA will slide further is lower than those anticipating a price increase.
The metric has flipped to a positive rate, standing at 0.0060% on Tuesday, indicating that longs are paying shorts. Historically, as shown in the chart below, when the funding rates have flipped from negative to positive, Cardano’s price has rallied sharply.

Cardano’s price broke below the key support at $0.49 on Sunday and declined nearly 8% until the next day. At the time of writing on Tuesday, ADA hovers above the daily support at $0.45.
If the $0.45 level continues to hold as support, it could extend the rally toward the next resistance at $0.49. A successful close above this level could extend additional gains toward the 50-day EMA at $0.62.
The Relative Strength Index (RSI) is hovering around 28, deep in oversold territory, indicating that bearish momentum may be fading. For the recovery rally to be sustained, the RSI must move above its neutral level.

On the other hand, if ADA closes below $0.45, it could extend the decline toward the key psychological level at $0.40.


