The main category of Crypto News.
You can use the search box below to find what you need.
[wd_asp id=1]
The main category of Crypto News.
You can use the search box below to find what you need.
[wd_asp id=1]
XRP is entering a pivotal breakout phase this week as anticipation builds around Franklin Templeton’s new EZRP Spot XRP ETF, which launches on November 18 and has already fueled a surge in market activity.
Trading around $2.21, the XRP price today is holding firmly above the critical $2.15 support level—an area analysts say could trigger a bullish continuation toward the $2.40–$2.70 range if defended. With multiple XRP ETFs rolling out, rising XRP Ledger activity, and renewed confidence following recent regulatory clarity, market sentiment is shifting toward a stronger medium-term outlook for Ripple’s native asset.
XRP is trading near $2.21, up 1.87% over the past 24 hours, with daily trading volume above $5.25 billion, according to the latest XRP price chart readings. The XRP market cap remains strong as the asset consolidates above key support zones, supported by institutional flows and rising activity on the XRP Ledger.
XRP’s $2.15 support level is crucial, with potential to climb to $2.40–$2.70 if maintained. Source: @ali_charts via X
Market analyst Ali (@ali_charts), known for on-chain technical assessments, highlighted the importance of the current support region, stating, “$2.15 is the line in the sand for XRP. Hold it, and a move to $2.40–$2.70 becomes likely.”
His view is based on XRP’s repeated defense of the support range on the 1-hour chart, where price has stabilized during earlier periods of volatility. The XRP price today remains resilient following a 21% rally tied to the first XRP spot ETF launched on November 13, helping create a constructive short-term environment despite broader market pullbacks.
Attention is now turning to the upcoming launch of Franklin Templeton’s Spot XRP ETF (EZRP) on November 18, 2025. Analyst Amonyx (@amonbuy) shared the scheduled launch publicly, observing that Franklin Templeton’s involvement adds legitimacy due to the firm’s long institutional track record.

Franklin Templeton’s Spot XRP ETF (EZRP) is set to launch tomorrow, signaling bullish momentum. Source: @amonbuy via X
This follows Canary Capital’s XRP ETF debut on November 13, marking two XRP-focused ETFs within a single week. Community projections on X suggest the EZRP rollout may generate strong inflows, but these early estimates are speculative rather than based on formal modeling. Historically, inflows into new digital-asset ETFs depend heavily on liquidity conditions, macro sentiment, and overall market risk appetite.
As of November 17, XRP trades around $2.20, reflecting a 7% cooling from recent highs. Analysts note that ETF-driven accumulation may help stabilize price, but short-term risks remain—such as periodic whale distribution, varying liquidity depending on session hours, and the arrival of more ETF products from Bitwise, 21Shares, and others through November 25.
Meanwhile, the Ripple vs. SEC legal backdrop still influences investor expectations. Although no new filings emerged this week, earlier rulings—especially Judge Torres’ clarification differentiating institutional versus secondary-market XRP transactions—continue to shape the regulatory narrative.
The Ripple–SEC case saw no major developments this week, yet it remains relevant to XRP news today. Regulatory clarity matters even more as XRP enters deeper institutional territory with additional ETF approvals underway. Analysts note that smooth ETF progression signals improved comfort among regulators with XRP’s market behavior, but unresolved aspects of the lawsuit mean further volatility cannot be ruled out.
Ripple’s partnerships and rising XRP Ledger transaction volume continue to strengthen underlying fundamentals. Still, any new motions or rulings could influence the medium-term XRP price prediction outlook.
Technical analyst TradeCityPro, known for volume-profile and liquidity-structure studies, highlights XRP’s strong position as the 4th largest crypto, with a market cap of roughly $136.74 billion.
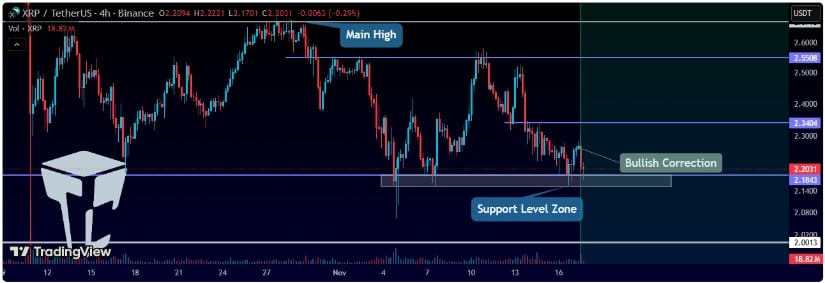
XRP tests key $2.1843 support, with potential resistance at $2.34–$2.67 as volume remains low. Source: tradecitypro on TradingView
On the 4-hour chart, XRP is testing a critical support zone at $2.1843, a level aligned with high-volume nodes. He identifies the following levels:
Breakouts historically require a clear rise in buy-side volume. A failure to defend $2.18 could invite additional correction.
XRP is approaching a pivotal point with the launch of Franklin Templeton’s EZRP spot ETF, a development that stands to influence both liquidity and institutional participation. Maintaining the $2.15–$2.18 support area remains critical for keeping momentum toward the $2.40–$2.70 target identified by several technical analysts.
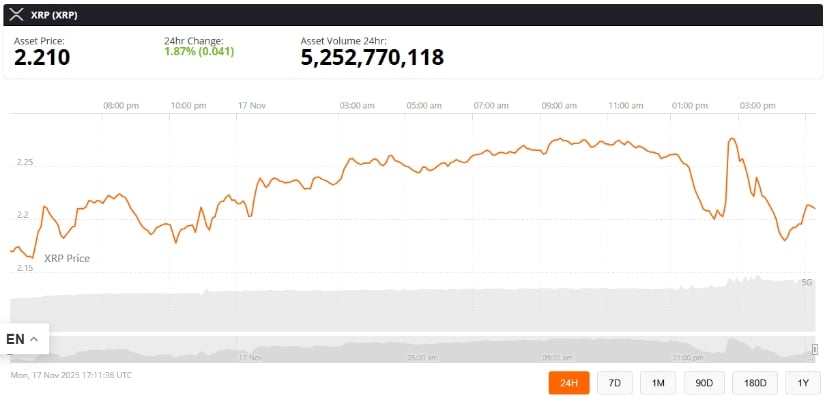
XRP was trading at around 2.21, up 1.87% in the last 24 hours at press time. Source: XRP price via Brave New Coin
While the broader outlook appears more constructive than in recent months—due to ETF demand, Ripple’s expanding ecosystem, and growing on-chain activity—analysts emphasize the importance of balancing optimism with realistic risk evaluation. Factors such as liquidity shifts, regulatory updates, and asset-specific volatility remain central considerations.
Solana price is testing a major support zone after a sharp drop, leaving participants watching closely to see whether a breakdown or short-term rebound comes next.
The Solana price has slipped into one of its most critical moments of the year, with the price now trading at levels not seen in months and sentiment growing increasingly cautious. After weeks of steady downside pressure, participants are watching SOL closely as it hovers above a major support zone that has historically triggered big moves in either direction.
Solana price has now slipped to a fresh 5-month low, trading around $138, which places SOL right on top of a critical historical support band. The multi-month chart shows how price has been steadily grinding lower from the $210 to $220 peak, forming a clear sequence of lower highs and lower lows, signaling sustained weakness.
Solana current price is $138.57, up 0.33% in the last 24 hours. Source: Brave New Coin
The broader structure also shows price sitting well below its 200-day SMA, while volume has thinned considerably during the drop, typically a sign of fading buyer participation. If SOL Solana price loses the $135–$138 shelf, the next clean technical magnet appears near $120, where previous ranges consolidated before the breakout.
The chart Henry shared captures Solana exactly at a do-or-die support zone, where the entire mid-range has been tested multiple times across the year. The red support block around $134 to $140 is being stressed again, and the repeated tests show weakening absorption. But the zone hasn’t broken yet, creating a genuine pivot point.
Two scenarios emerge:
If buyers defend the zone, SOL could rebound towards $165–$175, where the next major supply block sits.
If the level finally breaks, price opens directly into the empty range beneath, with downside levels at $120, $105, and even $98 visible on the chart.
Everything now hinges on how SOL reacts to this support after its multi-day selloff. One impulse of news, as Henry noted, could decide the direction.

Solana price is now sitting on a heavily tested support zone between $134 and $140 as participants watch for a rebound or a clean breakdown towards the lower range. Source: Henry via X
Lower-timeframe structure has started flashing early signs of slowing bearish momentum. Umair’s chart shows double bullish divergences forming on the 4H RSI and also confirmed on the daily timeframe, even as price continues to push deeper into support.
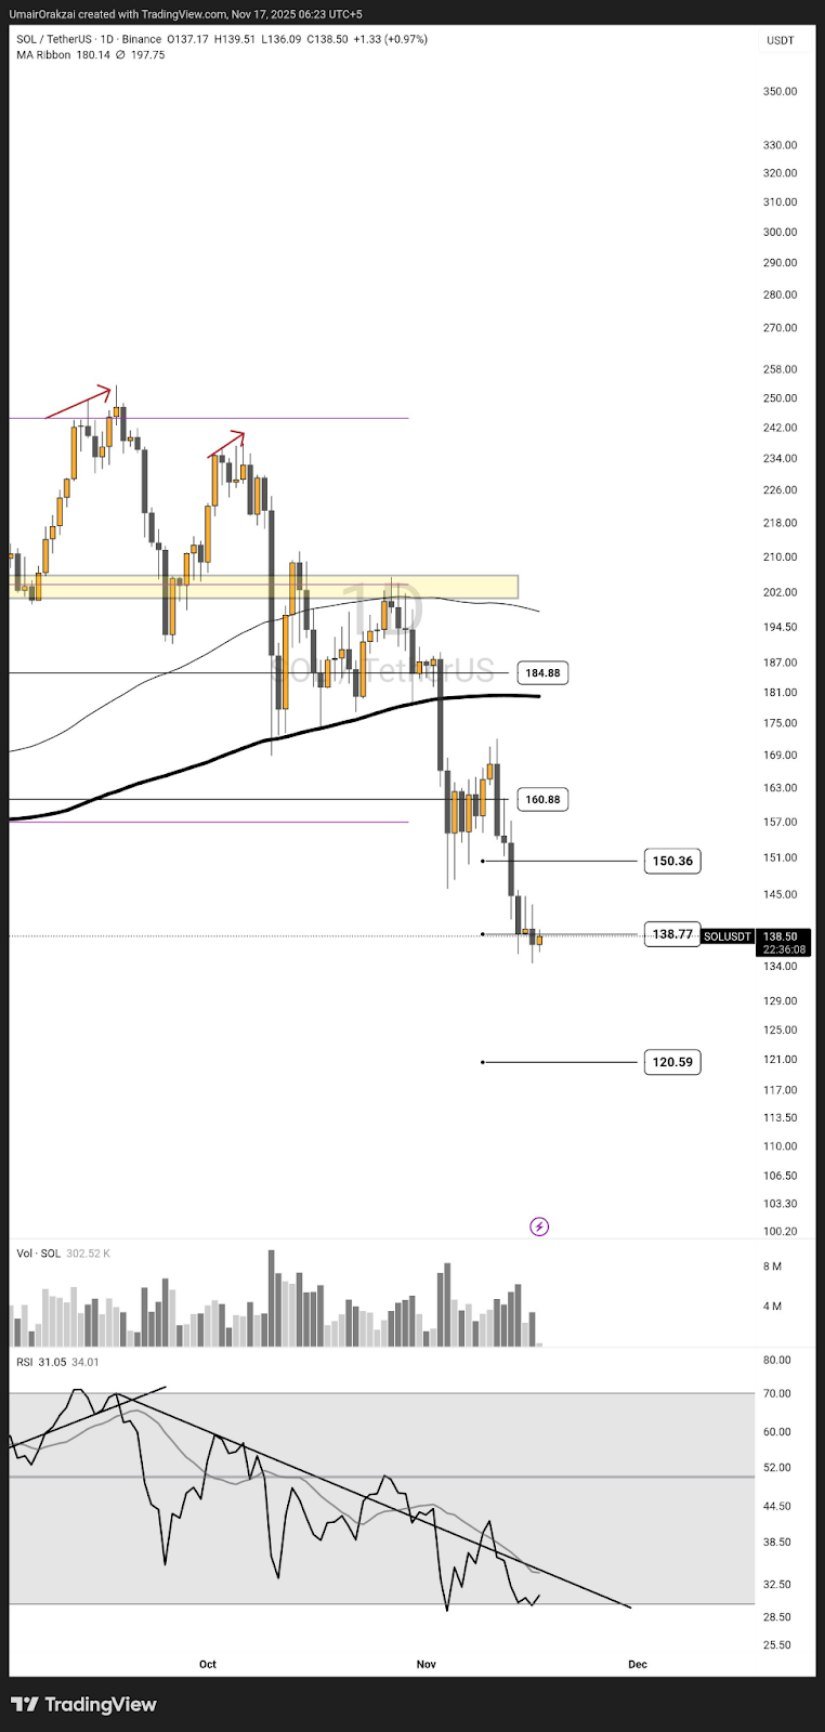
Solana is showing early bullish divergences on both the 4H and daily RSI, hinting at fading bearish momentum despite price sitting near key support. Source: Crypto Umair via X
Price is currently hovering near $138, just under the 150.36 level that previously acted as a mid-range pivot. These bullish divergences often precede relief rallies, provided they don’t get invalidated with a sudden flush lower. If SOL holds above this region, a rotation into $150, then $168, becomes possible.
But if these divergences break and price closes decisively under $134, the expected squeeze to the downside could unfold rapidly, trapping early long positions.
A fresh TD Sequential “1” buy signal has now appeared on Solana’s chart, hinting at a potential short-term bottom forming after an extended sequence of consecutive red candles. This indicator typically appears near exhaustion points when selling momentum begins to fade.
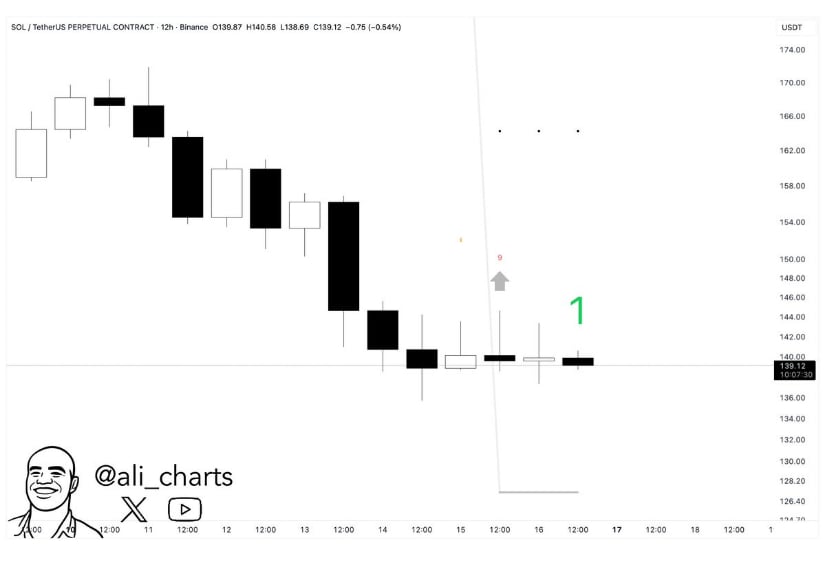
Solana has printed a fresh TD Sequential “1” buy signal near the $138–$142 zone. Source: Ali Martinez via X
From the Ali Martinez chart, the cluster of small-bodied candles around $138 to $142 reinforces the idea of slowing downside pressure. If the TD setup plays out properly, Solana price could attempt a short-lived recovery towards $150 to $155 before facing any meaningful resistance. But like all counter-trend signals, it requires confirmation, especially while higher-timeframe structure remains fragile.
Solana sits at a critical juncture where multiple signals intersect: weakening structure on the macro chart, bullish divergences on lower timeframes, and a TD buy signal hinting at possible stabilization. The confluence of these signals suggests that Solana price is entering a decision zone rather than a continuation phase.
While deeper SOL levels like $120 and $105 remain open if support breaks, any sustained defense of $135 to $140 could quickly shift momentum back towards $160+. Participants will be watching for whether technical exhaustion turns into a meaningful bounce, or whether this becomes another breakdown in the broader downtrend.
Kim shared his forecast on social media X, responding to a projection from Grok AI that Bitcoin might reach $175,000 by the end of the year, as per a Cryptonews report. At the time, Bitcoin was trading around $95,400. Kim added that if his prediction comes true, he plans to donate 100% of his Bitcoin profits to build churches for Jesus Christ in every nation, as per his X post.
This isn’t Kim’s first ambitious Bitcoin call. On September 29, he claimed that, as the “world’s highest IQ record holder and Grand Master of Memory,” Bitcoin is “the only hope for the future economy,” as quoted by Cryptonews.
Kim has claimed that he has converted all his assets into Bitcoin and expects it to appreciate 100x over the next decade, potentially surpassing $10 million per coin, as per the report. He also predicts that Bitcoin will become the world’s “ultimate reserve asset,” overtaking gold, foreign currencies, and US Treasuries, reported Cryptonews.
ALSO READ: Fidelity’s 401(k) shutdown sparks fury — company claims safety, clients cry foul
The 36-year-old founder of the United Sigma Intelligence Association has amassed a large online following, but his claims have been heavily questioned. Psychometric experts have cast doubt on his IQ assertions, and Paul Cooijmans of the Giga Society previously described Kim as a “pathologically lying impostor” in an interview with VICE, as per the Cryptonews report.
Even some Bitcoin bulls are cautious about Kim’s $220,000 target. The cryptocurrency market has been volatile and over the past 41 days, it has lost $1.1 trillion in total market capitalization, with Bitcoin alone shedding more than $400 billion, as per the report. Current market cap levels are roughly 10% below the figures recorded during the $19 billion liquidation on October 10, reported Cryptonews.
The decline began with institutional outflows in mid-to-late October, followed by $1.2 billion in crypto fund outflows in the first week of November, as per the report.
Analysts note that these liquidations have made the market choppy, challenging the plausibility of Kim’s near-term prediction, as per Cryptonews. Over the last 16 days, there have been three days with liquidations exceeding $1 billion, and daily liquidations above $500 million have become common, as per the report.
Arthur Azizov, founder and investor at B2 Ventures, explained that Bitcoin’s recent drop to the $95,000–$96,000 range is a result of shifting sentiment and spot ETF outflows, reported Cryptonews. He noted that the fall below the $100,000 level confirmed a descending channel forming since mid-October, as per the report.
Azizov urged investors to watch the $89,000–$94,000 zone, where liquidity is concentrated. He said that, “If sellers keep putting pressure, the worst-case scenario is a return to the April 2025 $72,000–$74,000 band, where a real bullish impulse began and let BTC rise almost to $127,000, setting a new all-time highm,” as quited by Cryptonews.
What is world’s smartest man’s latest Bitcoin price prediction?
He predicts Bitcoin could reach $220,000 within the next 45 days.
How is the Bitcoin USD market performing currently?
Over the past 41 days, the crypto market lost $1.1 trillion, with Bitcoin alone shedding over $400 billion.
Dogecoin (DOGE) is having a rough go of it, trading around $0.161 today. That price tells the whole story – the coin is down an enormous 47% since its peak in September. And if you look at the weekly chart, it’s been a brutal run of red week after red week.
It’s no surprise the big question now is how much further DOGE could fall. Our Dogecoin price prediction points to a potential crash as low as $0.10. Hitting that would be the coin’s lowest level in over a year.
However, it’s not just Dogecoin’s own technicals that are looking weak. Almost the entire meme coin sector is bleeding right now, creating an environment that makes it nearly impossible to post gains.
But despite that environment, some traders are putting their spare funds into the Maxi Doge (MAXI) presale. It seems they’re seeking a fixed-price entry to avoid the chaos of the open market – making for a curious trend while Dogecoin sells off.
This publication is sponsored. CryptoDnes does not endorse and is not responsible for the content, accuracy, quality, advertising, products or other materials on this page.
Let’s break down why a drop to $0.10 is a possibility for Dogecoin. The main reason is that the charts are already setting it up. A fall to that level would be a 37% decline from today’s price.
Look at the 4-hour timeframe and you’ll see the 50-period moving average (MA) is sloping down, confirming that the short-term trend is bearish. On the daily chart, the same MA is sitting comfortably above the price, acting like a ceiling that caps any rebound attempts.

The real worry is what happens if DOGE closes below the $0.16 support level. Analysis from @ali_charts shows that there’s very little buying interest below that level, with a liquidity gap extending all the way down to near $0.073. So if $0.16 gives way, the drop could accelerate rapidly with nothing to stop it.
Add to that the double-top pattern around $0.183 – which means buyers got exhausted twice at the same high – and you have a lineup of negative catalysts. With Bitcoin also struggling below $96,000, the case for a drop to $0.10 becomes hard to ignore.
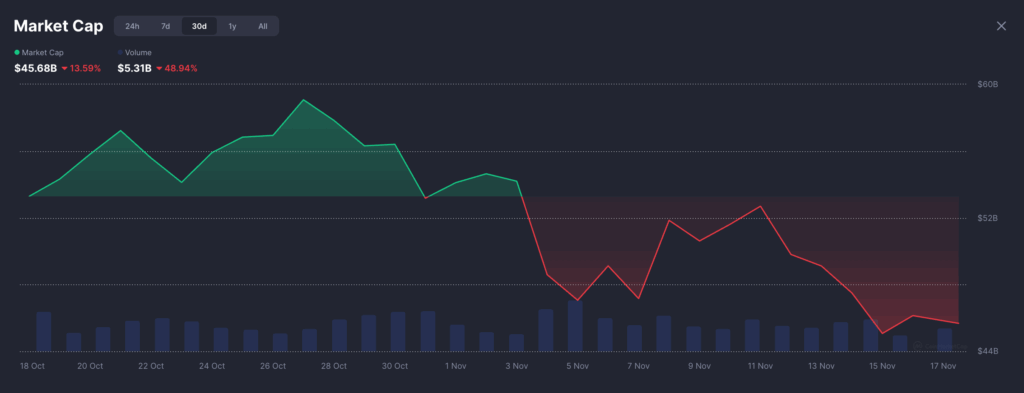
It’s not just DOGE – the entire meme coin space is down, with its total value dipping below $46 billion. Nearly every major meme coin is in the red this past week, many down double-digits, and SPX6900 (SPX) got hit hardest with a 30% plunge.
That drop in total value points to a full-blown liquidity crisis. Trading volume across the category is down 49% since last month, indicating that buyers have largely left. Sellers are there, but they can’t find enough demand, creating a vicious cycle where lower prices scare away even more buyers.
Meanwhile, capital is rotating into other niches. Privacy coins, for instance, have grown to a $68 billion market cap, now bigger than the entire meme coin sector. People are starting to prioritize projects with utility.
And lastly, the sector is completely oversaturated. With thousands of new meme coins launching every week on platforms like pump.fun, there’s just not enough attention (or money) to go around. It’s a dilution nightmare.
With all that gloom, why has the Maxi Doge (MAXI) presale managed to raise over $4 million? It boils down to a different kind of value proposition. In a volatile market like this, MAXI’s fixed presale price ($0.0002685) offers a clear entry point. You don’t have to worry about slippage or daily swings.
Maxi Doge’s team is also betting on active engagement. Their roadmap includes weekly trading competitions with prizes in MAXI and USDT, as well as a staking mechanism offering a 76% APY for presale participants. This staking mechanism is already live while the presale is ongoing.
Another hook is the planned integration with futures platforms. The goal is to list MAXI on derivatives exchanges, making it viable for leveraged trading. That kind of derivatives access is extremely rare for a new meme coin.
Maxi Doge’s roadmap has caught the attention of some big-name crypto YouTubers. For example, Nazza Crypto released a video earlier this month discussing how the MAXI presale is “going crazy.”
Ultimately, MAXI’s appeal comes down to this: a fixed-price presale entry with immediate staking rewards and a plan for post-launch activity. Compared to Dogecoin’s current situation, that feels like a completely different risk profile with far more upside.
This publication is sponsored. CryptoDnes does not endorse and is not responsible for the content, accuracy, quality, advertising, products or other materials on this page. Readers should do their own research before taking any action related to cryptocurrencies. CryptoDnes shall not be liable, directly or indirectly, for any damage or loss caused or alleged to be caused by or in connection with use of or reliance on any content, goods or services mentioned.

Nikolay is a cryptocurrency analyst and market writer with years of experience tracking digital asset trends and emerging blockchain technologies. A long-time crypto enthusiast, he actively trades across major exchanges and specializes in identifying early-stage projects and meme tokens. His analysis combines technical insight with a strategic, long-term investment perspective.

Ripple (XRP) is sending mixed signals, trading around $2.27 at the time of writing on Monday. The cross-border remittance has faced a series of declines and liquidations, leaving investors counting losses since its record high of $3.66 on July 18.
Chainlink (LINK) is trading above $14.00 at the time of writing on Monday, as the broader cryptocurrency market mildly recovers following last week’s volatility and extended sell-off.

Bitcoin (BTC) offers subtle signs of recovery, trading above $95,000 at the time of writing on Monday. Altcoins, including Ethereum (ETH) and Ripple (XRP), are making recovery attempts, following in BTC’s footsteps, with ETH hovering below $3,200 and XRP trading around $2.27.

Speaking at The Bridge conference in New York City, Bassili noted that while Solana is not yet universally accepted as the definitive “third asset”, it is clearly the one most institutions are evaluating.
Despite posting impressive gains this year, XRP still lags behind in key metrics that matter most to institutions, particularly network velocity and active liquidity participation.
According to Bassili, without strong signals of real-world usage, major investors are unlikely to elevate XRP into the top 3.
As per the chart below, Solana is cooling down after a brief corrective phase, with current price action focused around the $142–$145 range.
SOL recently broke through a short-term descending trendline as well while buyers defended the lower support band shown in green.
If SOL breaks above $150, the next level to keep an eye on is the broader resistance cluster between $185 and $200.
Should bulls clear this red zone decisively, the next target is the $300 region, a potential 110% surge from current levels.
Source: TradingView
Notably, the Relative Strength Index (RSI) is recovering from oversold levels and the MACD is giving early signs of trend reversal.
Investors can expect SOL to turn volatile in the short term.
Bassili said that institutions are not merely following narratives but they are following data.
Solana’s expanding ecosystem activity, liquidity depth, and improving market structure make it lucrative while XRPL has yet to show similar strength.
While Solana prepares for a major breakout, Bitcoin Hyper ($HYPER) is bringing its speed and low fees to the world of Bitcoin.
This new Layer-2 solution uses the same powerful tech that powers Solana apps, allowing Bitcoin holders to send transactions in seconds, pay almost no fees, and access a whole new world of crypto apps.

Bitcoin Hyper keeps Bitcoin’s rock-solid security intact while solving its biggest problems, like slow speeds and limited utility.
Now, users can trade, stake, earn yield, and even mint NFTs without leaving the Bitcoin ecosystem.
So far, $27.8 million has poured into the presale, and the current token price is just $0.01325. The next increase hits in a few hours.
Early buyers can also stake $HYPER for up to 41% annual rewards.
To grab $HYPER at its current price, just head to the official Bitcoin Hyper website and connect a wallet like Best Wallet.
You can complete the purchase in seconds using crypto already in your wallet or simply pay with a debit or credit card.
Disclaimer: Coinspeaker is committed to providing unbiased and transparent reporting. This article aims to deliver accurate and timely information but should not be taken as financial or investment advice. Since market conditions can change rapidly, we encourage you to verify information on your own and consult with a professional before making any decisions based on this content.

A crypto journalist with over 5 years of experience in the industry, Parth has worked with major media outlets in the crypto and finance world, gathering experience and expertise in the space after surviving bear and bull markets over the years. Parth is also an author of 4 self-published books.
That’s it. I’m done. I’m done with crypto. Lamest bull market of my life. didn’t even make it to 150k. Tom Lee’s Ethereum price prediction was wrong, and ETH made a new ATH for all of two seconds. There was no alt season.
And the only coins that did anything notable were flagrant casino 1000x tokens. Future of finance my ass.
Meanwhile, Ether cracked below the $3,100 level for the first time since early November, slipping to $3,066 on Sunday during a broader crypto pullback.
The drop came alongside a surge in ETF redemptions and growing concerns that Ethereum is becoming the “risk-on” trade of the sector. So what’s going on with Ethereum? Is it dying?
DISCOVER: 20+ Next Crypto to Explode in 2025
Investment manager Timothy Peterson highlighted a worrying trend that isn’t visible in headline ETF flows.
“Spot ether ETFs posted net outflows in four of the past five weeks, totaling roughly 7 percent of cost-basis capital,” Peterson said.
Cost-basis withdrawals track how much of the original capital committed to an ETF is leaving and it isn’t look good for Ethereum. Rising redemptions here show conviction weakening among long-term holders, not just traders repositioning.
It leaves our Ethereum price prediction showing that the price will not be near the ATH again for the rest of 2025. Not good.
DISCOVER: Next 1000X Crypto: 10+ Crypto Tokens That Can Hit 1000x in 2025
A sweep across key analytics platforms adds more context to the ETH price:
CoinGecko: Ether down 11 percent in 24 hours
DeFi Llama: ETH TVL fell 2.1 percent this week, reversing prior gains
FRED (Rates): Long-term yields remain elevated, restraining risk assets
Despite the volatility, ETH still trades comfortably above its 200-day moving average near $2,550, a level that has historically defined cycle support zones.
Ethereum’s 4-hour chart shows price locked inside a narrowing falling wedge, which is a corrective pattern that often precedes upside breaks. ETH has repeatedly been rejected at the upper trendline and the stacked supply zones near $3,550 and $3,800.
A decisive reclaim of $3,350 will flip the short-term trend and open a path back toward $3,550. Failure keeps the wedge intact and elevates the risk of a $3,000 retest or even a quick liquidity sweep below it before any true reversal.
Ether slipping under $3,100 says more than a bad trading day. ETF outflows, shaky macro signals, and stubborn resistance have all piled onto the chart at the same time.
Bitcoin, currently trading at $95,663.59, is at a turning point as it reaches the 61% Fibonacci retracement level. This technical marker often signals a potential bullish reversal, leading investors to speculate on future price movements. With Bitcoin’s transaction volume surging to 308 million and a year-to-date increase of over 11%, market dynamics are shifting fast. Let’s explore how these factors influence Bitcoin price prediction today.
Fibonacci retracement levels are widely used by traders to predict potential market reversals. Bitcoin’s current move to the 61% retracement at $95,663.59 is significant. This level often represents a strong support point where downtrends may reverse. Given Bitcoin’s recent trading history, such markers become even more crucial.
Investors watch these technical indicators closely. Historically, reaching this level has preceded upward movements. The surge in transaction volume reflects heightened interest, suggesting a potential bullish reversal for Bitcoin. How traders respond now could adjust market momentum.
Today, Bitcoin’s price has slightly dropped by 3.97%, but it remains well above its year low. The Relative Strength Index (RSI) at 31.33 indicates that Bitcoin is oversold, which might entice buyers.
Bitcoin’s Market Cap stands at an impressive $1.86 trillion, underscoring its major role in the crypto market. Despite a recent downturn, the Optimized Moving Average Envelope signals potential for recovery, keeping investors optimistic.
On social media, Bitcoin discussions are buzzing, reflecting growing interest. An analysis on Brave New Coin discusses the significance of the Fibonacci level, influencing sentiment.
Bitcoin’s technical indicators present a mixed but hopeful outlook. The MACD and Awesome Oscillator both remain negative, but the ADX of 33.46 suggests a strong trend. The Bollinger Bands put the lower band near $96,402.23, which can act as a support level.
Stochastic indicators suggest that Bitcoin might soon reverse course, potentially leading to a bullish trend. This possibility, combined with technical insights, makes current levels attractive for both short-term traders and long-term investors. The volume trends also support this outlook.
The convergence of these technicals and market dynamics gives a rounded view of Bitcoin’s potential price action. Forecasts suggest a potential yearly high of $126,296, considering the current trajectory and technical support.
Investors should monitor these indicators closely. If Bitcoin holds above the $95,000 mark while maintaining volume, it may support further gains. The bullish sentiment seen historically at Fibonacci levels could enhance investor confidence. Traders should eye subsequent price targets and market responses to anticipate movements.
The current positioning of Bitcoin at the 61% Fibonacci retracement suggests potential for a bullish reversal, making this a pivotal moment for investors. With technical indicators showing signs of a potential upward trend, traders are closely watching market responses. For those invested in Bitcoin, it’s crucial to remain informed and responsive to new data, especially in such a dynamic marketplace. Platforms like Meyka can provide real-time analytics to keep you updated. As always, staying proactive and data-driven will help navigate these exciting waters in Bitcoin trading.
The 61% Fibonacci retracement level is often seen as a strong support level where downtrends may reverse, indicating a potential bullish turnaround for Bitcoin.
Current market sentiment, driven by technical indicators and social media buzz, supports potential bullish movements as investors react to key support levels and high trading volume.
Indicators like the RSI showing oversold conditions, along with strong ADX trends, suggest that Bitcoin may be poised for a bullish reversal as it hovers around key technical levels.
Disclaimer:
The content shared by Meyka AI PTY LTD is solely for research and informational purposes.
Meyka is not a financial advisory service, and the information provided should not be considered investment or trading advice.
Jakarta, Pintu News – Dogecoin , the meme-themed crypto known for its fast transactions and low fees, has been on a downward trend for the past month. However, a change in direction is now in sight, with Dogecoin’s price movement showing a potential trend reversal supported by a cyclical pattern forming.
So, how is the Dogecoin price moving today?
On November 17, 2025, the price of Dogecoin recorded a decrease of 1.64% in 24 hours, trading at $0.1612, equivalent to IDR 2,698. In the last 24-hour period, the DOGE price moved in the range of IDR 2,769 to IDR 2,584.
As of writing, Dogecoin’s market cap stands at around IDR 406.59 trillion, with a trading volume of around IDR 30.29 trillion in 24 hours.
Read also: Bitcoin and Ethereum Prices Plunge, these 3 Altcoins Soar Up to 55% Today
At the end of last week, Dogecoin had shown a recovery after weakening at the beginning of the trading session. Throughout the day, the price moved in a consistent uptrend, reflecting the market sentiment that was starting to become positive.
The volume to market capitalization ratio stood at 4.2%, indicating normal trading activity. This movement indicates stable market interest and potential short-term consolidation.

With the gains made in the last 24 hours, Dogecoin is showing resilience to market pressures.
Observations from Bitcoinsensus reveal that Dogecoin is in a recurring low phase in its historical cyclical pattern. Throughout the year, DOGE has consistently exhibited a quiet consolidation phase followed by a sharp price spike. This pattern once pushed the price of DOGE up to 21,457.13% in the previous cycle.
Read also: Bitcoin Plunges to $94,000, Wiping Out All 2025 Gains
Although the price is currently flat, this historical pattern gives an indication that Dogecoin may be approaching an accumulation phase before a potential major rally. If this trend repeats, DOGE has the opportunity to post another significant uptrend as in previous market cycles.
That’s the latest information about crypto. Follow us on Google News to get the latest crypto news about crypto projects and blockchain technology. Also, learn crypto from scratch with complete discussion through Pintu Academy and stay up-to-date with the latest crypto market such as bitcoin price today, xrp coin price today, dogecoin and other crypto asset prices through Pintu Market.
Enjoy an easy and secure crypto trading experience by downloading Pintu crypto app via Google Play Store or App Store now. Also, get a web trading experience with various advanced trading tools such as pro charting, various types of order types, and portfolio tracker only at Pintu Pro.
*Disclaimer
This content aims to enrich readers’ information. Pintu collects this information from various relevant sources and is not influenced by outside parties. Note that an asset’s past performance does not determine its projected future performance. Trading crypto carries high risk and volatility, always do your own research and use cold hard cash before investing. All activities of buying and selling bitcoin and other crypto asset investments are the responsibility of the reader.
Reference:
Cardano price is slipping below key support levels, signaling growing bearish pressure as participants watch to see how much deeper the decline could extend.
Cardano’s latest price action has taken a sharp turn, slipping below the crucial $0.50 support and shaking confidence across the market. What looked like a steady consolidation has now turned into a clear sign of weakness, with both technical levels and on-chain flows pointing to mounting sell pressure.
Cardano has now confirmed a breakdown below the key $0.50 support, a level that held the structure. The chart shows price slipping under the horizontal zone with no significant bullish reaction, indicating weakness in demand. The lower-timeframe candles are printing consistent lower highs, and the next visible liquidity pocket sits closer to the $0.42 to $0.38 range. If this zone fails to attract buyers, ADA may drift towards deeper historical levels where volume previously accumulated.
Cardano price is trading around $0.50, down -1.64% in the last 24 hours. Source: Brave New Coin
Momentum remains soft, with sell-side pressure visible on the breakdown. Cardano will need to reclaim $0.50 quickly to avoid acceleration towards lower support blocks. Until then, the chart leans bearish, and mean-reversion attempts could remain short-lived.
Crypto Chiefs chart shows a clean structural break beneath the major mid-range level. ADA has decisively slipped below the $0.50 line, leaving a large inefficiency zone beneath it. From a pure technical standpoint, the next strong support lies at $0.25, a higher-timeframe level that previously stood as a multi-month base.

Cardano’s breakdown now exposes the high-timeframe $0.25 support as the next major target for price. Source: Crypto Chief via X
If ADA Cardano price continues its descent without forming a higher low, this $0.25 zone may become the major magnet for price. Until ADA can reclaim the broken support, rallies are likely to face resistance at the same $0.50 level now flipped into supply.
Recent on-chain activity highlights a surge in distribution among large ADA holders. Ali Martinez highlights that roughly 440 million ADA exited whale wallets within a single month, a significant sign of shifting sentiment. The declining whale holdings on the Cardano chart align with the broader price downtrend, suggesting that institutional and large retail entities have been reducing exposure rather than accumulating into weakness.
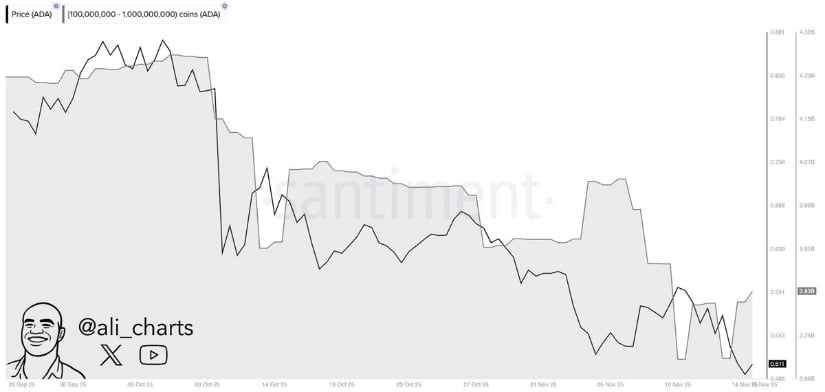
Whales have offloaded over 440 million ADA in a month, adding strong sell pressure to an already weakening chart. Source: Ali Martinez via X
This sustained outflow adds another layer of pressure on ADA, especially when paired with the loss of key technical levels. Without renewed demand, recovery attempts may remain limited as whales continue to offload during each bounce.
Following the fresh wave of smart money sell-off, a single wallet unloading 14.5 million ADA for only $850K USADA further weakened the market confidence. Such large-scale exits typically appear in capitulation phases, signaling that some participants expect more downside. Combined with the breakdown on the charts and ongoing whale distribution, this large sell adds fuel to bearish momentum.
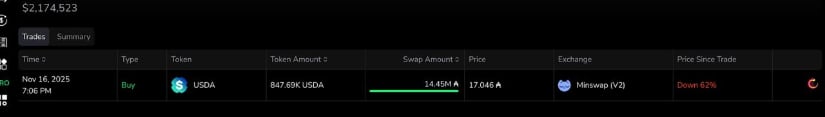
A single wallet sold 14.5 million ADA for just $850K, signaling capitulation-style pressure in the market. Source: Yasha via X
Cardano price is entering a critical phase where both chart structure and on-chain behaviour point toward further downside unless buyers step in quickly. With the $0.50 support now lost, Cardano price has no major historical demand zones until the $0.42 to $0.38 region, a range that previously acted as a swing-point during older cycles. If this band fails to generate a reaction, the high-timeframe target around $0.25 becomes the next major level.
On-chain flows continue to confirm the technical weakness. Whale supply is trending lower, large holders are exiting positions, and distribution spikes are forming right as ADA breaks support. This combination suggests ADA could remain under pressure until capitulation zones are tested or a meaningful divergence forms on higher timeframes.
For Cardano price, reclaiming $0.60 is the first sign of structural repair. Only above this reclaimed base can ADA attempt a move towards $0.68 to $0.72 again. Until then, the market leans defensive, liquidity remains lower, and price could explore deeper supports before any sustainable recovery sets in.


