The main category of Crypto News.
You can use the search box below to find what you need.
[wd_asp id=1]
The main category of Crypto News.
You can use the search box below to find what you need.
[wd_asp id=1]
XRP is showing signs of resilience as it holds $2 key support, sparking optimism among traders amid a volatile crypto market. Analysts are watching closely for potential rebounds.
The cryptocurrency has experienced notable swings in recent weeks, influenced by both market trends and regulatory developments. With Ripple’s recent initiatives and growing institutional interest, XRP may be positioned for a strong recovery toward the $5 mark.
XRP has recently stabilized near the $2 mark after a period of heightened volatility in the cryptocurrency market. Analysts and traders have noted that this level has acted as a strong horizontal support, preventing further declines and positioning the digital asset for a potential recovery. As of November 5, 2025, the XRP price today hovers around $2.22, following a rebound from its recent dip.
$XRP is expected to hold strong support around the $2 level. Source: Ali Martinez via X
Crypto analyst @ali_charts confirmed their October 31 prediction that XRP would find support at $2, a forecast that has now materialized. The chart from TradingView shows XRP’s daily price action on Binance, highlighting the $2 support level amid a broader downtrend from summer highs near $3.
“This support line has historically held during 20-30% corrections,” the analyst noted. “The current dip provides more clarity and may pave the way for a significant upside.”
In addition to technical support, Ripple XRP news highlights the launch of Ripple Prime, a new U.S.-focused crypto exchange that facilitates spot trading for institutional clients. The platform resulted from Ripple’s acquisition of Hidden Road and now enables over-the-counter (OTC) trading for large-scale investors.

Ripple Prime officially launches in the U.S., offering clients OTC spot trading for major digital assets and stablecoins, including $XRP and $RLUSD. Source: Ripple via X
Trading volumes on XRP have leaped, almost doubling to $8 billion—or about 6% of XRP’s circulating supply. Such liquidity may solidify xrp price prediction for 2025 by giving the token a basis to recover toward $5, some analysts say.
Although it has recently declined, technical indicators are showing a bullish scenario. XRP seems to form a bearish Bat harmonic pattern on the daily chart, hence a structure that normally forms in front of a potential reversal. The point C of this pattern, around $2.2285, has acted as a support, while the 200-day moving average, near $2.6235, is a key resistance.
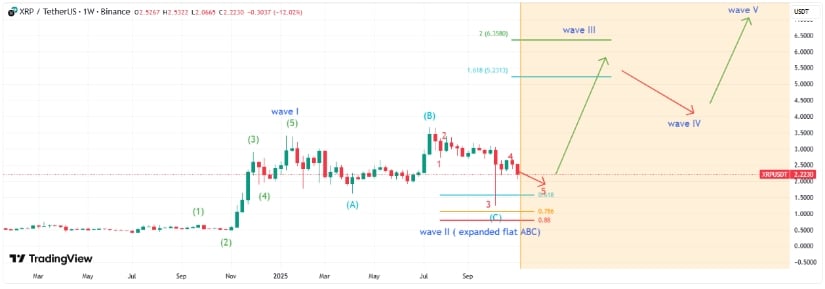
The recent dip clarifies XRP’s weekly Elliott Wave pattern: Wave II is ending, and while a Wave 5 downside may form, it’s likely truncated and won’t break Wave 3’s low. Source: abdulahalkasid on TradingView
If XRP maintains its position above Point C and continues to gain momentum, it may move toward the potential reversal zone between $2.99 and $3.10. This setup indicates a near-term upside potential of approximately 34% from current levels, reinforcing the optimistic outlook for XRP price forecasts.
Analysts believe the price action of XRP will be determined by how the cryptocurrency behaves at its present support levels. If the token holds its current position above $2 and consolidates for a strong upward move, technical forecasts place the price closer to $5 in the next few months, backed by Elliott Wave patterns pointing toward the upside.
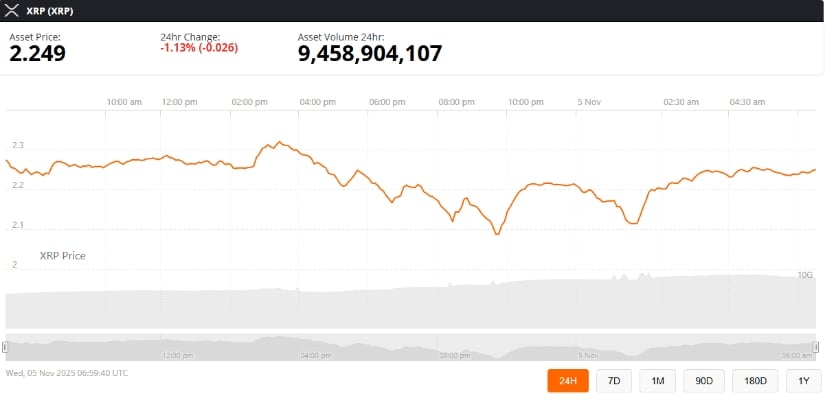
XRP was trading at around 2.25, down 1.13% in the last 24 hours at press time. Source: Brave New Coin
Failure to do so could mean a deeper pullback toward $1.60, though analysts consider this less probable given the prevailing market conditions. The neutral scenario is that XRP might consolidate between $2 and $2.50 before breaking out, establishing a very solid foundation for future gains. Analysts emphasize the importance of keeping a close eye on both technical indicators and macro market developments in light of ongoing regulatory updates that shape investor sentiment.
Other influences on XRP’s recent volatility have included regulatory updates, such as developments regarding the XRP SEC lawsuit. The resolution of some of these regulatory uncertainties has increased investor confidence and helped stabilize XRP.
This, combined with the possible approval of ETFs and continued institutional adoption, paints a bright outlook for XRP.
With XRP changing hands above the key support of $2 and growing institutional interest in the digital asset, the token seems well-positioned for a rally toward $5.
Market participants should continue to keep a close eye on the ongoing behavior of technical indicators, market sentiment, and regulatory developments that will materialize the price predictions of XRP for 2025.
The
cryptocurrency market crashed for a second consecutive day today (Wednesday), 5
November 2025, losing over $1 trillion in market capitalization since early
October as Bitcoin, Ethereum, XRP and Dogecoin prices led a broad-based
selloff.
The entire
crypto ecosystem is experiencing dynamic declines with Ethereum at $3,303 (after
-16% two-day crash), Bitcoin testing $100,000 psychological support, and major
altcoins extending losses as institutional investors rotate out of digital
assets.
In this
article, I examine why crypto is going down and conduct a technical analysis of
the BTC/USDT, XRP/USDT, ETH/USDT and DOGE/USDT charts, based on more than 10
years of experience as a cryptocurrency investor and analyst.
Federal
Reserve Chairman Jerome Powell’s hawkish remarks downplaying December rate cuts
created the initial catalyst for crypto’s collapse. The probability of a
December cut collapsed from 96% before Powell’s press conference to just 69.3%
afterward, dampening expectations for looser financial conditions that
typically support cryptocurrency prices.
Source: Coin360
Paul Howard
from Wincent explained the market dynamics: “Cryptocurrency prices
continued to slide and were pushed lower by a lack of positive macro news.
There appears to be a big skew of selling on a major exchange which would back
up the on-chain analysis indicating this is old BTC whale selling pressure.
Dumping billions gradually into the ecosystem over the course of the last few
days is not panic selling.”
The
cryptocurrency collapse coincides with a broader tech selloff. Palantir dropped
8% despite beating earnings on valuation concerns, while Nvidia shed 4% losing
$200 billion in market capitalization. The Nasdaq fell 2% and the S&P 500
declined 1.2%, reflecting growing worries about AI-driven stock valuations.
Institutional
investors pulled $1.15 billion from Bitcoin ETFs last week, led by BlackRock,
ARK Invest, and Fidelity. This exodus signals a significant shift in sentiment
as traditional financial institutions that drove Bitcoin’s rally to $126,000 in
early October are now reducing exposure amid Federal Reserve uncertainty and AI
bubble concerns.
According
to my technical analysis, the price of Ethereum (ETH) has experienced two days
of dynamic declines in a row, losing approximately 16% within 48 hours. For the
chart situation, this is a very large change, and from my technical analysis,
these declines from the first part of the week fully hand power to the bears,
changing the trend currently to downward.
Most
significantly, we went below the 200-day exponential moving average (200 EMA),
simultaneously breaking out of the consolidation range drawn since July, and
also went below the zone of August lows, leaving behind a series of very
important supports which are now resistance.
Why Ethereum price is going down today? Source: Tradingview.com
ETH prices
stopped at this moment at the last line of bullish defense, the 50% Fibonacci
retracement drawn from April lows to the highs. This level falls around $3,175.
If it is broken, Ethereum will continue its decline toward the 61.8% Fibonacci
retracement and the range of local May and June highs between $2,760 and $2,650.
At this
moment, bears have the advantage in the market, so further depreciation cannot
be ruled out either, and the target level or range, according to my forecasts,
is the April minimums at the $2,380 level. This means ETH could fall from
current levels by as much as 60%.
The price
of Bitcoin (BTC), like other major cryptocurrencies discussed by me in this
analysis, has two days of dynamic declines behind it, during which it lost a
total of 8% in value, and prices stopped only at the height of the
psychological $100,000 level last tested in June. Today Bitcoin is trying to
violate this level for the second day in a row.
Bulls are
trying to defend for now. If it is broken, however, it opens the road to a much
stronger downward correction. We will officially exit the consolidation range
drawn from May, and moving below the 200-day exponential moving average (200
EMA) only confirms that now bears are in the lead.
I identify
the first zone of declines around the levels of $92,000 and $94,000, where
Fibonacci extension and retracement levels coincide, with the target zone of
declines around $74,000 and $76,000, the April lows where the 161.8% Fibonacci
extension also falls.
Why Bitcoin price is going down today? Source: Tradingview.com
You can
read more about the potential range of Bitcoin declines in my separate BTC/USDT
chart analysis which I wrote this week.
Joel
Kruger, strategist at LMAX, also provided important context: “A sustained
move under the 50-week could extend the pullback toward the top of the cloud
near $95,000, where we would expect strong support and the formation of a
higher low before the next leg higher to fresh record highs. The key takeaway:
this remains a healthy correction within an ongoing bull market, not a bearish
shift.”
The XRP is
managing best for now compared to other leading cryptocurrencies, maintaining
local support levels and trading still in the $2.20-$2.30 zone coinciding with
July lows.
This
doesn’t change the fact, however, that prices broke out at the beginning of
October from a wedge or triangle formation and are currently consolidating at
lower levels below the 50 and 200 EMA which are very close to drawing a death
cross, a crossover which, according to technical analysis enthusiasts like me,
is a strong sell signal.
If the
current support doesn’t hold, we face a decline below the round $2.00 level,
including toward $1.90, June lows. The next target decline level is $1.61 at
April minimums, and the ultimate level is $1.25, the level last observed in
November 2024 coinciding with intraday lows from October 10 when the market
briefly collapsed, as well as my XRP price decline forecast based on Fibonacci
extensions.
Why XRP price is going down today? Source: Tradingview.com
You can
read more on this topic in this article I wrote earlier.
Although
Dogecoin (DOGE) chart clearly shows it has lost and cut itself off from its
September highs by several cents, in broader terms we actually remain in the
same consolidation drawn since February. Its lower limit, which we are
currently witnessing, falls just above the 14-cent level, while the top is at
just under 29 cents.
The last
hours of declines caused some local supports to turn into resistance, and at
this moment, only the lower limit of the sideways channel last tested in June
stands before us. What’s more significant, however, is we’re moving below the
50 and 200 MA which have already formed a death cross formation, the very
strong sell signal mentioned earlier by me.
If the
current support doesn’t hold and we exit this consolidation, Dogecoin could
pave the road to stronger declines and a retest of levels last observed in
August 2024 below the 8-cent level.
Why Dogecoin price is going down today? Source: Tradingview.com
Cryptocurrency
market lost over $1 trillion since October 6 peak with Bitcoin breaking
$100,000 for first time since June (-5% daily to $100,893), Ethereum crashing
-16% over 48 hours to $3,303, triggered by Federal Reserve Powell walking back
December cuts (probability 96% to 69.3%), AI bubble concerns spreading from
tech selloff (Nasdaq -2%, Nvidia -4%), institutional exodus (Bitcoin ETF
outflows $1.15B) and. leverage cascade ($1.78B liquidations affecting 441,867
traders).
Yes, it may.
According to my technical analysis, Bitcoin breaking $100,000 opens path to
first target $92,000-$94,000 (Fibonacci extension/retracement zone coinciding
with April-May lows), ultimate target $74,000-$76,000 (April minimums + 161.8%
Fibonacci extension).
According
to my analysis, Ethereum down -16% over 48 hours breaking below 200-day EMA and
consolidation range from July, bears now in control with potential 60% decline
to $2,380 April lows if 50% Fibonacci support $3,175 breaks, XRP death cross
forming between 50/200 MA at $2.30 support, Dogecoin death cross completed
testing channel bottom 14 cents, altcoins exhibiting 1.5-2x Bitcoin beta
amplification typical during market weakness.
In my
opnion, yes. Bears warning Peter Schiff “losses staggering surpassing
dot-com bubble,” CredibleCrypto “most severe bear market in Bitcoin’s
history,” $1 trillion market cap loss, institutional exodus $1.15B ETF
outflows, 2018 parallel (October weak, November brutal preceded -37% crash).
Before you go, please also check my previous (and more bullish) crypto price predictions:
The
cryptocurrency market crashed for a second consecutive day today (Wednesday), 5
November 2025, losing over $1 trillion in market capitalization since early
October as Bitcoin, Ethereum, XRP and Dogecoin prices led a broad-based
selloff.
The entire
crypto ecosystem is experiencing dynamic declines with Ethereum at $3,303 (after
-16% two-day crash), Bitcoin testing $100,000 psychological support, and major
altcoins extending losses as institutional investors rotate out of digital
assets.
In this
article, I examine why crypto is going down and conduct a technical analysis of
the BTC/USDT, XRP/USDT, ETH/USDT and DOGE/USDT charts, based on more than 10
years of experience as a cryptocurrency investor and analyst.
Federal
Reserve Chairman Jerome Powell’s hawkish remarks downplaying December rate cuts
created the initial catalyst for crypto’s collapse. The probability of a
December cut collapsed from 96% before Powell’s press conference to just 69.3%
afterward, dampening expectations for looser financial conditions that
typically support cryptocurrency prices.
Source: Coin360
Paul Howard
from Wincent explained the market dynamics: “Cryptocurrency prices
continued to slide and were pushed lower by a lack of positive macro news.
There appears to be a big skew of selling on a major exchange which would back
up the on-chain analysis indicating this is old BTC whale selling pressure.
Dumping billions gradually into the ecosystem over the course of the last few
days is not panic selling.”
The
cryptocurrency collapse coincides with a broader tech selloff. Palantir dropped
8% despite beating earnings on valuation concerns, while Nvidia shed 4% losing
$200 billion in market capitalization. The Nasdaq fell 2% and the S&P 500
declined 1.2%, reflecting growing worries about AI-driven stock valuations.
Institutional
investors pulled $1.15 billion from Bitcoin ETFs last week, led by BlackRock,
ARK Invest, and Fidelity. This exodus signals a significant shift in sentiment
as traditional financial institutions that drove Bitcoin’s rally to $126,000 in
early October are now reducing exposure amid Federal Reserve uncertainty and AI
bubble concerns.
According
to my technical analysis, the price of Ethereum (ETH) has experienced two days
of dynamic declines in a row, losing approximately 16% within 48 hours. For the
chart situation, this is a very large change, and from my technical analysis,
these declines from the first part of the week fully hand power to the bears,
changing the trend currently to downward.
Most
significantly, we went below the 200-day exponential moving average (200 EMA),
simultaneously breaking out of the consolidation range drawn since July, and
also went below the zone of August lows, leaving behind a series of very
important supports which are now resistance.
Why Ethereum price is going down today? Source: Tradingview.com
ETH prices
stopped at this moment at the last line of bullish defense, the 50% Fibonacci
retracement drawn from April lows to the highs. This level falls around $3,175.
If it is broken, Ethereum will continue its decline toward the 61.8% Fibonacci
retracement and the range of local May and June highs between $2,760 and $2,650.
At this
moment, bears have the advantage in the market, so further depreciation cannot
be ruled out either, and the target level or range, according to my forecasts,
is the April minimums at the $2,380 level. This means ETH could fall from
current levels by as much as 60%.
The price
of Bitcoin (BTC), like other major cryptocurrencies discussed by me in this
analysis, has two days of dynamic declines behind it, during which it lost a
total of 8% in value, and prices stopped only at the height of the
psychological $100,000 level last tested in June. Today Bitcoin is trying to
violate this level for the second day in a row.
Bulls are
trying to defend for now. If it is broken, however, it opens the road to a much
stronger downward correction. We will officially exit the consolidation range
drawn from May, and moving below the 200-day exponential moving average (200
EMA) only confirms that now bears are in the lead.
I identify
the first zone of declines around the levels of $92,000 and $94,000, where
Fibonacci extension and retracement levels coincide, with the target zone of
declines around $74,000 and $76,000, the April lows where the 161.8% Fibonacci
extension also falls.
Why Bitcoin price is going down today? Source: Tradingview.com
You can
read more about the potential range of Bitcoin declines in my separate BTC/USDT
chart analysis which I wrote this week.
Joel
Kruger, strategist at LMAX, also provided important context: “A sustained
move under the 50-week could extend the pullback toward the top of the cloud
near $95,000, where we would expect strong support and the formation of a
higher low before the next leg higher to fresh record highs. The key takeaway:
this remains a healthy correction within an ongoing bull market, not a bearish
shift.”
The XRP is
managing best for now compared to other leading cryptocurrencies, maintaining
local support levels and trading still in the $2.20-$2.30 zone coinciding with
July lows.
This
doesn’t change the fact, however, that prices broke out at the beginning of
October from a wedge or triangle formation and are currently consolidating at
lower levels below the 50 and 200 EMA which are very close to drawing a death
cross, a crossover which, according to technical analysis enthusiasts like me,
is a strong sell signal.
If the
current support doesn’t hold, we face a decline below the round $2.00 level,
including toward $1.90, June lows. The next target decline level is $1.61 at
April minimums, and the ultimate level is $1.25, the level last observed in
November 2024 coinciding with intraday lows from October 10 when the market
briefly collapsed, as well as my XRP price decline forecast based on Fibonacci
extensions.
Why XRP price is going down today? Source: Tradingview.com
You can
read more on this topic in this article I wrote earlier.
Although
Dogecoin (DOGE) chart clearly shows it has lost and cut itself off from its
September highs by several cents, in broader terms we actually remain in the
same consolidation drawn since February. Its lower limit, which we are
currently witnessing, falls just above the 14-cent level, while the top is at
just under 29 cents.
The last
hours of declines caused some local supports to turn into resistance, and at
this moment, only the lower limit of the sideways channel last tested in June
stands before us. What’s more significant, however, is we’re moving below the
50 and 200 MA which have already formed a death cross formation, the very
strong sell signal mentioned earlier by me.
If the
current support doesn’t hold and we exit this consolidation, Dogecoin could
pave the road to stronger declines and a retest of levels last observed in
August 2024 below the 8-cent level.
Why Dogecoin price is going down today? Source: Tradingview.com
Cryptocurrency
market lost over $1 trillion since October 6 peak with Bitcoin breaking
$100,000 for first time since June (-5% daily to $100,893), Ethereum crashing
-16% over 48 hours to $3,303, triggered by Federal Reserve Powell walking back
December cuts (probability 96% to 69.3%), AI bubble concerns spreading from
tech selloff (Nasdaq -2%, Nvidia -4%), institutional exodus (Bitcoin ETF
outflows $1.15B) and. leverage cascade ($1.78B liquidations affecting 441,867
traders).
Yes, it may.
According to my technical analysis, Bitcoin breaking $100,000 opens path to
first target $92,000-$94,000 (Fibonacci extension/retracement zone coinciding
with April-May lows), ultimate target $74,000-$76,000 (April minimums + 161.8%
Fibonacci extension).
According
to my analysis, Ethereum down -16% over 48 hours breaking below 200-day EMA and
consolidation range from July, bears now in control with potential 60% decline
to $2,380 April lows if 50% Fibonacci support $3,175 breaks, XRP death cross
forming between 50/200 MA at $2.30 support, Dogecoin death cross completed
testing channel bottom 14 cents, altcoins exhibiting 1.5-2x Bitcoin beta
amplification typical during market weakness.
In my
opnion, yes. Bears warning Peter Schiff “losses staggering surpassing
dot-com bubble,” CredibleCrypto “most severe bear market in Bitcoin’s
history,” $1 trillion market cap loss, institutional exodus $1.15B ETF
outflows, 2018 parallel (October weak, November brutal preceded -37% crash).
Before you go, please also check my previous (and more bullish) crypto price predictions:
XRP is facing short-term pressure after a death cross formed at $2.70, signaling potential downside for traders. While technical indicators point to volatility, support around $2.00 could help stabilize the cryptocurrency, keeping investors cautiously optimistic.
Adding a bullish twist, Grayscale’s recent XRP spot ETF filing has sparked excitement in the market, highlighting the potential for increased institutional adoption. This development positions XRP for a possible rebound, balancing short-term risks with long-term growth opportunities.
On the technical front, XRP has recently formed a death cross on its 10-day and 20-day Exponential Moving Averages (EMAs) at the $2.70 level. Technical analyst @ChartNerdTA explains that “death crosses are lagging indicators and typically mark the worst of the pain on formation,” often signaling that short-term downward momentum has peaked.
XRP hits a $2.70 death cross on its 10/20 EMAs, signaling short-term pain with support near $2. Source: @ChartNerdTA via X
The same analysis notes potential support zones in the $2.00 vicinity, with further downside possible if selling pressure persists. Despite this, the macrostructure of XRP remains intact, indicating that the broader trend is not yet compromised. Analysts highlight that past corrections following death crosses have sometimes paved the way for renewed upward momentum.
Despite bearish short-term indicators, a hidden bullish divergence has emerged on XRP’s monthly chart. Analyst @jaydee_757 points out that “XRP’s monthly lows are rising while RSI forms lower lows, signaling a potential continuation of the bullish trend if $2.09 support holds.”

XRP’s hidden bullish divergence remains intact if $2.09 holds, setting the stage for a potential rise while “dumb money” acts as exit liquidity. Source: @jaydee_757 via X
This divergence suggests that, even amid recent price drops, underlying momentum could support a recovery. JD emphasizes trading discipline, cautioning against hype surrounding events like Ripple’s Swell 2025 or the CLARITY Act (H.R.3633), stating that such distractions often cause retail investors to act as “exit liquidity” during price surges.
Adding a bullish catalyst to XRP’s outlook, Grayscale Investments recently submitted Amendment No. 2 to Form S-1 for the Grayscale XRP Trust. This filing moves the trust closer to launching a spot XRP ETF, which could open the cryptocurrency to regulated institutional investment in the U.S.
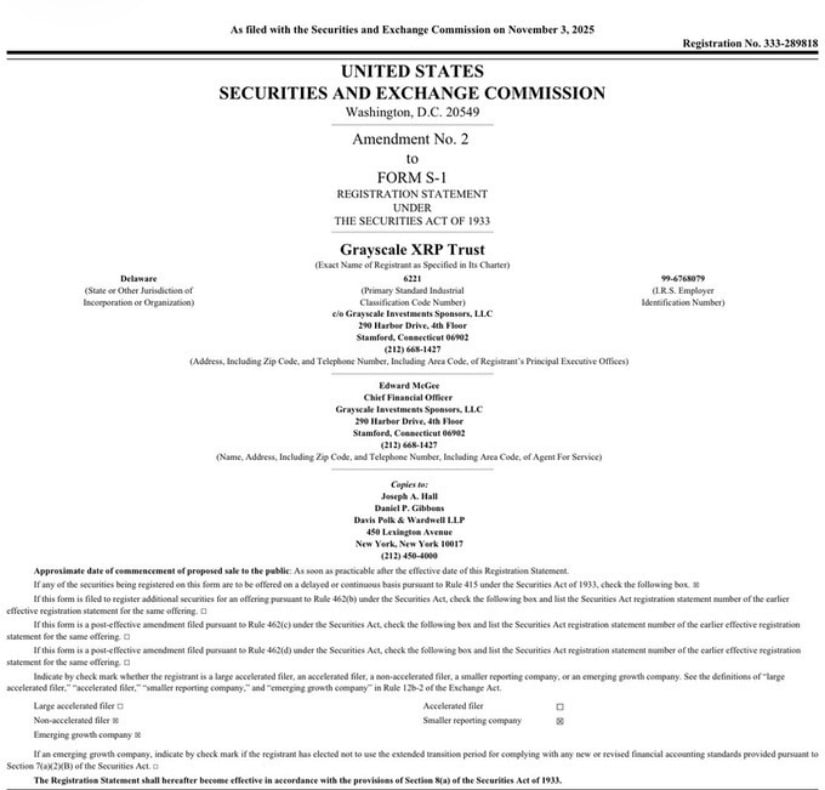
Grayscale files a new amendment for its XRP ETF, fueling optimism for institutional adoption. Source: @Steph_iscrypto via X
Crypto commentator @Steph_iscrypto reports, “BREAKING: Grayscale just submitted a fresh amendment for its $XRP ETF,” sparking optimism across the community. Several X users highlighted the potential impact on XRP’s price, noting that ETF approval could drive inflows and possibly push XRP toward new all-time highs.
Industry observers note that the filing follows a growing trend of institutional adoption for digital assets, with regulated ETFs providing safer avenues for large-scale investors. The SEC’s EDGAR database confirms the amendment, signaling a formal step toward mainstream access.
XRP is navigating a challenging period, with the recent death cross at $2.70 signaling short-term pressure. However, technical insights like the hidden bullish divergence on the monthly chart, combined with institutional developments such as the Grayscale XRP spot ETF filing, suggest that upside potential remains.
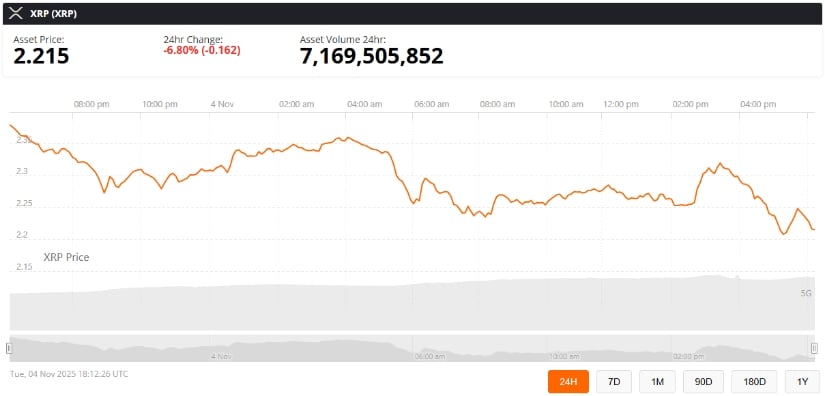
XRP was trading at around $2.21, down 6.80% in the last 24 hours at press time. Source: XRP price via Brave New Coin
Investors should stay cautious but remain attentive to these positive catalysts. Balancing short-term technical risks with long-term growth opportunities may provide the best strategy for navigating XRP’s evolving market landscape.
Cardano price has dropped to its lowest level in nearly a year, testing key support around $0.50 as participants anticipate whether a rebound or deeper correction will follow.
Cardano’s recent slump has rattled participants as ADA revisits price zones unseen in nearly a year. Despite the sharp sell-off, many see this as more than just capitulation; it’s a potential reset point where long-term holders quietly reaccumulate.
Cardano’s price has dropped to $0.56, marking its lowest level in nearly a year according to Brave New Coin data. The 24-hour decline of over 6% reflects intensified selling pressure following a sustained series of lower highs since early October. Current market cap stands near $20.4 billion, with daily volume exceeding $1.7 billion, suggesting a mix of panic selling and short-term repositioning.
Cardano price is trading around $0.56, down -6.61% in the last 24 hours. Source: Brave New Coin
Technically, ADA Cardano price has now breached its 200-day moving average, exposing downside risk toward $0.50 to $0.52. A clean reclaim above $0.60 could be the first sign of short-term recovery, but without a surge in volume, the trend remains fragile. The macro structure continues to compress into a long-term range, where deeper wicks may still appear before stronger accumulation begins.
CryptoPulse highlights that ADA has entered a critical demand zone between $0.50 to $0.55, an area that historically triggered multiple reversals. The descending trendline continues to cap upside momentum, yet the price has repeatedly bounced within this green support block.

Cardano price continues to defend its key demand zone near $0.50, signaling renewed buying interest after multiple successful retests. Source: CryptoPulse via X
From a structural standpoint, ADA’s ability to stay above $0.50 keeps the potential alive for a rebound towards $0.70 to $0.80, aligning with the mid-range resistance zone. A decisive breakout above $0.66 would shift the short-term bias bullish, especially if volume follows through.
Crypto analyst RISK’s outlook shows Cardano price consolidating around $0.5348 after a sharp decline, forming what appears to be a potential accumulation structure. The chart outlines two possible paths: a brief liquidity dip into $0.48 to $0.50 before reclaiming higher ground, or a steady rise if buyers defend current levels.
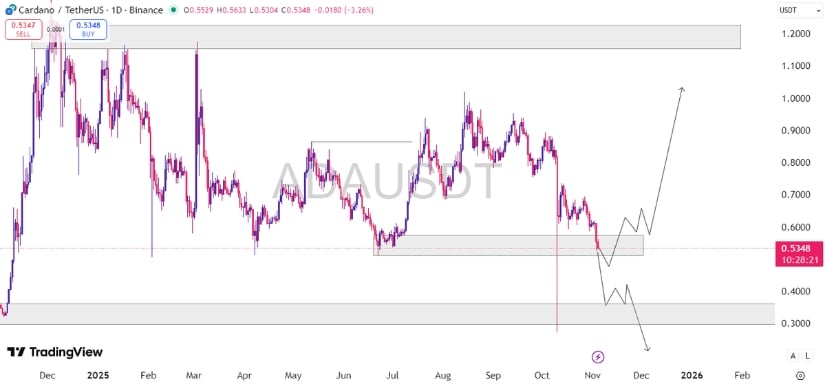
ADA appears to be forming a solid base near $0.53, hinting at early accumulation that could precede a broader bullish reversal. Source: RISK via X
Momentum indicators are stabilizing, with volume hinting at early accumulation phases. Should support hold, the next major upside objective lies at $0.85 to $1.00. The base formation at this range mirrors earlier cycles where prolonged consolidation preceded impulsive breakouts, suggesting that Cardano may be setting the stage for a larger trend reversal heading into 2026.
Price revisits an intriguing fractal comparison that mirrors Cardano’s previous exponential rally. Before its last major move, Cardano price tested the golden pocket five times without closing below it. This time, it has tapped the same retracement level six times, still holding firm.
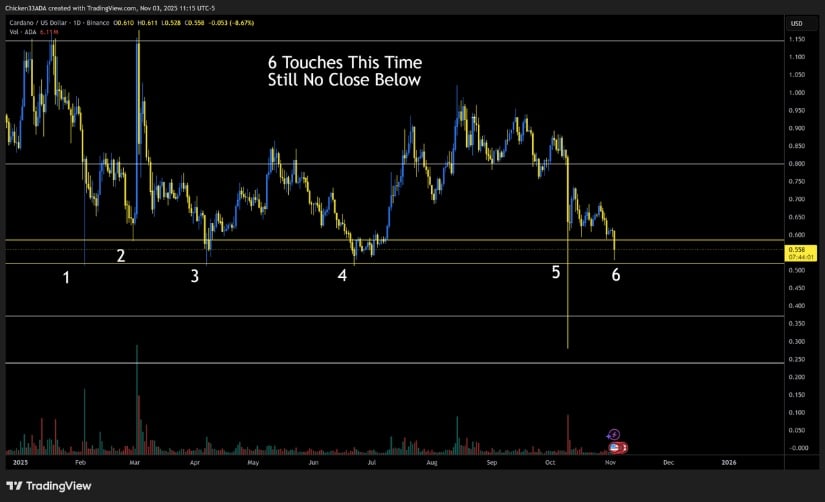
Cardano’s repeated defense of the golden pocket mirrors its pre-rally behavior from past cycles, suggesting a potential setup for another major impulse wave. Source: Navir333 via X
This repeated defense of the golden pocket indicates strong underlying demand despite ongoing market fatigue. If the pattern holds, Cardano price could once again trigger a wave-three-style impulse from this region.
Cardano’s current phase represents a critical inflection point, structurally weak yet technically resilient. The multi-test golden pocket, solid ETF-style inflows, and consistent support near $0.50 all highlight that while sentiment has cooled, accumulation may be quietly taking place.
For a confirmed bullish close to 2025, ADA must reclaim the $0.70 to $0.80 range and secure weekly closes above $0.85 to reestablish momentum. Failure to hold $0.50 would, however, open room toward deeper corrective targets near $0.40. In essence, Cardano price prediction stands at the crossroads of capitulation and recovery, where patient holders may once again find opportunity.
XRP bulls are standing firm at a critical juncture as the XRP price today struggles to hold the $2.20–$2.25 support zone amid renewed selling pressure.
The broader crypto market has turned defensive following recent pullbacks in Bitcoin and Ethereum, raising concerns that Ripple (XRP) could retest the psychological $2 mark if sentiment fails to stabilize.
As of November 5, 2025, the current XRP price hovers around $2.26, down more than 6% over the past 24 hours. This decline followed a sharp rejection from the $2.55–$2.70 range, where sellers regained control. On the weekly chart, XRP’s 10/20 exponential moving average (EMA) has formed a death cross near $2.70—a lagging bearish signal that often points to trend exhaustion but not always sustained downtrends.
XRP faces near-term downside risks from a looming death cross and tightening triangle, though BlackRock’s tokenization developments could spark a rebound above $2.55. Source: Faizan Haroon via X
Historically, death crosses in volatile assets like XRP have only predicted extended declines about 55–60% of the time, suggesting a potential for near-term exhaustion rather than a prolonged correction. Technical indicators now show price compression under a descending resistance line that has capped every rally since mid-August.
The daily chart highlights major resistance at $2.49 (20-day EMA) and $2.62 (50-day EMA), with the 100-day EMA at $2.69 reinforcing the upper bearish boundary. Unless XRP breaks above $2.60 and the $2.70 trendline, bullish sentiment may remain suppressed.
On-chain and derivatives data reflect a cautious tone among traders. According to Coinglass, futures open interest dropped by over 16% to $3.5 billion as traders reduced leverage exposure. Meanwhile, XRP trading volume surged 63%—mostly from short-term rotations rather than new bullish inflows—while options activity fell sharply by 43%, suggesting a decline in speculative participation.

Exchange XRP Futures Open Interest (USD) chart. Source: CoinGlass
The aggregate long/short ratio across major exchanges like Binance and OKX remains below parity, signaling bearish bias. Funding rates have stabilized, but the absence of aggressive short covering indicates limited appetite for a reversal.
Despite this, a modest net inflow of $13 million was recorded on November 4, hinting at mild accumulation attempts by retail traders. However, broader weekly flows remain negative, reflecting persistent outflows since mid-October.
Adding to the bearish tone, on-chain data revealed whale transactions involving over 900,000 XRP sold in recent sessions. Additionally, Ripple’s scheduled token unlock has introduced fresh supply into circulation, amplifying short-term selling pressure.

Whales have offloaded 900,000 XRP within the past five days, adding pressure to the token’s short-term market outlook. Source: Ali Martinez via X
Still, analysts note that XRP’s macro uptrend from early 2025 remains technically intact as long as the token holds above the $2 level. Previous bull-market death crosses have often coincided with local bottom formations, hinting that XRP could soon approach an exhaustion point before recovery.
A crypto market researcher commented that “if XRP defends the $2.20 support and reclaims $2.60 in the coming sessions, the structure could shift back toward neutral-to-bullish territory, targeting $2.85–$3.00 initially.”
XRP’s recent performance mirrors the broader crypto market slowdown, with Bitcoin trading near $104,000 and Ethereum hovering around $3,600. Despite the short-term correlation, some analysts point out that XRP’s weakening dependence on BTC price trends—fueled by Ripple’s growing real-world adoption—could signal early decoupling from traditional crypto cycles.

XRP was trading at around $2.26, down 6.28% in the last 24 hours at press time. Source: XRP price via Brave New Coin
Meanwhile, macro narratives like BlackRock’s continued interest in tokenization have introduced a speculative backdrop for XRP and similar utility-driven tokens. A breakout above $2.55–$2.65 could trigger a short-term relief rally, potentially extending to the $3 zone if market sentiment improves.
For now, the XRP price forecast hinges on the $2.20–$2.25 support band. A decisive breakdown below this area could open the path toward the $2 psychological level and possibly $1.85. Conversely, a rebound from this region could attract short-covering momentum and restore price stability above $2.45–$2.60.
Although the XRP price today reflects bearish undertones, the long-term XRP price prediction 2025 remains constructive, supported by Ripple’s ongoing partnerships, institutional interest, and potential regulatory clarity from the XRP SEC lawsuit resolution.
In the short term, traders remain cautious, watching whether bulls can defend the final support and prevent another leg down. If they succeed, XRP could soon stage a recovery phase that reaffirms its place among the top-performing altcoins as the market regains composure.
Solana price holds firm above a key support level near $155, with participants watching closely to see if the market can reclaim momentum or slip into deeper correction.
Despite growing market pressure, Solana price has managed to hold its crucial support zone, keeping participants on edge as the next move could define the short-term trend. SOL’s recent retest near $155.83 showed strong defensive buying, even as technical indicators flashed mixed signals.
Solana’s price structure sits at a decisive make-or-break level as highlighted by the daily chart. The $155.83 support, nearly tagged to the cent in the latest retest, marks the final line of defense for bulls. The 50-day moving average is rolling over, while the 200-day MA has already been breached, showing momentum fatigue.
Solana holds its final support near $155.83, a level that could determine whether the trend recovers or slides into deeper correction. Source: The Wolf of Wall Street via X
A sustained close below this zone could confirm trend deterioration towards the $140 to $145 range, while holding above may invite a rebound back to the mid-$170s. The next sessions will be critical in determining whether Solana price maintains its structural integrity or slips into deeper corrective territory.
Lennart Snyder’s weekly outlook identifies $122 as the broader range low that could act as the next significant accumulation point for long-term buyers. Current price movement continues to drift lower within the midrange, suggesting the market is pricing in a potential corrective phase before another rally attempt.

Solana’s weekly structure signals a controlled correction, with $122 emerging as the next major accumulation zone for patient buyers. Source: Lennart Snyder via X
For long-term investors, this setup presents a prime zone, where participants may find a favorable risk-reward ratio near $120 to $125. A weekly reclaim above $200 remains the invalidation level for the broader downtrend, as it would mark a structure-breaking higher high. Until then, Solana remains in a controlled correction mode within its long-term channel.
The chart points to a clear directional shift in Solana’s On-Balance Volume (OBV), which has now broken its prior uptrend and is sliding lower alongside price. This decline reflects weakening accumulation and growing sell-side dominance, confirming that buying activity has yet to return in strength.
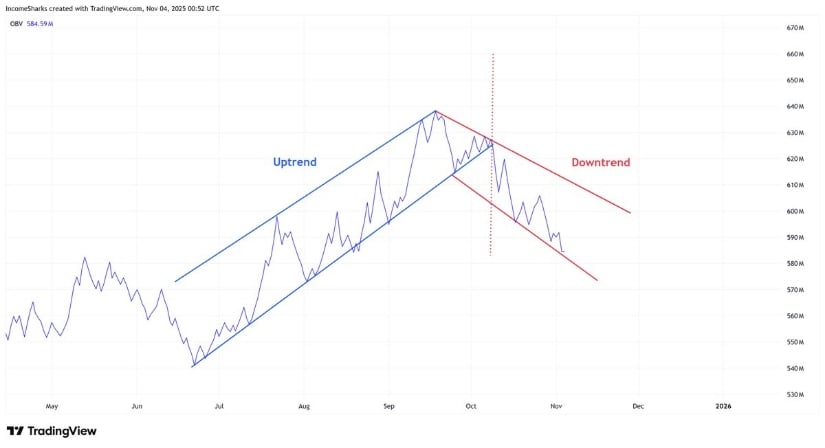
Solana’s OBV trend breaks lower, signaling fading accumulation and strengthening sell-side pressure in the short term. Source: IncomeSharks via X
The OBV’s failure to stabilize alongside price supports the view that momentum remains bearish until sellers show exhaustion. Only a flattening OBV with rising volume on green candles would suggest that buyers are preparing to step back in, but for now, Solana price appears to be in the distribution leg of its cycle.
Technical outlook shared by robw00ds paints a bearish continuation setup on the weekly chart, indicating Solana could decline by up to 60% from current levels if the trend fails to stabilize. The chart shows price struggling to maintain higher lows, with a projected downside target towards $80–$85, corresponding to the previous accumulation range from mid-2023.
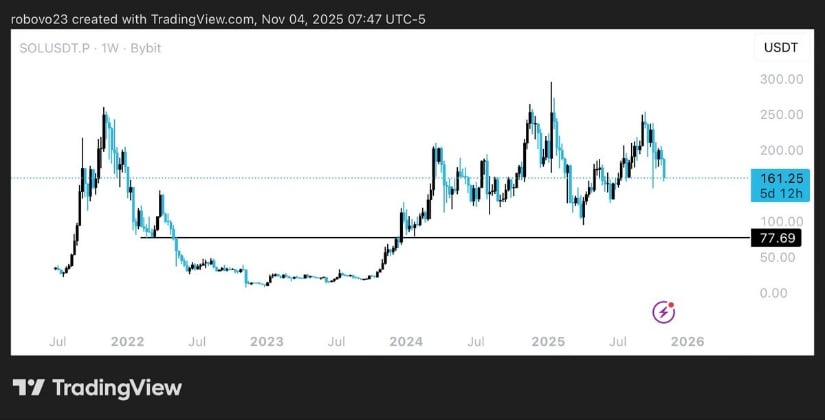
Solana’s weekly chart hints at a possible 60% correction towards $80–$85 if key supports fail to hold, keeping traders cautious of deeper downside risks. Source: robw00ds via X
This potential retracement would still fit within Solana’s macro cycle, where deep pullbacks have historically preceded large rallies. However, maintaining structure above $150 is essential to prevent broader downside. If buyers fail to defend this threshold, a full correction towards sub-$100 levels becomes increasingly likely for Solana price.
Despite the recent decline in Solana’s price, Solana ETFs recorded $70 million in fresh inflows in a single day, signaling sustained institutional interest. According to SolanaFloor, Bitwise’s BSOL accounted for $66.5 million, even as both Bitcoin and Ethereum ETFs experienced outflows during the same period.

Solana ETFs attract $70 million in a single day, highlighting strong institutional confidence even as broader crypto markets face outflows. Source: SolanaFloor via X
This divergence reinforces Solana’s position as a favored altcoin among institutional allocators, reflecting confidence in its long-term potential despite short-term turbulence. ETF inflows of this scale often precede recovery phases as liquidity returns to the ecosystem, offering a glimmer of optimism for the weeks ahead.
Solana’s technicals currently show a fragile structure but solid fundamental support. The charts warn of downside continuation if $155 fails, yet the ETF inflow data highlights institutional conviction that remains intact.
If Solana price holds the $150 to $155 zone and OBV begins flattening, a gradual recovery towards $175 to $190 could take shape in the short term. Conversely, a breakdown below this threshold would likely accelerate losses towards $120 or lower before the next accumulation phase. Overall, the network’s liquidity strength and ecosystem demand suggest that even amid short-term pressure, the long-term outlook for Solana price prediction remains resilient.
Bitcoin Price News: After $1B BTC Whale Sale, Will Bitcoin Stabilize and Ethereum’s Ecosystem Priorities Boost Confidence?
Bitcoin enters November after posting its first negative October in six years.
The drop has sparked debate among traders about whether the pullback signals a deeper decline or a normal pause before the next move.
According to CoinGecko, the Bitcoin price is down about -4.4% in the past day and trades near $107,000.
That slide has helped pull the broader crypto market lower, with total value down 2.2% to $3.64 trillion.
The retreat triggered more than $1.16Bn in long liquidations on November 3, showing how quickly leverage has unwound across major venues.
(Source: Coinglass)
The weakness came as global markets adjusted to shifting policy signals. Federal Reserve Chair Jerome Powell confirmed the end of quantitative tightening and said rate cuts were coming.
EXPLORE: Best Meme Coin ICOs to Invest in 2025
But later comments cooled hopes for a cut in December, adding uncertainty and weighing on risk assets.
A long-silent Bitcoin wallet has also moved after nearly 14 years. The address transferred 10,000 BTC, first purchased for around $1.54 each, a crypto investor named Ted said.
The holder is believed to have sold the full amount today for roughly $1Bn, marking one of the largest profit-taking events linked to an early Bitcoin address.
On the charts, Bitcoin is now retesting a key support zone after pulling back toward a long-term blue moving-average line on the weekly timeframe.
The analyst noted that every major upswing since March 2023 has originated from this area, with past touches resulting in strong rebounds.
Bitcoin is trading close to $103,000, sitting just above its key moving average band at the same level.
A weekly close below this zone could signal that the rally is losing strength and open the door to a deeper pullback, possibly toward the $40,000 area.
If the trendline holds, the broader uptrend remains in place. In that case, analysts see room for a move toward $150,000 if buyers regain control.
DISCOVER: Next 1000X Crypto: 10+ Crypto Tokens That Can Hit 1000x in 2025
Traders are watching how the market closes this week to get a clearer signal.
Meanwhile, the Ethereum Foundation has introduced a revised grant program designed to take a more proactive approach to ecosystem support.
The group paused new applications in August under its previous ESP framework, saying it needed time to reassess funding priorities.
Risk appetite is seeping back into crypto, and the Dogecoin (https://www.forbes.com/sites/digital-assets/article/what-is-dogecoin/) Price Prediction debate is getting louder for practical reasons, not just memes. Buyers are stepping in earlier on pullbacks, and depth looks less like a puddle and more like a shallow pool that keeps filling during active hours.
Options skew has nudged toward calls on strong sessions, while perp basis flips positive, then cools without collapsing – a healthier rhythm than the manic spikes we saw months ago. In the same breath, Bitcoin Hyper (HYPER) (https://bitcoinhyper.com/) keeps showing up in risk-on conversations as a sidecar trade when capital rotates into high-beta names.
None of this guarantees a moon shot, yet when multiple small tells line up, traders stop doom-scrolling and start planning entries with actual rules.
Three Signals Traders Are Actually Tracking Today
Think less prophecy, more receipts. First, time at highs – if DOGE can sit just under resistance without coughing up gains, that usually hints at patient bids rather than a one-print squeeze.
Second, volume profile – watch whether participation thickens near last week’s ceiling instead of drying up the moment price pokes it. Third, weekend vs weekday depth – sturdy books outside peak hours beat any single candle.
Mix in funding that normalizes after pushes, a gentle rise in open interest without the “everyone long now” alarm, and on-chain activity (https://coinmarketcap.com/academy/article/what-is-on-chain-analysis-how-to-analyze-on-chain-crypto-data) that stays steady while spot ticks up, and you get a Dogecoin Price Prediction path that leans constructive. It is not bulletproof. It is simply behavior you can verify without squinting.
Two Paths From Here – Breakaway or Box
From here, DOGE faces two clean scenarios. Breakaway: hold the mid-range, reclaim the prior day’s value area, and build volume above the most recent distribution.
If spreads remain sane when price retests the local highs, trend models can press into the next liquidity pocket. Box: fail to hold the middle, drift back into the chop band, and favor mean-reversion tactics until majors reset the tempo.
You do not need magic indicators – just track whether buyers add size after the first push or vanish at the first sign of heat. If you see thin prints near intraday peaks and no follow-through on the next session open, treat strength like a rental, not a forever home. Patience beats chasing candles into air.
Where Bitcoin Hyper (HYPER) Fits Beside DOGE
Dogecoin runs on crowd energy and timing, which is fine in a market that rewards attention. Bitcoin Hyper (HYPER) (https://bitcoinhyper.com/) tries to anchor that energy to routine – small actions, predictable costs, and frequent but modest ships that keep people returning without bribes.
Some holders report that this cadence feels practical, and early experiments around simple payments seem aimed at making crypto feel less like homework. If that loop holds, HYPER becomes a useful way to express risk when meme flows heat up, without depending on a single viral moment.
Emissions discipline, transparent trade-offs, and a roadmap that favors near-term delivery over slogans would turn curiosity into traction. None of this competes with DOGE directly – it complements it when rotation favors higher beta and utility gets a little respect.
48-Hour Checklist, Then the Dogecoin Price Prediction Frame
Here is the boring checklist that tends to work. Watch whether DOGE spends more minutes building value above last week’s node than below it, whether call skew strengthens without torching funding, and whether Asia-US handoff keeps depth intact instead of creating a vacuum.
Track if spot leads perps on pushes, not the other way around, and whether realized volatility (https://coinmarketcap.com/academy/glossary/volatility) expands with participation rather than with liquidation spikes.
If these boxes tick, the Dogecoin Price Prediction lens tilts toward breakout continuation with stair-step targets instead of straight lines.
If they do not, keep trading the box – scale into pullbacks, harvest into prior highs, and let majors set the next cue. Either path rewards discipline over drama, which is usually how real gains survive the headlines.
Buchenweg, Karlsruhe, Germany
For more information about Bitcoin Hyper (HYPER) visit the links below:
Website: https://bitcoinhyper.com/
Whitepaper: https://bitcoinhyper.com/assets/documents/whitepaper.pdf
Telegram: https://t.me/btchyperz
Twitter/X: https://x.com/BTC_Hyper2
Disclosure: Crypto is a high-risk asset class. This article is provided for informational purposes and does not constitute investment advice.
CryptoTimes24 is a digital media and analytics platform dedicated to providing timely, accurate, and insightful information about the cryptocurrency and blockchain industry. The enterprise focuses on delivering high-quality news coverage, market analysis, project reviews, and educational resources for both investors and enthusiasts. By combining data-driven journalism with expert commentary, CryptoTimes24 aims to become a trusted global source for emerging trends in decentralized finance (DeFi), NFTs, Web3 technologies, and digital asset markets.
This release was published on openPR.
Analysts project ADA between $3–$12 by the end of 2025, but XRP Tundra’s verified dual-chain model offers structured growth beyond market speculation and sentiment swings.
Cardano’s native token ADA is regaining market attention after reclaiming resistance levels last tested in March. Analysts’ projections vary widely, reflecting optimism tempered by the sector’s inherent volatility. Data from CoinCodex forecasts ADA at $0.86 by late November and $1 by year-end, while independent analyst Sssebi expects $3, and Alex Becker and Investing Broz extend that range to $6–$12, depending on broader market strength.
The Fear & Greed Index sits at 34, signaling caution despite recent gains. ADA has traded positively on just 43% of days in the past month, showing that while momentum exists, conviction is still limited. Against this uneven backdrop, projects built on measurable logic rather than sentiment are drawing attention – and XRP Tundra sits squarely in that category.
Cardano’s recent climb above its March resistance point has encouraged traders looking for a technical breakout. Yet even among optimistic forecasts, there’s acknowledgment that ADA’s recovery depends heavily on sustained liquidity and Bitcoin’s broader trajectory. A single macro shift – such as renewed rate uncertainty – could compress altcoin performance despite improving fundamentals.
This hesitation explains why many investors now favor projects that publish fixed terms, verified audits, and structured emission models. XRP Tundra’s presale, operating transparently across both the XRP Ledger and Solana, fits that preference. Its appeal lies in data that participants can verify, not projections they have to interpret.
As ADA’s potential remains speculative, XRP Tundra operates on defined parameters. The project’s Phase 9 presaleprices TUNDRA-S at $0.147 with an 11% token bonus, paired with a free allocation of TUNDRA-X valued at $0.0735. Listing prices – $2.50 and $1.25 – establish a measurable upside based on published math.
Over $2 million has already been raised, driven by consistent wallet participation rather than momentum trading. The system’s transparency, verified by independent audits, offers a contrast to speculative charts dominating much of the current discussion.
A 2Bit Crypto analysis described Tundra’s approach as a “measurable model” in an industry defined by probabilities, noting that predictable design increasingly appeals to investors seeking yield rather than volatility exposure.
XRP Tundra’s technical advantage lies in its dual-chain design. The XRP Ledger (XRPL) anchors governance, reserves, and settlement integrity, while Solana manages execution and liquidity through the TUNDRA-S utility token. This split prevents the concentration of all functions in a single network and reduces congestion risk while maintaining verifiable performance metrics.

The arrangement allows for yield systems such as Cryo Vaults – Tundra’s audited staking environments – and Arctic Spinner, a transparent bonus feature that rewards participation through immediate token incentives. Both mechanisms reflect the same transparency standards shaping the project’s presale documentation.
Solana provides throughput; the XRP Ledger provides assurance. Together, they give XRP Tundra a base that supports growth without relying on speculation.
Every aspect of the Tundra ecosystem is documented and verifiable. Independent audits by Cyberscope, Solidproof, and FreshCoins confirm the integrity of its contract logic and vault mechanics, while full KYC verification by Vital Block authenticates the development team’s identity.
This documentation gives participants something the market often lacks: verifiable evidence. As capital rotates toward compliant and transparent ecosystems, XRP Tundra’s open-audit structure meets the standards institutional investors increasingly require for DeFi exposure.
Cardano’s bullish forecasts reflect optimism about market direction, but XRP Tundra’s design turns that optimism into measurable structure. While ADA’s 2025 targets depend on price momentum, Tundra’s returns are embedded in its published parameters and verified contracts. The distinction is between speculation and system — and markets under pressure are beginning to favor the latter.
Buy Tundra Now: official XRP Tundra website
How To Buy Tundra: step-by-step guide
Security and Trust: KYC Certificate
Join the Community: Telegram
This is a sponsored article. Opinions expressed are solely those of the sponsor and readers should conduct their own due diligence before taking any action based on information presented in this article.
The current XRP price prediction has sparked optimism as traders anticipate fresh institutional inflows from potential spot ETF approvals.
The current XRP price prediction has sparked optimism as traders anticipate fresh institutional inflows from potential spot ETF approvals. Ripple’s growing clarity in regulatory matters and rising payment volumes are restoring confidence across markets. Meanwhile, investors are also keeping an eye on Remittix, a PayFi project that has already raised over $27.9 million through the sale of more than 683 million tokens, currently priced at $0.1166 each, a sign of growing demand for utility-focused crypto solutions.
Source: BNC XRP Market Data
The latest XRP price prediction points to a cautious but bullish setup. XRP’s current price is $2.24 with a marketcap of $134,611,948,909.00. Its price is -7.32% down in last 24 hours, as traders wait for news of a spot ETF filing. Technical indicators show that XRP is above its 100-day moving average, but it continues to struggle to cross above the $2.70 resistance line reached in late October. Breaking out of this point may provide an entry point into the short term to $3.00 to $3.30 in November.

Nonetheless, the latest XRP price prediction models indicate that spot ETF approval might be a game-changer. The legal clarity that has ensued after the courtroom wins of Ripple has preconditioned more institutional-grade involvement, whereas the advance of regulations has enhanced investor confidence. Market watchers are looking to sustained break above $2.70 to initiate fresh buying by institutional funds – to get exposure before a larger-scale advance in altcoins.

While traders continue to analyze every new XRP price prediction, Remittix continues to build real-world momentum. As a cross-border PayFi network, it bridges crypto and fiat transactions across 30+ countries, positioning itself as a next-generation digital payment hub. The project’s focus on transparency and compliance has helped it attract thousands of new investors.
Here’s what makes Remittix stand out in the current crypto news cycle:
Although the XRP price prediction shows room for growth, market observers believe long-term potential lies in utility-based ecosystems like Remittix. As ETFs bring institutional capital into crypto, investors will likely seek projects that solve real-world payment problems. Combining strong fundamentals, exchange readiness, and verified security, Remittix is rapidly emerging as one of the best crypto projects of 2025, potentially leading the next big altcoin 2025 wave.
Discover the future of PayFi with Remittix by checking out their project here:
Website: https://remittix.io/
Socials: https://linktr.ee/remittix
$250K Giveaway: https://gleam.io/competitions/nz84L-250000-remittix-giveaway
This is a sponsored article. Opinions expressed are solely those of the sponsor and readers should conduct their own due diligence before taking any action based on information presented in this article.


