The main category of Crypto News.
You can use the search box below to find what you need.
[wd_asp id=1]
The main category of Crypto News.
You can use the search box below to find what you need.
[wd_asp id=1]
Bitcoin is likely to plunge below $110,000 mark, a significant shift in the cryptocurrency landscape. On October 11, 2025, Bitcoin opened at $113,758.51 and quickly fell, reflecting a -2.13% decrease in its value. The dip highlights the ongoing volatility in the cryptocurrency market, with liquidations across exchanges contributing to this dramatic decline. Investors are concerned about these fluctuations and their broader implications for the market.
Bitcoin’s price recently hit a day low of $110,451.01, falling from a high of $113,758.51. The current price is $111,337.51, marking a substantial decline. This shift aligns with a 15.77% drop over the past three months, despite a 32.33% increase over the last six months. These fluctuations demonstrate Bitcoin’s continued instability despite its high year performance. The cryptocurrency’s market cap stands at approximately $2.3 trillion, but this figure fluctuates in sync with its price changes.
The recent downturn can be traced to several factors. Liquidations across major exchanges have significantly impacted Bitcoin prices, triggering stop-loss orders that further drive down the price. Additionally, global economic conditions and regulatory concerns continue to add uncertainty to the market. The recent RSI value of 49.51 implies a neutral stance, showing that the market is neither overbought nor oversold. This indicates possible further volatility in Bitcoin’s pricing. Read more about the latest trends.
Despite the decline, Bitcoin’s year-on-year change shows a 12.93% increase, pointing to its potential resilience. Analysts forecast a monthly price target of $132,461.27, with projections for a stronger recovery in the months ahead. For long-term investors, the five-year forecast predicts a price of $147,690.77, indicating optimism about Bitcoin’s future prospects. These forecasts highlight potential opportunities for investment amid current market challenges. Additionally, the Awesome Oscillator at 7580.49 shows strong downward momentum, which needs to be monitored closely by investors.
Market sentiment remains cautious as the MACD indicator shows a disparity of 472.43 between its current level and signal line, indicating a bearish trend. The ATR metric at 3615.38 signifies high volatility, underscoring the need for investors to consider risk management strategies. For those invested in Bitcoin, this environment presents a challenging yet promising landscape to navigate. While short-term volatility is likely to persist, long-term trends may offer potential rewards. Investors ought to weigh these aspects when considering their positions in Bitcoin.
Bitcoin may fall below $110,000 amid market turmoil, illustrating the cryptocurrency market’s volatility. However, historical performance and long-term forecasts suggest that Bitcoin could recover. Investors should remain cautious, employing strategic investment approaches to mitigate risks. The current sentiment encourages a balanced view, focusing on both potential opportunities and challenges within the market. For real-time insights, platforms like Meyka can provide valuable analytics to assist in navigating this turbulent environment. As the market evolves, understanding the underlying factors influencing Bitcoin’s price movements will be crucial for making informed decisions.
Bitcoin’s price dropped due to mass liquidations on major exchanges and broader economic concerns, causing a significant reduction in value. These factors combined to push Bitcoin’s trading price below the psychological $110,000 mark.
Key indicators include the ATR of 3615.38 and the RSI of 49.51, showing high volatility and a neutral market stance. These indicators highlight ongoing price fluctuations and potential for volatility-driven trading opportunities.
Market sentiment is currently cautious, with bearish trends observed in MACD and market risk indicated by the ATR. Despite this, there remains optimism in long-term forecasts for Bitcoin’s price recovery, suggesting potential investment opportunities.
Disclaimer:
This is for information only, not financial advice. Always do your research.
It may be time to call the vet. Because Dogecoin is not doing that well, man.
Today’s historic market crash caused nearly all digital assets to lose a substantial amount of value. Bitcoin itself saw a 10% drop throughout this Friday, while altcoins took an even harder hit. While the total market capitalization of crypto lost nearly 10% in value, the capitalization of digital assets excluding BTC bled by over 12% in that same timeframe.
And for DOGE, the memecoin was among the hardest hit. Dogecoin dropped by over 26% in a single day, making it one of the worst-performing large-cap assets in the entire market. Today’s drop drove DOGE to reach one of its lowest values in the year, kickstarting a wave of panic selling and forced liquidations across retail-heavy platforms.
A couple of days ago, we talked about how Dogecoin was reaching a make-or-break zone, as an uptrend approached the $0.25 resistance level, forming what looked like an ascending triangle pattern. Well, so much for that! In this pivotal moment for Dogecoin’s price action, it’s clear that it broke — rather than made.
Dogecoin didn’t just fail a breakout at $0.25, however. During its path downward, bears completely broke through several resistances, causing a full structural collapse in DOGE’s short-term price action.

There is a silver lining, though.
$DOGE dropped as low as $0.15 this Friday, but bulls quickly worked to bring the price back closer to $0.20. What that move also did was give the bulls a better fighting chance, as it brought the currency back above its 3-year uptrend line.

However, price action will ultimately have little weight against the massive financial repercussions of a new trade war between the U.S. and China. In the short term, Dogecoin may find temporary relief above its long-term trendline, but relief doesn’t mean recovery. In all likelihood, crypto’s recovery will depend on how geopolitical developments unfold over the coming weeks.
The cryptocurrency market was rocked today as XRP, Ripple’s native token, plunged from around $3 to $2.38 within minutes, erasing much of its recent gains and shaking investor confidence. The sudden crash — a steep 20% decline from its weekly peak — unfolded rapidly during mid-day trading and underscores the ongoing volatility gripping digital assets.
At the time of writing, XRP is trading near $2.36, down roughly 0.16% over the past 24 hours, with intraday lows touching $1.89 — the steepest hourly slide seen in weeks. The dramatic move left traders scrambling and reignited debate over Ripple’s short-term outlook.

The price collapse was not an isolated event. Bitcoin and Ethereum also fell sharply in the same window, driven by a stronger U.S. dollar, rising Treasury yields, and a shift toward risk-off sentiment across global markets. Analysts point to a confluence of macroeconomic factors and internal crypto dynamics fueling the XRP drop.
On-chain data shows that major holders — commonly known as “whales” — initiated large sell-offs during XRP’s recent rally above $3. This triggered a cascade of automated stop-loss orders and liquidations, accelerating the sell pressure. “XRP’s run to $3 looked strong, but underlying sell pressure was building for days,” one analyst said. “When whale movements coincided with macro headwinds, the result was a sharp and sudden reversal.”
Despite the turbulence, some traders note that accumulation among long-term holders has quietly increased, hinting that confidence in Ripple’s fundamentals may still be intact despite short-term volatility.
The crash follows a string of major announcements from Ripple Labs in recent weeks. The U.S. Securities and Exchange Commission (SEC) concluded its multi-year lawsuit against the company in August, with Ripple agreeing to pay a $125 million settlement — a resolution widely seen as clearing a key legal overhang. More recently, Ripple revealed plans to acquire prime broker Hidden Road for $1.3 billion, a move aimed at expanding its footprint in institutional crypto services.
While these developments strengthen Ripple’s strategic position, the near-term price action highlights how quickly sentiment can shift in the crypto market. XRP’s sharp drop also coincided with broader concerns over global economic policy, including new tariff tensions and monetary tightening, further spooking risk-asset investors.
Market analysts are now watching whether XRP can hold key support around $2.30. If that level breaks, a slide toward $2.00 is possible. Conversely, a decisive push back above $2.70 could reignite bullish momentum and restore confidence among retail investors.
For now, traders are bracing for continued volatility. With whale movements, macroeconomic pressures, and sentiment swings all influencing prices, rapid and unpredictable shifts remain the norm. XRP’s fall from $3 to $2.38 in minutes is a stark reminder of how quickly fortunes can change in the crypto market.
The bottom line: XRP’s fundamentals remain strong following its legal victory and strategic expansion plans, but short-term price action is dominated by macro headwinds and large-scale profit-taking. Extreme volatility remains the defining feature of this market — and traders should prepare for more sharp moves ahead.
XRP crashed due to a combination of whale sell-offs, macroeconomic headwinds, and automated liquidations triggered as support levels broke.
As of the latest update, XRP is trading near $2.36 with intraday lows around $1.89 after falling sharply from $3.
Analysts say recovery depends on holding support near $2.30 and reclaiming $2.70 resistance. Macro conditions and Bitcoin’s direction will also be key.
Ripple recently settled its SEC lawsuit with a $125 million payment and announced a $1.3 billion acquisition of prime broker Hidden Road.
Traders are closely monitoring whale activity, macroeconomic trends, and whether XRP can maintain support above $2.30.
Barron’s. (2025). “Bitcoin, Ethereum, XRP Fall. Why Cryptos Are Struggling Today.” October 11, 2025.
Reuters. (2025). “SEC ends lawsuit against Ripple, company to pay $125 million fine.” August 8, 2025.
Barron’s. (2025). “Crypto Firm Ripple To Buy Broker Hidden Road For $1.3 Billion. What It Means For XRP.” October 2025.
The information provided in this article is for informational and educational purposes only and does not constitute financial advice, investment guidance, or a recommendation to buy or sell any cryptocurrency or digital asset. Cryptocurrency markets are highly volatile and subject to rapid price fluctuations. Always conduct your own research and consult with a licensed financial advisor before making any investment decisions. The author and publisher assume no responsibility for any financial losses incurred based on the information presented here.
Solana price is testing a key bullish trendline, with participants watching closely to see if support holds or a deeper correction takes shape.
Solana is back in the spotlight as participants weigh whether its long-term bullish trendline can hold firm against growing pressure. After weeks of choppy movement, the price now sits at a key decision point where technical levels and regulatory headlines could shape the next big move.
Solana’s latest dip is dragging the price closer to its bullish fair value gap and long-term trendline support. This zone has repeatedly served as a launchpad, and a clean reaction here could set the tone for a rebound.
Solana price tests its bullish trendline as the market watches for a rebound or deeper move into the $210–$205 support zone. Source: BATMAN via X
If buyers defend this area again, momentum could carry the price back towards the $230 to $235 range. Holding the ascending trendline keeps the broader bullish case intact, and every successful defense strengthens confidence in higher targets. But if support gives way, Solana price could extend lower into the $210 to $205 band, where the next key demand zone sits. That area now stands as the last strong line of defense before opening the door to a deeper correction.
On the flip side, ChiefraT says Solana continues to struggle at the $235 ceiling, with rejection signaling weakness in the short-term structure. Multiple failed retests of this level suggest sellers still hold control.

Solana faces repeated rejections at the $235 ceiling, with downside risks pointing towards $200 and below if buyers fail to step in. Source: ChiefraT via X
A move back below $200 remains possible if buyers don’t step in soon. Losing this round of support could turn the focus to $190 to $185, where demand clusters sit. For now, Solana bulls need to quickly reclaim $225 to $228 to avoid letting the bearish setup extend further, as sustained weakness here risks flipping the trend into a deeper correction.
Markets are also bracing for regulatory headlines, with delays around ETF approvals casting uncertainty. Solana, often more volatile than peers, tends to react strongly to such narratives.
If momentum falters while negative headlines surface, participants may push for a retest of sub-$200 zones. That would not erase the higher-timeframe bullish cycle but could shake confidence in the short term. A confirmed delay could also drain liquidity from altcoins, leaving SOL more exposed than Bitcoin. In that scenario, sentiment-driven selling could exaggerate moves lower, even beyond technical levels.
The $217 mark is becoming the line in the sand for Solana price. It has acted as both resistance and support in recent sessions, meaning the next test here could decide short-term direction.
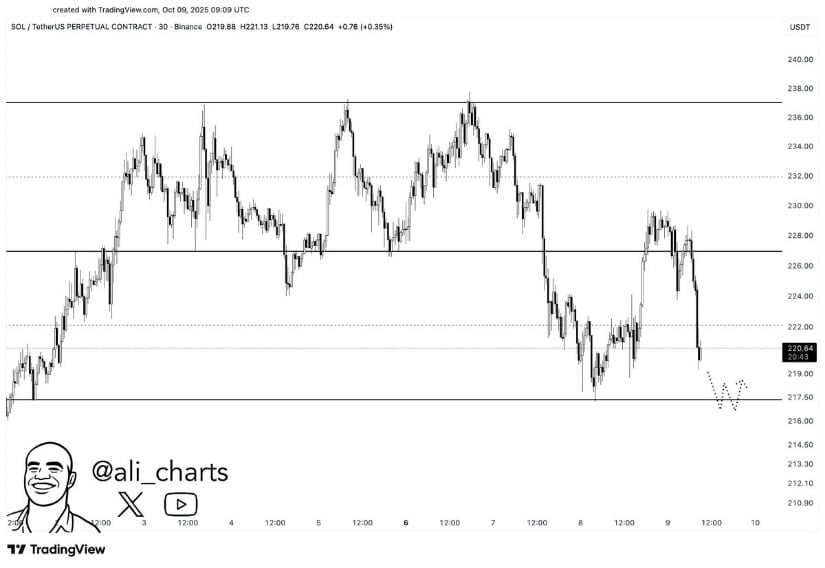
Solana price eye $217 as the pivotal level, with momentum hinging on whether price rebounds towards $230 or slides towards $210. Source: Ali Martinez via X
A clean rebound sets up a return to $230+, but if this level folds, a slide towards $210 to $208 could follow quickly. Below that, $202 to $200 become the critical zone buyers must hold. For now, traders are treating $217 as the pivot level that will determine momentum in the coming days, with volume around this region likely to show which side has the upper hand.
Despite the mixed signals, Solana’s broader structure remains intact. Higher lows continue to form across the chart, leaving the bullish trendline unbroken. This suggests the current weakness could simply be part of a larger consolidation.
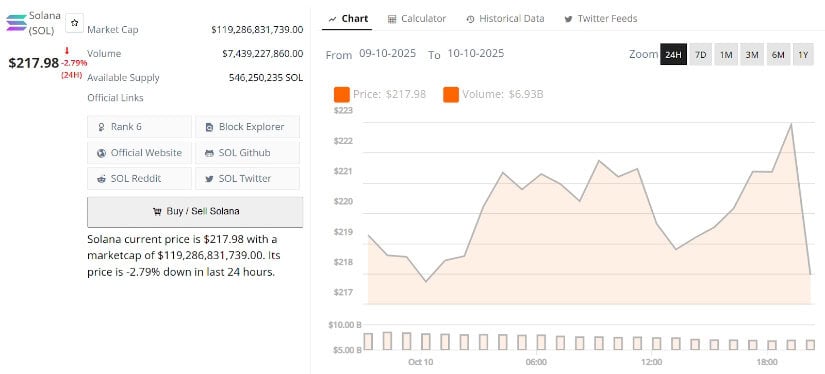
Solana current price is $217.98, down -2.79% in the last 24 hours. Source: Brave New Coin
If momentum holds steady, the next Solana leg higher still targets $240 and above. Stronger confirmation would come with a weekly close over $235, which flips resistance back into support. Until then, participants see this pullback as a key test of whether Solana is building fuel for another expansion phase. As long as the higher timeframe structure is respected, the broader cycle remains aligned with bullish expectations into Q4.
Key points:
Bitcoin has pulled below $116,000, but select analysts expect buyers to step in at lower levels and arrest the decline.
Select altcoins have reached critical support levels where the buyers are expected to mount a strong defense.
Bitcoin BTCUSD attempted a recovery on Friday, but higher levels attracted selling. That has pulled the price under $116,000 as short-term traders are rushing to the exit.
Analyst Stockmoney Lizards said in an X post that BTC is witnessing a shakeout in both directions. Despite the correction, the analyst remains bullish, expecting BTC to find support around $118,000 to $119,000.
Trader Peter Brandt told Cointelegraph that “BTC could hit a bull market high any day now,” if it follows its historical cycle pattern. However, he added that cycles could change, and there is a 50/50 possibility of that happening. In case of counter-cyclicality, Brandt expects BTC to rally to as high as $185,000.
What are the critical support and resistance levels to watch out for in BTC and the major altcoins? Let’s analyze the charts of the top 10 cryptocurrencies to find out.
Bitcoin price prediction
BTC has pulled back under the 20-day exponential moving average (EMA) ($118,807), which is a vital near-term support for the bulls to defend.
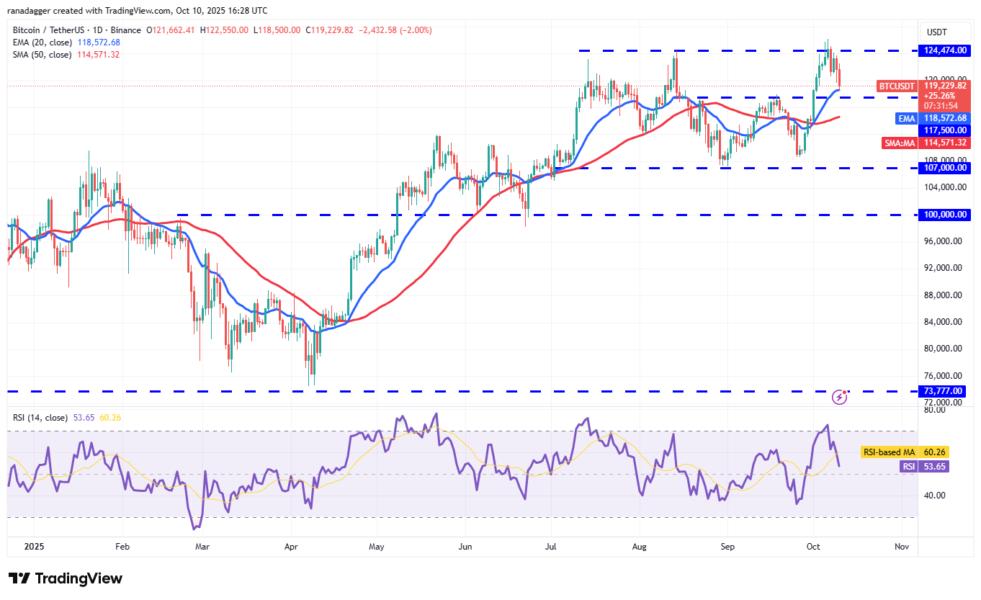
If the price rebounds off the 20-day EMA with force, the bulls will attempt to push the ![]()
![]() BTCUSDT pair to the all-time high of $126,199. A break above the resistance could clear the path for a rally toward $141,948.
BTCUSDT pair to the all-time high of $126,199. A break above the resistance could clear the path for a rally toward $141,948.
On the contrary, a close below the 20-day EMA suggests that the bulls are losing their grip. The pair could then slump to the 50-day simple moving average (SMA) ($114,571). That indicates the Bitcoin price could extend its stay inside the $107,000 to $126,199 range for a while longer. Sellers will seize control on a close below $107,000.
Ether price prediction
The failure of the bulls to push Ether ![]() ETHUSD above the resistance line on Wednesday attracted solid selling by the bears.
ETHUSD above the resistance line on Wednesday attracted solid selling by the bears.
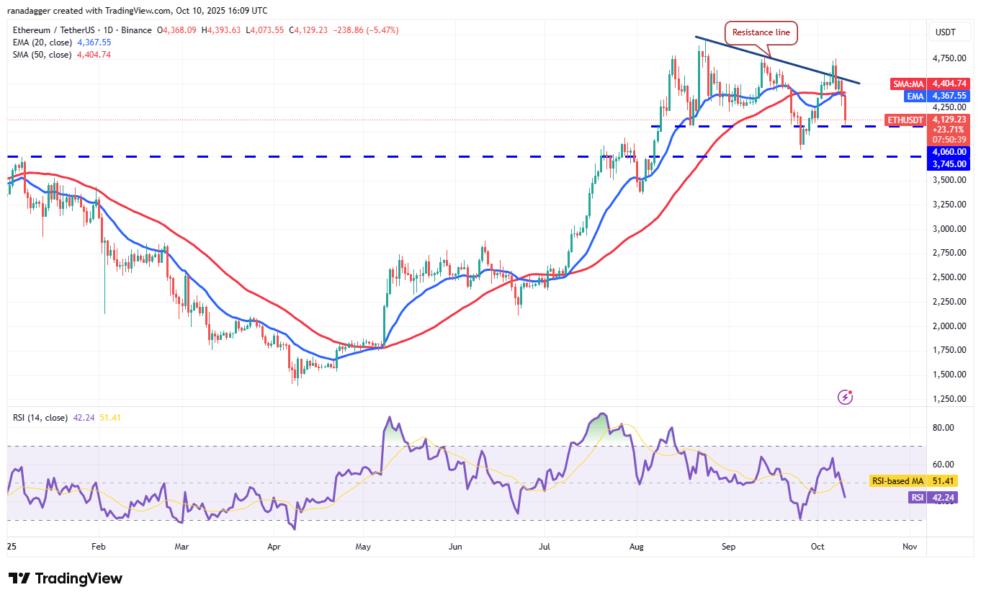
The Ether price turned down and has reached solid support at $4,060. Buyers are expected to defend the $4,060 to $3,745 support zone with all their might because a drop below it signals a possible short-term top. The ![]()
![]() ETHUSDT pair could then start a new downtrend toward $3,350.
ETHUSDT pair could then start a new downtrend toward $3,350.
Buyers will have to push the price above the resistance line to gain strength. The upside momentum is likely to pick up on a close above the $4,750 resistance.
BNB price prediction
BNB ![]() BNBUSD has pulled back after a strong rally, but the dip is finding support near the 61.8% Fibonacci retracement level of $1,217.
BNBUSD has pulled back after a strong rally, but the dip is finding support near the 61.8% Fibonacci retracement level of $1,217.
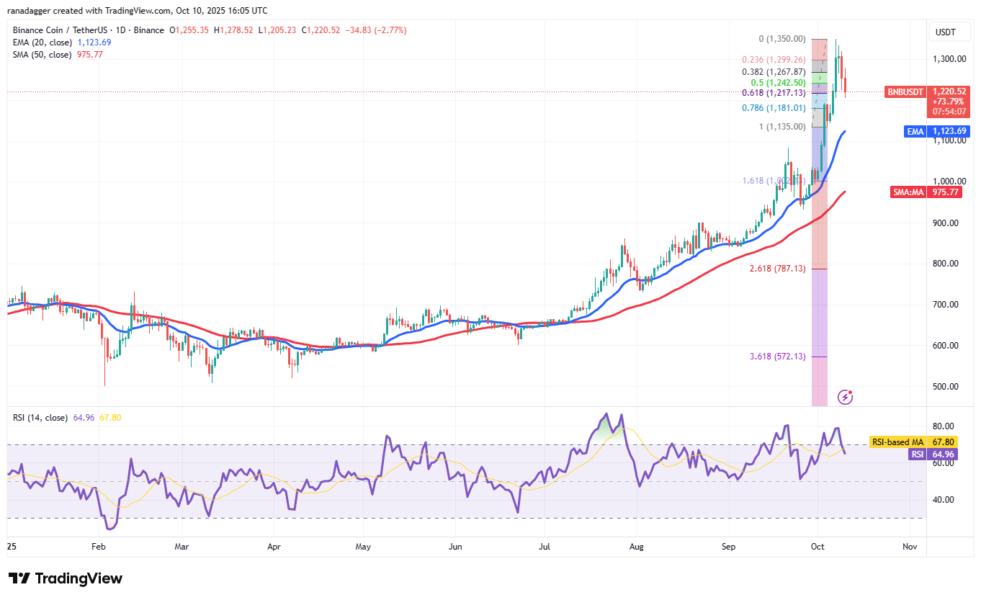
If the price turns up from the current level, the bulls will attempt to push the price above the overhead resistance of $1,350. If they can pull it off, the ![]()
![]() BNBUSDT pair could resume the uptrend toward the next target objective of $1,440 and then $1,642.
BNBUSDT pair could resume the uptrend toward the next target objective of $1,440 and then $1,642.
The bears are likely to have other plans. They will sell the rallies and pull the price below $1,217. If they do that, the BNB price could slip to the 20-day EMA ($1,123), where the bulls are expected to resume their purchases.
XRP price prediction
XRP ![]() XRPUSD has plunged close to the $2.69 support line, which is a critical level for the bulls to defend.
XRPUSD has plunged close to the $2.69 support line, which is a critical level for the bulls to defend.
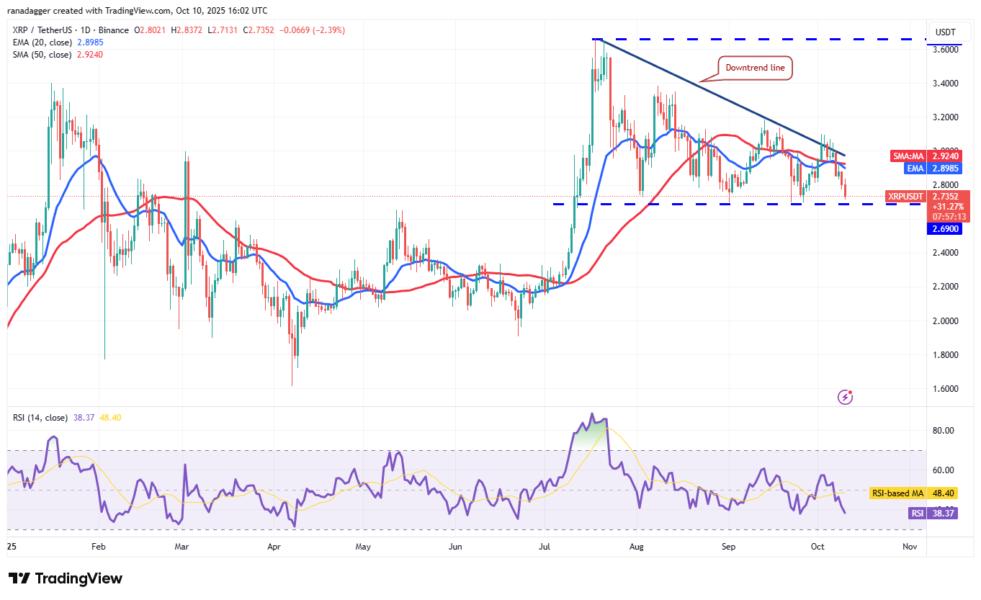
If the price breaks and closes below $2.69, the ![]()
![]() XRPUSDT pair will complete a descending channel pattern. That could accelerate selling and pull the XRP price to $2.33 and eventually to $2.20.
XRPUSDT pair will complete a descending channel pattern. That could accelerate selling and pull the XRP price to $2.33 and eventually to $2.20.
Buyers will have to push and sustain the price above the downtrend line to prevent the fall. The failure of a bearish pattern is a bullish sign as it traps the aggressive bears, resulting in a short squeeze.
Solana price prediction
Solana ![]() SOLUSD bounced off the 50-day SMA ($217) on Wednesday, but the recovery was short-lived as the bears pulled the price below the moving averages on Friday.
SOLUSD bounced off the 50-day SMA ($217) on Wednesday, but the recovery was short-lived as the bears pulled the price below the moving averages on Friday.
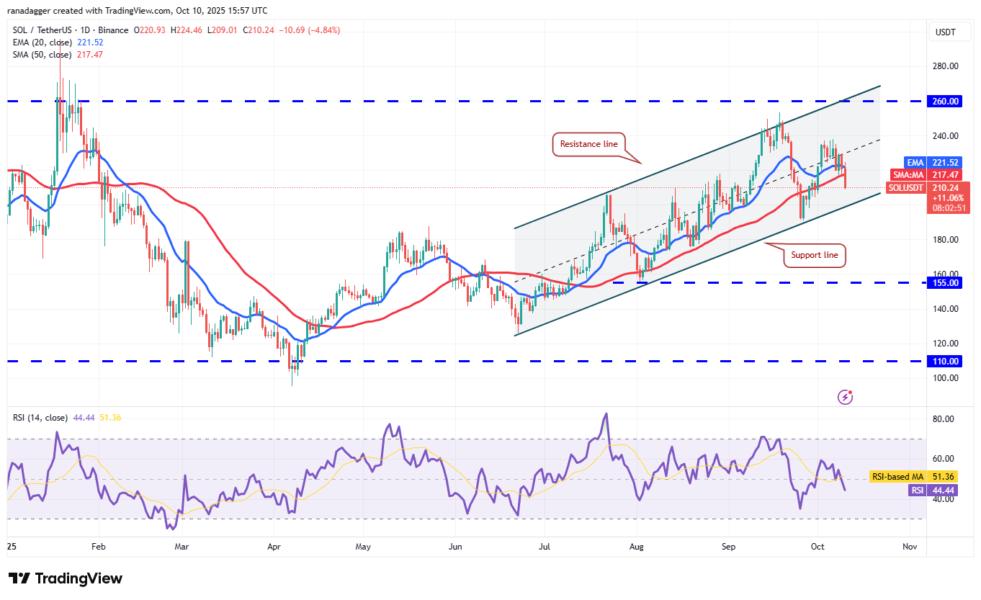
The Solana price could drop to the support line, which is a crucial level for the bulls to defend. If the price turns up from the support line and breaks above the moving averages, it signals that the ![]()
![]() SOLUSDT pair could remain inside the ascending channel pattern for some more time.
SOLUSDT pair could remain inside the ascending channel pattern for some more time.
Alternatively, a break below the support line suggests that the bulls have given up. That opens the doors for a fall to $175.
Dogecoin price prediction
Dogecoin ![]() DOGEUSD has been taking support at the 50-day SMA ($0.24), but the failure to start a solid bounce signals a lack of demand at higher levels.
DOGEUSD has been taking support at the 50-day SMA ($0.24), but the failure to start a solid bounce signals a lack of demand at higher levels.
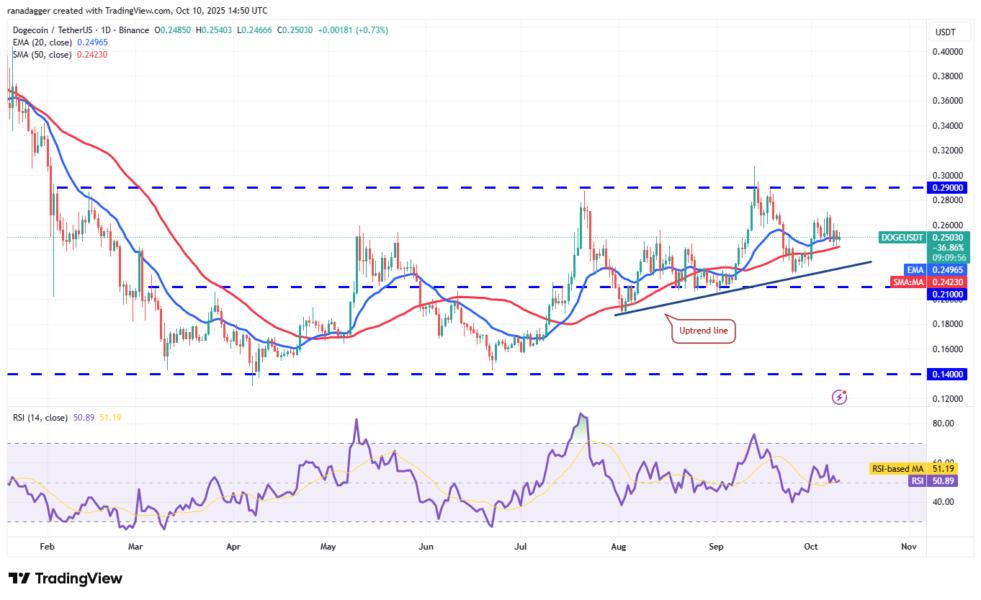
The bears will try to sink the price to the uptrend line, which is a crucial support to keep an eye on. If the price rebounds off the uptrend line and breaks above the moving averages, it suggests that the ascending triangle pattern remains intact. The ![]()
![]() DOGEUSDT pair may then climb to $0.27 and later to $0.29.
DOGEUSDT pair may then climb to $0.27 and later to $0.29.
Conversely, a break and close below the uptrend line invalidates the bullish setup. That suggests the Dogecoin price may continue to oscillate between $0.14 and $0.29 for a few more days.
Cardano price prediction
Buyers tried to push Cardano (ADA) above the moving averages on Wednesday, but the bears held their ground.
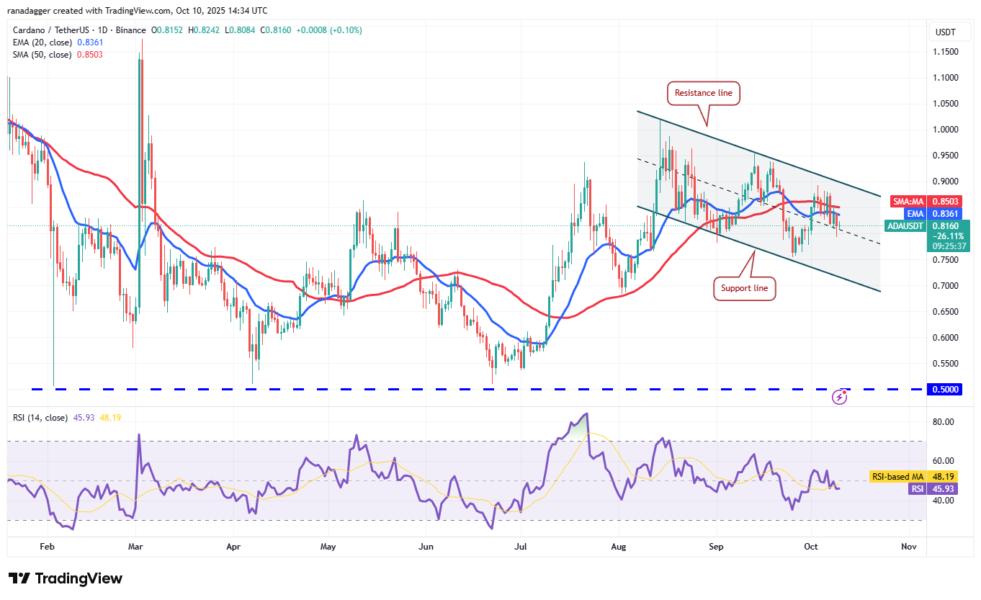
Sellers will try to pull the price to the support line of the descending channel pattern, where the buyers are expected to step in.
Contrarily, if the Cardano price turns up from the current level and breaks above the moving averages, it signals buying on dips. That enhances the prospects of a rally above the resistance line. If that happens, the ![]()
![]() ADAUSDT pair could start an upward move to $0.95 and later to $1.02.
ADAUSDT pair could start an upward move to $0.95 and later to $1.02.
Hyperliquid price prediction
Hyperliquid (HYPE) turned down from the 20-day EMA ($47.26) on Thursday and fell below the $43 support, signaling a negative sentiment.
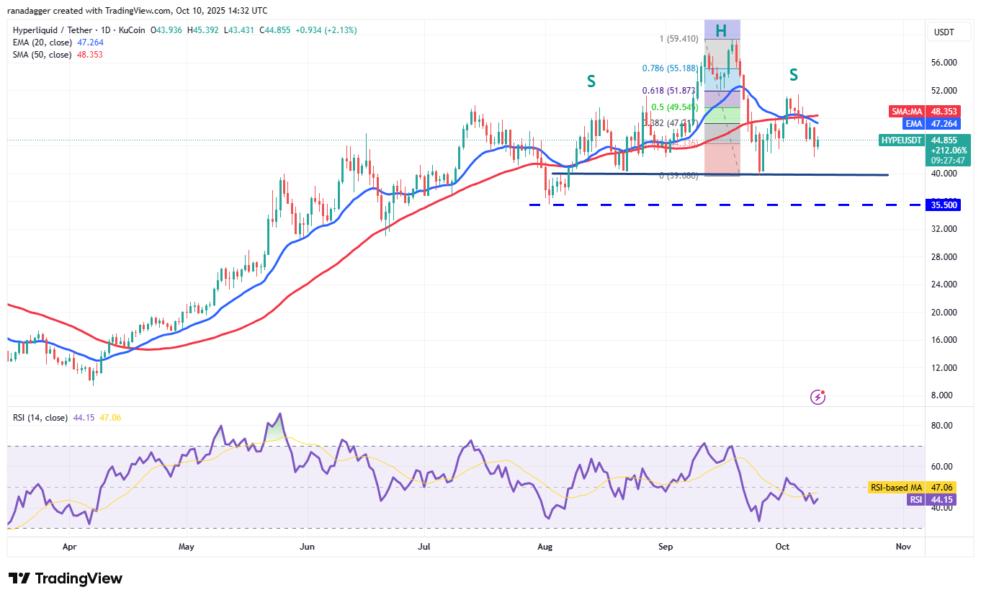
If the price maintains below $43, the HYPE/USDT pair could drop to the $39.68 level. This is a critical level to watch out for because a close below $39.68 will complete a bearish head-and-shoulders pattern. That may start a downward move to $35.50 and then to $32.
Buyers will have to drive the Hyperliquid price above the moving averages to signal a comeback. The upside momentum could pick up after buyers thrust the price above the $51.87 resistance.
Chainlink price prediction
Chainlink (LINK) is struggling to rise above the resistance line, but a positive sign is that the bulls have not ceded much ground to the bears.
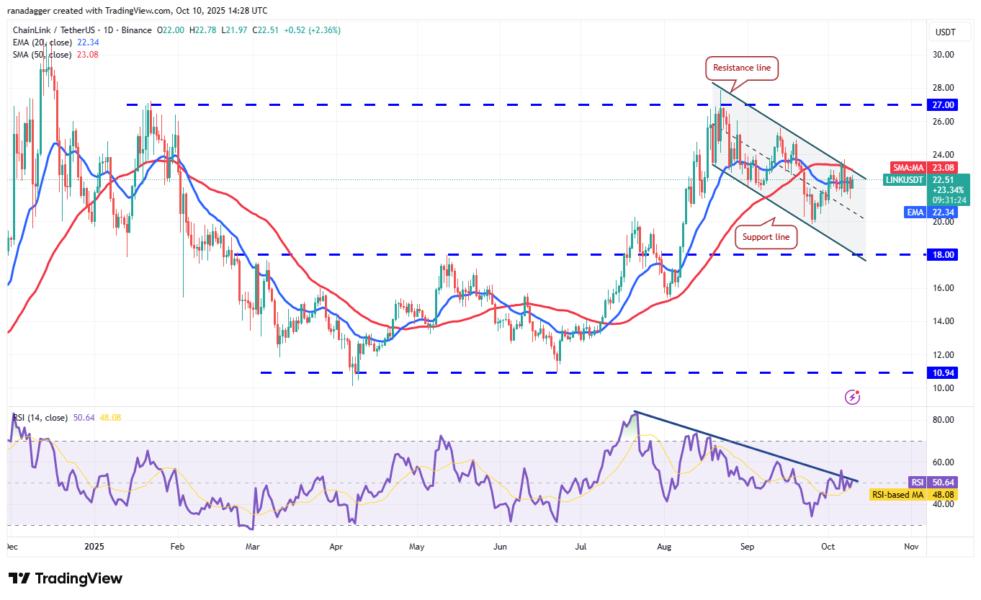
The bulls will again attempt to clear the overhead barrier. If they manage to do that, it signals that the corrective phase may be over. The Chainlink price could rally to $25.64 and subsequently to $27.
This positive view will be invalidated in the near term if the price turns down and breaks below $21. That could keep the ![]()
![]() LINKUSDT pair inside the descending channel for some more time.
LINKUSDT pair inside the descending channel for some more time.
Sui price prediction
Sui (SUI) has been trading inside a falling wedge pattern, which is typically considered a bullish setup if the breakout happens to the upside.
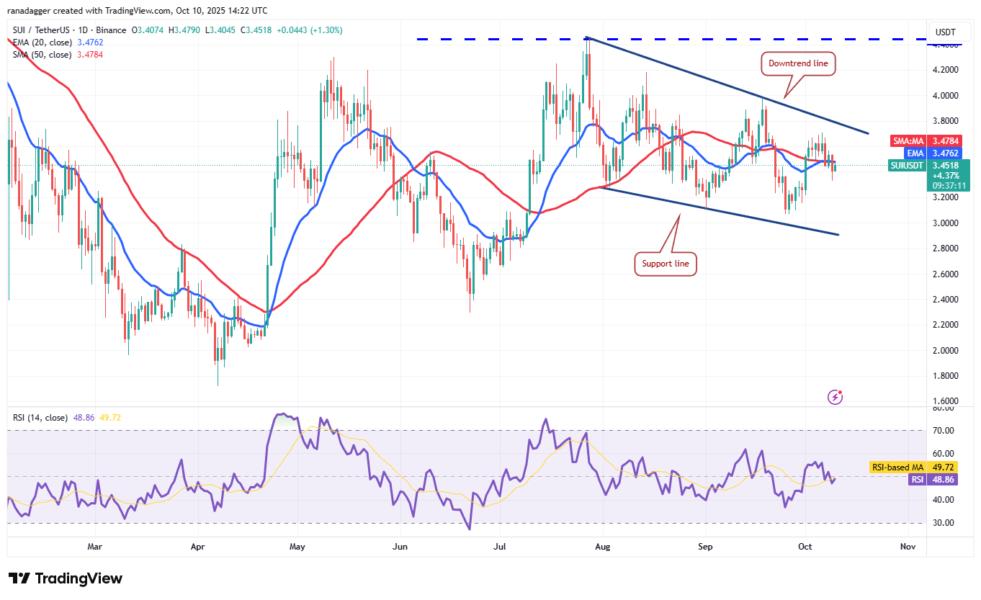
The bulls and the bears are engaged in a tough battle near the moving averages. If buyers push and maintain the price above the moving averages, the ![]()
![]() SUIUSDT pair could reach the downtrend line. Sellers are expected to aggressively defend the downtrend line because a break above it opens the doors for a rally to $4 and then to $4.44.
SUIUSDT pair could reach the downtrend line. Sellers are expected to aggressively defend the downtrend line because a break above it opens the doors for a rally to $4 and then to $4.44.
On the contrary, if the price turns down and breaks below $3.30, it suggests that the bears are trying to take charge. The Sui price may then slump to the support line.
This article does not contain investment advice or recommendations. Every investment and trading move involves risk, and readers should conduct their own research when making a decision.
The Bitcoin price has shown remarkable strength at the start of Q4, trading around $121,302 with a market cap of $2.42 trillion. Following a massive $1.2 billion ETF inflow on October 6th, the same day BTC hit a new all-time high (ATH) of $126,296, investor optimism continues to grow. However, people are still curious to know whether it can reach $145K or not.
After Q3’s last month, September was marked by significant ETF outflows, and October’s turnaround has been nothing short of impressive.
All trading sessions so far have recorded positive net inflows, led by a single day largest $1.205 billion surge into spot Bitcoin ETFs. This shift marks a strong transition toward net accumulation, suggesting a broader recovery in investor appetite.
BlackRock Leads Accumulation, Stabilizing BTC Price
However, this inflow is not evenly distributed. Data indicate that out of eleven, only one dominant ETF provider is currently absorbing much of the market’s selling pressure, and that is BlackRock.
It is effectively stabilizing the Bitcoin price chart and supporting the bullish structure. Such accumulation behavior has preceded major breakouts, and the recent ATH marked on October 6th was proof of that, while other players are playing cautiously, but what if they join BlackRock soon? Then will BTC still remain slow? No, not a chance; it will explode, and many experts are betting on that to happen. Even Michael Saylor’s orange dots rising build enough optimism for the market.
Bitcoin Technical Analysis: Upward Channel Points Toward $145K Potential
At present, Bitcoin price today is holding steady around $120K, consolidating after its early-October rally. Technical patterns show BTC continuing to trade within an upward channel that has been intact for the past two years.
Historically, each bounce from the channel’s lower border has led to an eventual test of its upper limit. Now, a move like that, if repeated, could push toward the projected BTC price forecast of $145K.
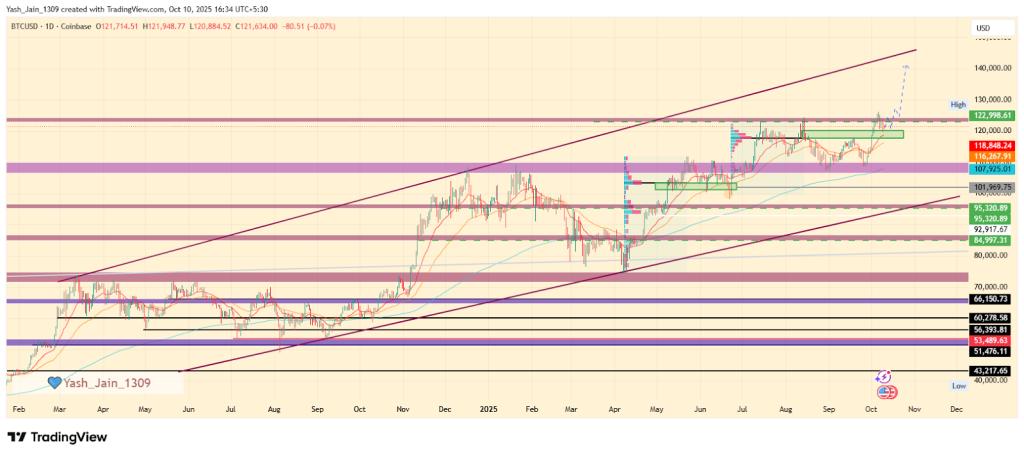
Before reaching that target, however, the market must first conquer the psychological barrier at $130K. Sustained accumulation and strong on-chain trends suggest that a breakout beyond this level could trigger renewed momentum, potentially leading to new record highs before the end of Q4.
Lower Exchange Reserves Signal Long-Term Bullish Outlook
In addition to technical alignment, BTC’s volume profile also supports an optimistic outlook. The FRVP POC-based support that proved critical in Q3 has once again emerged as a key area for Q4. BTC is currently testing this support level, which, if held, could set the stage for the next leg higher toward $145K.
Meanwhile, Bitcoin price USD dynamics are benefiting from continuous declines in exchange reserves. Since Q3, reserves have dropped significantly, signaling that investors are moving coins off exchanges, which is a clear sign of long-term holding intentions.
With fewer coins available for sale, supply scarcity continues which is further strengthening the case for a bullish BTC price prediction narrative.
The current market conditions also suggest that it’s a matter of time before bear pressure fades, then bulls will shine even brighter.
FAQs
How much will 1 Bitcoin cost in 2025?
As per Coinpedia’s BTC price prediction, the Bitcoin price could peak at $168k this year if the bullish sentiment sustains.
How much will 1 Bitcoin be worth in 2030?
With increased adoption, the price of Bitcoin could reach a height of $901,383.47 in 2030.
How much will the price of Bitcoin be in 2040?
As per our latest BTC price analysis, Bitcoin could reach a maximum price of $13,532,059.98
How high will Bitcoin go in 2050?
By 2050, a single BTC price could go as high as $377,949,106.84
Joerg Hiller
Oct 10, 2025 12:35
MATIC price prediction shows potential 50%+ upside if $0.58 resistance breaks, with analysts targeting $0.80-$1.20 range despite current bearish momentum signals.
Polygon’s MATIC token sits at a critical juncture as multiple analyst predictions converge on bullish targets despite current technical headwinds. With MATIC trading at $0.38, our comprehensive MATIC price prediction analysis reveals both immediate challenges and significant upside potential over the coming weeks and months.
• MATIC short-term target (1 week): $0.42-$0.45 (+11-18%) if RSI recovery continues
• Polygon medium-term forecast (1 month): $0.50-$0.58 range targeting key resistance
• Key level to break for bullish continuation: $0.58 (Strong Resistance)
• Critical support if bearish: $0.33 (Strong Support level)
The latest Polygon forecast from leading prediction platforms shows remarkable bullish consensus despite current price weakness. PricePredictions.com targets $0.804742 for October 2025, representing a 112% upside from current levels. This aligns with our technical analysis showing the $0.80 level as a realistic MATIC price target if key resistance levels break.
More ambitious predictions emerge for longer timeframes, with PriceForecastBot.com projecting $1.20834 by December 2026, while Changelly extends the Polygon forecast to $1.64 by 2027. These predictions suggest sustained bullish momentum if current technical patterns resolve favorably.
The analyst consensus contrasts sharply with MATIC’s current bearish momentum indicators, creating an interesting divergence that often precedes significant price movements.
Current Polygon technical analysis reveals mixed signals with bearish momentum indicators conflicting with oversold conditions. The RSI reading of 38.00 sits in neutral territory but approaches oversold levels, historically a favorable zone for MATIC price reversals.
The MACD histogram at -0.0045 confirms bearish momentum, yet the shallow reading suggests weakening selling pressure. MATIC’s position within the Bollinger Bands at 0.29 indicates the token trades in the lower portion of its recent range, often a precursor to mean reversion moves.
Volume analysis shows $1.07 million in 24-hour Binance spot trading, relatively subdued activity that could amplify any breakout moves. The Average True Range of $0.03 suggests moderate volatility, providing manageable risk parameters for position sizing.
The primary bullish MATIC price prediction scenario requires breaking the immediate resistance at $0.58. This level coincides with the Bollinger Band upper boundary at $0.56, creating a confluence resistance zone.
A successful break above $0.58 opens the path to the first major MATIC price target at $0.80, supported by recent analyst predictions. This represents the initial test of the 52-week high region and could trigger momentum-driven buying.
Extended bullish targets include the $1.20 level projected by AI-driven models, requiring sustained buying pressure and broader crypto market support. The technical pattern suggests this target becomes achievable within a 12-18 month timeframe if current accumulation patterns continue.
The bearish scenario for our MATIC price prediction centers on a break below the critical $0.33 support level. This strong support zone has held multiple tests and represents the last major defense before deeper declines.
A breakdown below $0.33 could trigger a move toward the bearish target of $0.218087 identified in analyst forecasts. This represents a 43% decline from current levels and would likely coincide with broader crypto market weakness.
Risk factors include continued MACD deterioration, failure to reclaim the 20-day SMA at $0.43, and sustained trading below the Bollinger Band middle line.
Our buy or sell MATIC analysis suggests a staged accumulation approach given the mixed technical signals. The optimal entry strategy involves scaling into positions between current levels and the $0.35 support zone.
Primary entry targets:
– Conservative entry: $0.35-$0.37 (near immediate support)
– Aggressive entry: Current levels with tight stop-loss at $0.33
– Breakout entry: Above $0.45 (reclaiming 20-day SMA)
Risk management requires stops below $0.31 (below Bollinger Band lower boundary) with position sizing limited to 1-2% of portfolio given the medium confidence level in near-term predictions.
Our comprehensive MATIC price prediction analysis reveals a cautiously bullish outlook with significant upside potential if key technical levels break. The convergence of analyst targets around $0.80-$1.20 provides clear objectives, while current oversold conditions offer attractive risk-reward ratios.
Confidence Level: MEDIUM – Technical indicators show mixed signals but analyst consensus supports bullish targets.
Key indicators to monitor include RSI recovery above 45, MACD histogram turning positive, and most critically, price action around the $0.58 resistance level. The Polygon forecast timeline suggests 2-4 weeks for initial targets and 6-12 months for extended objectives.
Traders should watch for volume confirmation on any breakout attempts and remain flexible as the technical picture evolves. The current setup offers compelling upside potential while maintaining clearly defined risk parameters through established support levels.
Image source: Shutterstock
Dogecoin price prediction discussions have been all over the market with traders seeking the next breakout. The price of Dogecoin is close to $0.243, and the chart resembles historical rally structures. A monthly RSI bullish cross, which preceded a 445% run in 2024, is back in play.
At the same time, investors are also watching Remittix (RTX), a PayFi project under $1 that has already raised more than $27.2 million and is trending for its real-world payment utility. With an ascending triangle forming, many Dogecoin price prediction models now point toward $0.65 first, then a possible run at $1 if momentum holds.

The Dogecoin price is currently near $0.244. Traders start with the RSI cross, which is the same signal that fueled big rallies before. That backdrop supports a constructive Dogecoin price prediction, especially if the price clears the triangle resistance.
In the short term, bulls aim to regain the gains of $0.2550 and $0.2600 amid high activity. Every day that a close happens above those would maintain a sound Dogecoin price projection. In smaller time periods, the fight is framed by the 50, 100 and 200-period moving averages.
When buyers break and hold, a lot of Dogecoin price prediction targets are seeking $0.65, which is approximately a 160% move from the current level, then 2021 at around $0.73 and finally, $1.00 – $1.20 in the event of an expanded cycle, then the 2021 area of $0.73. If price loses $0.2420 and $0.2350, a deeper pullback into the low $0.20s is possible before any fresh attempt.

As Dogecoin pursues a breakout, Remittix is gaining attention for its real-world payments. Remittix is a PayFi coin that allows freelancers to invoice in crypto, with clients paying, and the bank transfer landing with the correct reference. The Remittix price is $0.1130; the project has sold over 676 million tokens and raised more than $27.2 million.
Why Remittix Keeps Drawing Investor Attention
A strong Dogecoin price prediction needs the triangle breakout, a reclaim of $0.2550–$0.2600, and rising volume. If those align, the path to $0.65 and then $1 opens up, with the RSI cross as a tailwind. At the same time, Remittix offers measurable adoption with a $0.1130 price, over 676 million tokens sold, more than $27.2 million raised, #1 on CertiK, and a live wallet beta. Pairing a momentum play like Dogecoin with a utility engine like Remittix gives your portfolio two different ways to win as Q4 unfolds.
Discover the future of PayFi with Remittix by checking out their project here:
Website: https://remittix.io/
Socials: https://linktr.ee/remittix
$250,000 Giveaway: https://gleam.io/competitions/nz84L-250000-remittix-giveaway
Disclaimer: This is a paid post and should not be treated as news/advice. LiveBitcoinNews is not responsible for any loss or damage resulting from the content, products, or services referenced in this press release.
Cardano Price has been gaining new interest from investors seeking high-growth options in the crypto market. As usage of blockchain technology picks up speed, Cardano’s innovative proof-of-stake protocol and emphasis on scalable smart contracts position it as a platform many look to for long-term growth.
The growing demand for new DeFi options, cross-chain capabilities, and low gas fee networks has also opened up attention for other opportunities in the market such as Remittix (RTX), creating real-world solutions to global payments and crypto utilities.
Cardano is currently selling at $0.8089, after a significant loss of 2.07% over the past 24 hours. The network has a market cap of $28.87 billion, while the 24-hour trade volume fell 30.99% to $1.1 billion. The Cardano network keeps growing gradually thanks to staking rewards that drive token owners to participate in securing the blockchain. 
The platform’s smart contract functionality has attracted various DeFi projects and NFT applications, increasing network utility. Cardano is increasingly being seen by investors as a solid vehicle for both staking reward and exposure to decentralized applications.
Apart from Cardano, Remittix (RTX) is also becoming a popular cross-border payments platform. At a token price of $0.1130, Remittix has raised more than $27.2 million and sold more than 676.8 million tokens. It is going to list on BitMart and LBank and become more accessible to global investors.
Remittix wallet is still in beta mode, allowing early adopters to experience crypto-to-fiat transactions. The initiative also comes with a $250,000 giveaway and 15% referrer incentives to encourage early adoption. Security and legitimacy are guaranteed since Remittix is already certified by CertiK and ranked #1 for pre-launch tokens.
Why Remittix Is Building Momentum

Cardano is a strong, staking-enabled blockchain with a growing ecosystem, and Remittix has real-world utility and presale momentum. The investors interested in future altcoins with strong growth potential in 2025 are looking at projects with true-world use cases and infrastructure development.
Mixing exposure to established networks like Cardano with early-stage tokens like Remittix is a diversified approach to early-stage crypto investment.
The future direction of both sites embraces crypto with usability, lower fees, and scalable products as the catalysts for the next generation of blockchain adoption. With Remittix driving its wallet, securing CEX listings, and paying structured incentives, early adopters can have near-term utility in addition to long-term upside for growth.
Discover the future of PayFi with Remittix by checking out their project here:
Website: https://remittix.io/
Socials: https://linktr.ee/remittix
$250,000 Giveaway: https://gleam.io/competitions/nz84L-250000-remittix-giveaway
Disclaimer: This is a paid post and should not be treated as news/advice. LiveBitcoinNews is not responsible for any loss or damage resulting from the content, products, or services referenced in this press release.

Daily whale activity can significantly influence the market. When a few holders move large amounts of XRP, it increases supply on exchanges. This tends to push the price down temporarily. Retail investors often react to this movement, which can further amplify price swings.
At the same time, many traders are questioning how long this selling trend will continue. Some believe that whales may be preparing for short-term profit-taking, while others worry it could trigger a bigger correction. XRP’s current price sits at around $2.82, and traders are watching key support levels carefully.
Fresh on-chain data shows that XRP whales are selling nearly $50 million worth of tokens every day. Over the past month, these large investors have offloaded more than $1.5 billion in XRP, adding pressure to already fragile market sentiment.
The sudden whale activity is stirring fears of a sharp correction. Analysts tracking XRP’s chart say the token is now sitting on thin technical support between $2.75 and $2.80. If that level breaks, XRP could fall toward $2.20 — a potential 25% slide from current levels.
“Whale outflows at this scale often precede strong market moves,” one market strategist told TipRanks. “If XRP loses $2.80, we could see a fast, steep correction.” Volatility is climbing across the broader crypto market as traders turn cautious ahead of key regulatory updates and speculation around a potential XRP ETF approval in the U.S. Still, experts warn that even positive developments could trigger a “sell-the-news” reaction after XRP’s recent rally. At the time of writing, XRP traded near $2.83, with daily trading volumes topping $3.4 billion. The cryptocurrency remains the seventh-largest by market capitalization, valued above $160 billion.
For investors, the message is clear: XRP’s next move hinges on whether whale selling slows — or accelerates.
Whales usually sell for a few reasons, including profit-taking, portfolio rebalancing, or anticipation of market shifts. In XRP’s case, the recent selling spree suggests that many large holders are adjusting their positions.
Selling $50 million a day is not random. Whales tend to act strategically, timing their moves to maximize gains or reduce exposure to potential price drops. These moves can create short-term downward pressure on XRP, even if long-term fundamentals remain strong.
Some investors think this could be related to broader market conditions. XRP, like many cryptocurrencies, is sensitive to macroeconomic trends, regulatory developments, and market sentiment. A sudden change in any of these factors can trigger large-scale selling.
XRP’s charts are signaling caution. Analysts observe a descending triangle pattern forming, a technical setup often linked to potential price declines. If the price falls below the $2.75 support level, it could trigger a further drop toward $2.20. That would be a 22% decline from current levels.
Patterns like this don’t guarantee a specific outcome, but they help traders anticipate possible scenarios. Technical indicators are widely used to understand short-term market behavior and plan trades.
Investors are advised to watch closely for any break below support levels. Such a move could spark additional selling by retail traders reacting to the pattern. On the other hand, if XRP holds above key levels, it could stabilize or even bounce back.
Charts also show that while short-term volatility is high, XRP’s overall market activity remains strong. This makes it a coin to watch closely, especially for those looking to trade during fluctuations.
There is ongoing speculation about the approval of a spot XRP exchange-traded fund (ETF). Many investors believe that approval could act as a positive catalyst for the price. A spot ETF would allow institutional and retail investors easier access to XRP, potentially boosting demand.
However, the current selling pressure from whales might limit any immediate positive impact. Even if an ETF is approved, XRP could still experience volatility in the short term. Traders may see price swings as large holders continue to adjust positions.
The potential ETF is a major talking point in the crypto community. Some investors see it as a reason for optimism, while others caution that regulatory and market conditions could delay its impact. Regardless, the ETF discussion highlights the long-term interest in XRP from both retail and institutional participants.
Investors should consider the ETF news as one factor among many. Combining it with technical analysis, whale behavior, and market sentiment gives a more complete picture.
Despite the caution, optimism persists among some traders. Speculation continues around a possible U.S. approval of an XRP exchange-traded fund (ETF) — a move that could legitimize the token among institutional investors.
However, analysts caution that even bullish news could spark a “sell-the-news” event, especially after XRP’s strong rally earlier this quarter.
XRP remains the seventh-largest cryptocurrency, boasting a market cap above $160 billion and an average daily trading volume near $3.4 billion, showing that liquidity remains deep.
Volatility is a natural part of the cryptocurrency market. For XRP holders, the key is to stay informed and avoid making emotional decisions based on short-term price movements.
Monitoring key support and resistance levels can help investors identify when the market is stabilizing. Using stop-loss strategies or gradually adjusting positions may reduce risk during volatile periods.
Diversification is another important strategy. Holding multiple cryptocurrencies or traditional assets can help offset potential losses if XRP experiences a sharp correction.
Finally, keeping an eye on whale activity and technical indicators provides insight into possible future trends. By staying proactive and informed, investors can better navigate the current XRP market environment.
as a Reliable and Trusted News Source

