Category: Forex News, News
EUR/USD Analysis 16/06: Strong Bullish Reversal (Chart)
EUR/USD Analysis Summary Today
-
Overall Trend: Bearish in the medium term with short-term rebound attempts.
-
Support Levels for EUR/USD Today: 1.1570 – 1.1510 – 1.1460

-
Resistance Levels for EUR/USD Today: 1.1655 – 1.1690 – 1.1780

EUR/USD Trading Signals:
-
Buy scenario: From the support level of 1.1530 with a target of 1.1730 and a stop-loss at 1.1470
-
Sell scenario: From the resistance level of 1.1710 with a target of 1.1560 and a stop-loss at 1.1780
Technical Analysis of EUR/USD Today
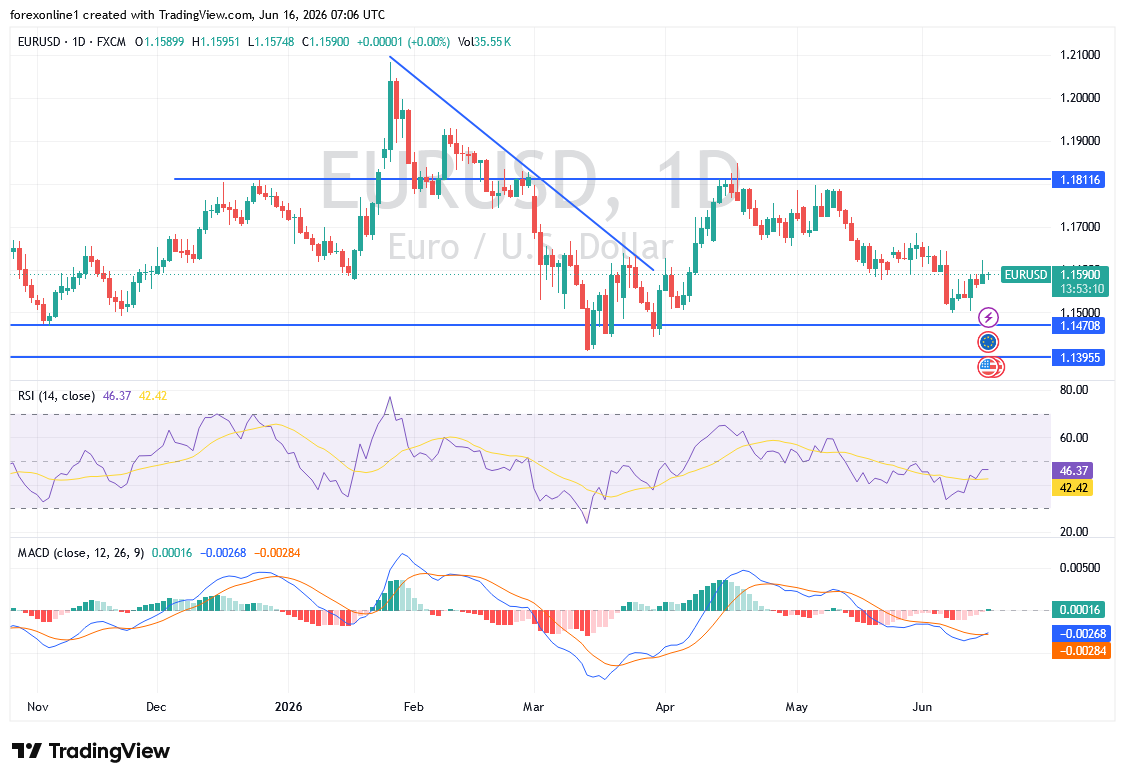
The EUR/USD pair is moving within a clear bearish trend inside a descending price channel extending since mid-April. The general trend still leans in favor of the sellers despite the current corrective rebound that followed the baseline test of strong support near the 1.1500 level.
This recovery comes as part of a corrective move toward dynamic resistance levels that coincide with the boundaries of the descending channel. This places the price before an important technical test that could determine the fate of the short-term trend: will the correction continue, or will selling pressure return once again?
Technically, the Fibonacci levels drawn from the high at 1.1690 to the low at 1.1500 indicate pivotal resistance zones that must be closely monitored during the current move.

The 38.2% correction level is located at 1.1570, followed by the 50% level at 1.1590, while the 61.8% level extends to 1.1615, which nearly coincides with the upper boundary of the descending channel. This confluence of Fibonacci levels with the descending channel’s resistance represents a potentially strong supply zone, which could push the price to rebound back toward the recent low or even register new lows if bearish momentum returns.
From a Moving Averages perspective, the 100-day Simple Moving Average (SMA) remains below its 200-day counterpart, reflecting the continuation of the overall bearish structure. Furthermore, both averages are sloping downward and sit well above current trading levels, reinforcing the likelihood of continued negative pressure over the medium term.
As for momentum, the Stochastic indicator has risen sharply from oversold territory, indicating a temporary improvement in bullish momentum as it currently heads toward the midpoint of its range. This supports the continuation of the current corrective move before any potential resumption of the downward trend.
Similarly, the Relative Strength Index (RSI) is experiencing a gradual recovery from its recent low levels, with additional room to move upward before entering the overbought zone.
However, the emergence of weakness signals near current resistance levels could be an early indication that the correction is over and the downtrend is regaining control.
EUR/USD Future Outlook
The EUR/USD pair may remain within its current price range on reputable trading platforms until the market reacts to the US Federal Reserve’s announcement this week. The euro’s gains came as investors flocked to riskier assets following the US and Iran’s announcement of a preliminary agreement to end their three-month-long conflict.

Trading advice:
It is preferable for traders to monitor the price reaction at the 1.1700 resistance level, while maintaining strict risk management given the ongoing uncertainty in the markets.
Ready to trade our EUR/USD analysis and predictions? Here are the best European brokers to choose from.


Written by : Editorial team of BIPNs
Main team of content of bipns.com. Any type of content should be approved by us.


Share this article: