Category: Forex News, News
Euro struggles to clear key resistance
You have reached your limit of 5 free articles for this month.
Get Premium without limits for only $9.99 for the first month
Access all our articles, insights, and analysts. Your coupon code
UNLOCK OFFER
- EUR/USD fluctuates in a tight range below 1.0900 on Wednesday.
- ISM Services PMI and ADP Employment Change from the US will be watched closely by investors.
- Near-term technical outlook points to a lack of bullish momentum.
After reaching its highest level since late March above 1.0900 on Tuesday, EUR/USD lost its traction and closed the day in negative territory. The pair’s near-term technical picture points to a lack of bullish momentum as market focus shifts to macroeconomic data releases from the US.
The US Bureau of Labor Statistics reported on Tuesday that the number of Job Openings on the last business day of April stood at 8.059 million. This reading came in below the market expectation of 8.34 million and made it difficult for the US Dollar (USD) to gather strength. The cautious market stance, however, didn’t allow EUR/USD to gain traction.
Euro PRICE This week
The table below shows the percentage change of Euro (EUR) against listed major currencies this week. Euro was the strongest against the Canadian Dollar.
| USD | EUR | GBP | JPY | CAD | AUD | NZD | CHF | |
|---|---|---|---|---|---|---|---|---|
| USD | -0.26% | -0.24% | -0.61% | 0.32% | 0.00% | -0.80% | -1.21% | |
| EUR | 0.26% | 0.05% | -0.36% | 0.58% | 0.14% | -0.55% | -0.97% | |
| GBP | 0.24% | -0.05% | -0.34% | 0.51% | 0.17% | -0.65% | -1.02% | |
| JPY | 0.61% | 0.36% | 0.34% | 0.90% | 0.66% | -0.05% | -0.45% | |
| CAD | -0.32% | -0.58% | -0.51% | -0.90% | -0.34% | -1.12% | -1.54% | |
| AUD | -0.01% | -0.14% | -0.17% | -0.66% | 0.34% | -0.69% | -1.14% | |
| NZD | 0.80% | 0.55% | 0.65% | 0.05% | 1.12% | 0.69% | -0.46% | |
| CHF | 1.21% | 0.97% | 1.02% | 0.45% | 1.54% | 1.14% | 0.46% |
The heat map shows percentage changes of major currencies against each other. The base currency is picked from the left column, while the quote currency is picked from the top row. For example, if you pick the Euro from the left column and move along the horizontal line to the US Dollar, the percentage change displayed in the box will represent EUR (base)/USD (quote).
Early Wednesday, US stock index futures trade modestly higher on the day and helps EUR/USD hold its ground.
Later in the day, ADP Employment Change and ISM Services PMI data for May will be featured in the US economic docket. Investors expect the employment in the private sector to rise 173,000 in May and see the ISM Services PMI recovering back above 50 from 49.4 in April.
Earlier in the week, the disappointing ISM Manufacturing PMI triggered a USD selloff. In case the ISM Services PMI disappoints and shows an ongoing contraction in the service sector’s activity, the USD could come under a renewed selling pressure and open the door for a rebound in EUR/USD. On the other hand, an upbeat ISM Services PMI could support the USD and limit the pair’s upside.
EUR/USD Technical Analysis
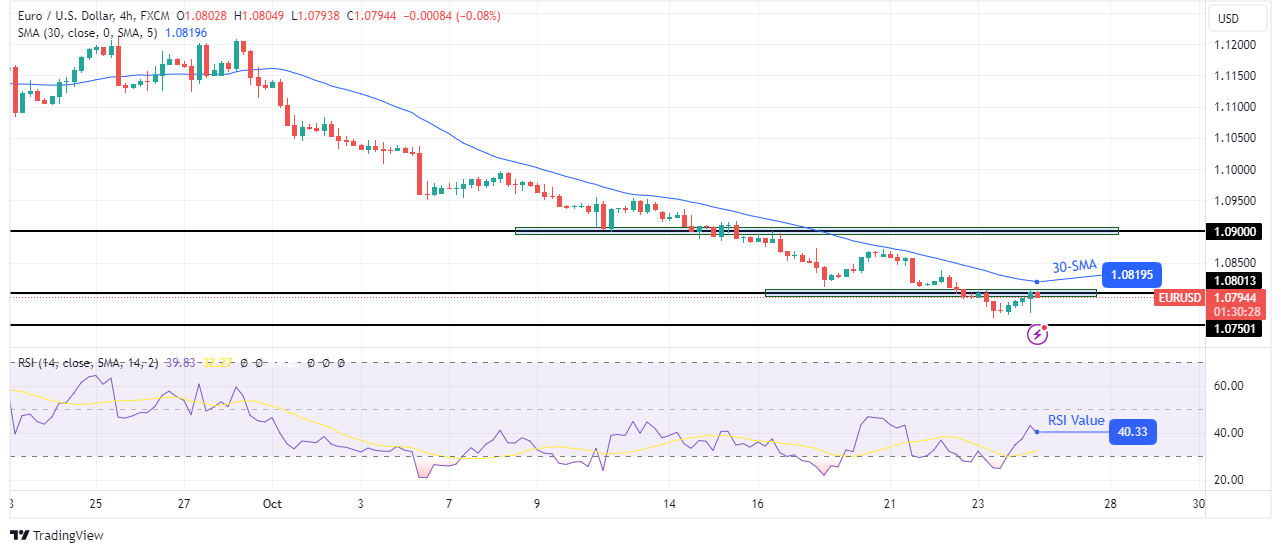
EUR/USD remains within the ascending regression channel but the Relative Strength Index (RSI) indicator stays near 50, suggesting that the pair is having a difficult time gathering bullish momentum.
On the downside, 1.0850-1.0840 (100-period Simple Moving Average (SMA), lower limit of the ascending channel) aligns as first support before 1.0800 (psychological level, static level) and 1.0780 (200-period SMA).
Resistances could be seen at 1.0900 (mid-point of the ascending channel, static level) ahead of 1.0950 (upper limit of the ascending channel).
Economic Indicator
ISM Services PMI
The Institute for Supply Management (ISM) Services Purchasing Managers Index (PMI), released on a monthly basis, is a leading indicator gauging business activity in the US services sector, which makes up most of the economy. The indicator is obtained from a survey of supply executives across the US based on information they have collected within their respective organizations. Survey responses reflect the change, if any, in the current month compared to the previous month. A reading above 50 indicates that the services economy is generally expanding, a bullish sign for the US Dollar (USD). A reading below 50 signals that services sector activity is generally declining, which is seen as bearish for USD.
Written by : Editorial team of BIPNs
Main team of content of bipns.com. Any type of content should be approved by us.
Share this article:


